

Abstract
Purpose
To prospectively evaluate in a phantom the effects of reconstruction kernel, field of view (FOV), and section thickness on automated measurements of pulmonary nodule volume.
Materials and Methods
Spherical and lobulated pulmonary nodules 3–15 mm in diameter were placed in a commercially available lung phantom and scanned by using a 16-section computed tomographic (CT) scanner. Nodule volume (V) was determined by using the diameters of 27 spherical nodules and the mass and density values of 29 lobulated nodules measured by using the formulas V = (4/3)πr3 (spherical nodules) and V = 1000 × (M/D) (lobulated nodules) as reference standards, where r is nodule radius; M, nodule mass; and D, wax density. Experiments were performed to evaluate seven reconstruction kernels and the independent effects of FOV and section thickness. Automated nodule volume measurements were performed by using computer-assisted volume measurement software. General linear regression models were used to examine the independent effects of each parameter, with percentage overestimation of volume as the dependent variable of interest.
Results
There was no substantial difference in the accuracy of volume estimations across the seven reconstruction kernels. The bone reconstruction kernel was deemed optimal on the basis of the results of a series of statistical analyses and other qualitative findings. Overall, volume accuracy was significantly associated (P < .0001) with larger reference standard–measured nodule diameter. There was substantial overestimation of the volumes of the 3–5-mm nodules measured by using the volume measurement software. Decreasing the FOV facilitated no significant improvement in the precision of lobulated nodule volume measurements. The accuracy of volume estimations—particularly those for small nodules—was significantly (P < .0001) affected by section thickness.
Conclusion
Substantial, highly variable overestimation of volume occurs with decreasing nodule diameter. A section thickness that enables the acquisition of at least three measurements along the z-axis should be used to measure the volumes of larger pulmonary nodules.
Background
The frequency with which small (4– 10-mm) indeterminate pulmonary nodules are being detected in clinical practice is increasing. This increasing detection, rather than reflecting a true increase in prevalence, most likely reflects an increase in the detection of these nodules that is facilitated by (a) the proliferation of computed tomographic (CT) examinations performed, including those for lung cancer screening in some centers; (b) the detection of pulmonary emboli; and (c) the lower thresholds for ordering CT in clinical practice. In populations at high risk for lung cancer, the prevalence of these indeterminate nodules ranges from 20% to 50% (1,2). Occasionally, these indeterminate nodules are not a diagnostic dilemma—for example, when a spiculated nodule is amenable to percutaneous biopsy.
Often, however, it is not possible to easily distinguish between benign and malignant small nodules (1,2), and more than 90% of lesions in such cases ultimately turn out to be benign. In general, it is quite difficult - if not impossible - to sample these nodules at percutaneous or bronchoscopic biopsy or to find them at thoracoscopic wedge resection. Thus, the current standard protocol is to periodically follow up these lesions—in 3-, 6-, or 12-month intervals, depending on the size—to assess growth (3).
Nodule size usually is recorded as a diameter value. Thus, for a 4-mm nodule, a 1-mm increase in diameter is approximately equivalent to a doubling in volume. However, current manual measurement techniques do not enable reliable and accurate distinction of the growth of nodules of this size, and the true growth of small pulmonary nodules is difficult to measure in clinical practice. Volumetric analysis has been proposed as a means of accurately and rapidly detecting growth, and it has been suggested that growth can be measured in as little as 30 days after the initial scanning (4,5). These analyses generally are performed in a meticulous fashion at a single institution where the imaging parameters can be tightly controlled. In general clinical practice, radiologists may be faced with differing acquisition parameters, the use of which might result in less accurate volume estimations. Thus, the purpose of our study was to prospectively evaluate in a phantom the effects of reconstruction kernel, field of view (FOV), and section thickness on automated pulmonary nodule volume measurements.
Materials and Methods
No financial support was received from GE Global Research. The authors had control of the data and information submitted for publication. The authors from the Medical University of South Carolina, who are neither employees of nor consultants for GE Global Research, controlled the inclusion of any data and information that might have represented a conflict of interest for the authors who are employees of that company.
Lung Phantom
A commercially available anthropomorphic thoracic phantom (QRM, Möhrendorf, Germany) was used for this study. This phantom has a simplified geometry and is composed of tissue-mimicking materials and thus simulates a cross section of the thorax in humans. This phantom is 300 mm in width (left to right), 200 mm in height (anterior to posterior), and 103 mm in length (superior to posterior) when placed such that its positioning emulates a supine headfirst patient orientation. The thoracic cavity was filled with ground cork to simulate the lung parenchyma. The mean CT attenuation of the cork that simulated lung parenchyma was -909.64 HU ± 50.08 (standard deviation), which is similar to the attenuation of normal lung parenchyma.
A total of 27 spherical lung nodules 3–15 mm in diameter (two each with diameters differing by 1 mm from 3–9 mm and 11–15 mm and three with a diameter of 10 mm) were simulated by using plastic spheres (mean attenuation, 29.24 HU ± 63.67), which were placed at specific locations in the simulated lung parenchyma and either secured in place (centrally and peripherally) by means of attachment to a plastic support wire (for spherical nodules ≤ 10 mm in diameter) or glued to the chest wall. In addition, 29 lobulated nodules approximately 3–16 mm in diameter (four nodules at 5 mm; three each from 3 to 6 mm at 0.5-mm increments; two each at 9, 12, 14, 15, and 16 mm; rounded to the nearest integer millimeter) and with volumes ranging from 41 to 2088 mm3 were simulated by using dental wax (mean attenuation, -144.82 ± 55.57). These 29 additional nodules were not fixed into position; rather, they were placed at various locations sufficiently far from the other nodules and were positioned such that they were embedded in and supported by the cork matrix (Figs 1, 2).
Figure 1.

Diagram and photograph of lung phantom.
A- Line drawing showing position of spherical nodules attached to wire and in juxtapleural and subpleural position.
B- Photograph shows lobulated wax nodules of various sizes in the cork matrix of the phantom.
Figure 2.

Transverse CT images show (a) spherical nodules attached to a wire and (b) five wax nodules (1–5) in cork matrix.
Determination of Reference-Standard Nodule Volume
Reference-standard volume measurements were performed by one investigator (W.M.L.). The actual volumes (V, in cubic millimeters) of the spherical nodules were calculated by using the equation V = (4/3)πr3, where r is the nodule radius, in millimeters. The actual volumes of the lobulated nodules were calculated by using the equation V = 1000 × (M/D), where M is the measured mass of the nodule, in milligrams, and D is the wax density, in grams per cubic centimeter. Nodule mass was determined by using a digital balance scale (Mettler-Toledo AG204 DeltaRange Scale; Mettler-Toledo, Columbus, Ohio) that records mass values to the nearest 0.001 of a gram. The density of the wax nodules was calculated by using the Archimedes principle—that is, by weighing the density twice, once in air and once in water— and then using the equation D = A/[(A - B) × Dw], where D is the computed density of the sample, A is the sample weight in air (in grams), B is the sample weight in water (in grams), and Dw is the density of distilled water (in grams per cubic centimeter) at the ambient room temperature.
The measured water temperature was accurate to the nearest 0.1°C, with a resultant error in distilled water density measurement no larger than ±0.002%. Because we used the ratio of the two weight measurements, the error in the computed density was no larger than ±0.01%. The error in the actual volume was dominated by the error in the measured nodule mass, because the worst-case error in the computed density was so small. For the smallest lobulated nodule, the error in volume measurement could be no larger than ±2.5% and was generally less than this because we used the average of five measurements of the mass of this lesion.
CT Protocol and Volume Evaluation
A number of CT scans of the phantom both with and without additional nodules were obtained by using a 16- section CT system (GE LightSpeed; GE Medical Systems, Milwaukee, WI). The protocol for all scan acquisitions involved the use of a helical pitch of 0.532:1, 120 kVp, 120 mA, and a 0.5-second rotation with a 50-cm FOV. This protocol allowed use of the various kernels, FOVs, and section thicknesses that may be encountered across a variety of clinical practices. The raw data from each scan were archived onto a digital video disc and used for a series of retrospective reconstructions with varying parameters. The display FOV, section thickness, and reconstruction kernel were varied in a systematic way according to a statistical design of experiments pattern. For each reconstruction, the image data were transferred to an AW computer workstation (GE Healthcare), where the volumes of 42 selected lung nodules (27 spherical, 15 lobulated) were measured by using a computer-assisted lung volume measurement software package (Lung Volume Computer Assisted Reading [VCAR]), which runs at the AW workstation. One investigator with 30 years’ experience in medical imaging (W.M.L.) performed all of the measurements at GE Global Research.
The purpose of the computer-assisted volume measurement package (VCAR) is to characterize and measure the volumes of user-identified lung nodules. The software has two modes: an exploration mode and an analysis mode. In the exploration mode, the software performs an initial automatic segmentation of the lung and the user is able to identify and select pulmonary nodules. After all nodules have been identified, the user switches the software to the analysis mode, in which the user can review each nodule that was identified during the exploration mode. This process begins with a watershed-based segmentation followed by a rule-based pruning performed by using the morphologic metrics Euclidean distance and Geodesic distance, which are designed to “remove” adjacent vascular structures. Attenuation values are not used for segmentation (6). Independent of the viewing window and viewing level, the software computes the volume, axis-aligned bounding box dimensions, and intensity characteristics of each nodule in turn, displaying the results in an annotated three-dimensional rendered view. The volume calculation compensates for the reconstruction kernel, section thickness, and partial volume effects.
Evaluation of Reconstruction Parameters
One investigator (W.M.L) performed all of the scan acquisitions at GE Global Research. To evaluate the reconstruction parameters, seven reconstruction kernels (STD [filter], lung, bone, bone+, edge, detail, and soft), four FOVs (9.6, 15, 26, and 36 cm), and four section thicknesses (0.625, 1.25, 2.50, and 5.00 mm) were chosen. The reconstruction kernels differed mainly in terms of the frequency cutoff at the higher spatial frequencies. The edge kernel deliberately emphasizes the higher spatial frequencies, whereas the soft kernel smoothes the image by imposing a lower frequency cutoff. The rest of the kernels have cutoff frequencies that are intermediate between those of the edge and soft kernels.
For a full factorial design of experiments, 8960 different reconstructions would be required so that every possible combination of parameters could be explored. Therefore, a limited initial experiment was performed with only the 3–10-mm spherical nodules to select the optimal reconstruction kernel. In this experiment, a total of 357 (17 × 7 × 3) volume estimations were performed by estimating the volumes of 17 nodules with use of seven kernels and three FOV– section thickness combinations: 15-cm FOV at 0.625-mm thickness, 25-cm FOV at 1.25-mm thickness, and 36-cm FOV at 1.25-mm thickness. The preferred reconstruction kernel was chosen on the bases of the results of a series of statistical tests (described in Statistical Analyses) performed to compare the predicted and actual nodule volumes and the subjective findings on three-dimensional renderings of the spherical and lobulated nodules generated with the different kernels. Once the optimal reconstruction kernel was chosen, subsequent scanning was performed by using that kernel to evaluate the independent effects of the four FOVs and four section thicknesses on the measured spherical and lobulated nodule volumes.
With use of 27 spherical nodules, a total of 1455 volume estimations were performed on the basis of nodule diameters ranging from 3 to 15 mm, four FOVs (9.6 cm [n = 190], 15 cm [n = 385], 26 cm [n = 321], 36 cm [n = 559]), and two section thicknesses (0.625 mm [n = 1421], 1.25 mm [n = 34]). The large number of estimations relative to the experimental variable combinations can be explained by the fact that the experimental protocol also included x-, y-, and z-axis “dithering,” which was used to help simulate natural variation in a patient's three-dimensional location in a CT scanner. With use of 29 lobulated nodules, a total of 1624 volume estimations were performed on the basis of nodule diameters ranging from 3 to 15 mm, four FOVs (9.6 cm [n = 232], 15 cm [n = 232], 26 cm [n = 232], 36 cm [n = 928]), and four section thicknesses (0.625 mm [n = 928], 1.25 mm [n = 232], 2.50 mm [n = 232], 5.00 mm [n = 232]). All lobulated nodule volume estimations were also performed with varying degrees of x-, y-, and z-axis dithering.
Statistical Analyses
The accuracy of each volume estimated by using the volume measurement software was expressed as a percentage overestimation of the reference-standard– estimated volume. In other words, accuracy was calculated by determining the difference between the software-estimated volume and the reference- standard–estimated volume and dividing this difference by the reference- standard volume. Thus, the theoretic range of accuracy measurements was -100% to infinity. For measurements of nodules of a given size, greater mean percentage overestimations are indicative of higher degrees of bias in the volume estimations, whereas greater standard deviations are associated with less precise volume estimations.
With use of Bonferroni correction to account for the fact that 21 comparisons were being performed, a multivariable general linear regression model was used with data from the first set of experiments to determine whether there was any significant difference in volume estimation accuracy across the seven reconstruction kernels after adjustments for nodule size (i.e., reference standard diameter), quadratic effect of nodule size, FOV, and section thickness. We also sought to determine whether any one kernel consistently yielded the least biased and most precise volume estimations. Finally, the quantitative analysis was accompanied by qualitative aesthetic assessments, which were performed by the research team to help select the reconstruction kernel that would be used in the subsequent experiments. In a post hoc fashion, we also performed multiple paired t tests to compare the volume estimation bias between all possible pairs of reconstruction kernels, with adjustment of the α level (.05/21 = 0.0024) by means of Bonferroni correction to account for the fact that 21 comparisons were being compared.
Additional regression models (stratified according to nodule type [spherical or lobulated]) were then used with data from the subsequent experiments performed with the selected kernel to determine the independent effects of FOV and section thickness while adjusting for nodule size. P values were determined by using F tests resulting from these models. Separate models for spherical and lobulated nodules were necessary owing to the increased variability among spherical nodule volume estimations, which was attributable to the spherical nodules being supported by wire within the lung phantom. To improve the model fit and because there was a lack of linearity between accuracy and nodule size, the regression models included both linear and quadratic effects for nodule diameter. In addition, interaction terms involving nodule diameter (linear and quadratic effects) and FOV and those involving nodule diameter and section thickness were allowed to enter the statistical models in a stepwise fashion (P < .10 to enter, P < .05 to remain). Since percentage overestimation of volume was the dependent variable in the regression models, model parameter estimates reflected the degree to which the experimental variables (FOV, section thickness, and/or nodule size) were associated with bias in volume measurement. All statistical tests were performed with SAS, version 9.1, software (SAS institute, Cary, NC) by using a cutoff of P < .05 to indicate statistical significance in all tests except the post hoc bone kernel paired t tests, in which P < .0024 indicated significance.
Results
Table 1 shows the reference-standard– measured diameters and volumes of the spherical and lobulated nodules.
Table 1.
Spherical and lobulated nodule diameters and volumes measured with reference standard.
| Nodule Diameter* (mm) | Volume of Spherical Plastic Nodules (mm3) | Volume of Lobulated Wax Nodules (mm3) |
|---|---|---|
| 3.0 | 14.1 | 16.8 |
| 3.5 | - | 27.1 |
| 4.0 | 33.5 | 39.9 |
| 4.5 | - | 57.9 |
| 5.0 | 65.4 | 78.9 |
| 5.5 | - | 103.6 |
| 6.0 | 113.1 | 131.8 |
| 7.0 | 179.6 | - |
| 8.0 | 268.1 | - |
| 9.0 | 381.7 | 368.0 |
| 10.0 | 523.6 | - |
| 11.0 | 696.9 | - |
| 12.0 | 904.8 | 921.5 |
| 13.0 | 1150.3 | - |
| 14.0 | 1436.8 | 1363.9 |
| 15.0 | 1767.1 | 1681.0 |
| 16.0 | 2088.0 |
Lobulated nodule diameters are equivalent to the diameters of spherical nodules, as calculated according to the equations defined in the text (V = 1000 × [M/D ] and V = [4/3]πr3).
Effect of Reconstruction Kernel
A total of 357 volume estimations were performed to select the optimal kernel from among seven kernels. In terms of the reconstruction kernel–related magnitude of and variability in volume estimation accuracy for the 3–10-mm spherical nodules (Fig 3), accuracy was poor (>15% overestimation of volume) for nodules smaller than 5 mm, with wide variability— indicative of poor precision— in volume estimations. Results of the multivariable regression model limited to the analysis of spherical nodules 6 mm in diameter or smaller indicated that there was no significant difference (P = .28) in accuracy across the reconstruction kernels after adjustments for nodule size (including linear and quadratic effects), FOV, and section thickness. When all nodule sizes were included in the analyses, there was a significant (P = .042) effect related to kernel, with the lung kernel yielding the least bias. However, after viewing the bias and precision estimates plotted according to kernel and nodule size, it appeared that no single kernel consistently yielded both the least biased and the most precise volume estimations across the various nodule sizes.
Figure 3.

Graph shows accuracy of nodule volumes estimated at various reconstruction kernels. In general, accuracy decreased as a function of decreasing nodule size, but no substantial difference in accuracy was attributable to reconstruction kernel.
Because the initial quantitative analyses did not reveal a clearly superior kernel, the final selection of the optimal kernel was based on qualitative findings. When we viewed the reconstructed images for aesthetic purposes, there was a consensus that the edge kernel overemphasized the high-frequency detail, while the soft kernel tended to “oversmooth” the images (with possible loss of salient detail). The cutoff frequency with use of the bone kernel was about midway between these extremes and appeared to yield the best compromise (Fig 4). Thus, the bone kernel was selected for the subsequent experiments. After performing post hoc pairwise t test analysis of the 3–10-mm spherical nodules, it became apparent that use of the lung kernel may have generated significantly less bias than did use of the bone kernel (mean bone kernel - lung kernel difference in percentage overestimation of volume, 8.66% ± 14.76 [standard deviation]; t = 3.89 [df = 43]; P = .0003). However, from a statistical perspective, a large aspect of the advantage in using the lung kernel rather than the bone kernel was the lower percentage overestimation of volume for nodules larger than 6 mm in diameter (mean bone kernel - lung kernel difference, 8.21% ± 3.04; t = 13.24 [df = 23]; P < .0001) compared with that for nodules 6mmor smaller (mean lung kernel- bone kernel difference, 9.20% ± 21.93; t = 1.87 [df = 19]; P = .076).
Figure 4.
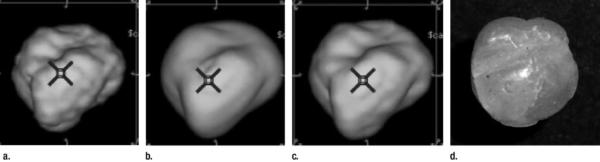
(a–c) CT image reconstructions of a lobulated nodule at (a) edge, (b) soft, and (c) bone kernels, and (d) photograph of the lobulated wax nodule used in the reconstructions and depicted in a–c.
Effect of FOV
There were 3079 nodule volume estimations performed by using the bone kernel to determine the independent effects of FOV and section thickness. Of these measurements, 1776 (57.7%) were performed in nodules 6 mm in diameter or smaller. In terms of the accuracy of the estimated volumes (means and standard deviations) of spherical and lobulated nodules of various sizes across the four FOVs (Table 2), the data appear to indicate that modest improvements in volume accuracy and precision were achieved with use of small FOVs. In the multivariable regression model for spherical nodules, larger FOV was significantly (P = .020) associated with greater bias in volume estimation: The measurements obtained by using the 36-mm FOV yielded an adjusted mean percentage overestimation of volume that was an absolute 2.85% higher than that with the 9.6-mm FOV. The effect of FOV was not significant in the final multivariable regression model for lobulated nodules (P = .11), which included adjustments for nodule size (linear and quadratic effects), section thickness, and interactions between the linear and quadratic effects of nodule size and section thickness.
Table 2.
Mean percentage overestimations of volume at various nodule sizes and FOVs.
| Spherical Nodules Field of View | Lobulated Nodules Field of View | |||||||
|---|---|---|---|---|---|---|---|---|
| Nodule size (ground truth) | 9.6cm | 15cm | 26cm | 36cm | 9.6cm | 15cm | 26cm | 36cm |
| 3 mm | 58.9 (41.7) [26] | 69.3 (59.1) [30] | 40.6 (49.7) [24] | 57.0 (40.4) [47] | −9.2 (3.4) [24] | −4.2 (4.9) [24] | −4.7 (3.2) [24] | 49.8 (48.6) [66] |
| 4mm | 3.9 (7.0) [26] | 14.8 (14.1) [30] | 7.9 (8.0) [26] | 18.2 (11.7) [53] | −7.7 (3.7) [56] | −4.7 (4.6) [56] | −5.5 (4.1) [56] | 27.0 (51.7) [184] |
| 5mm | 1.0 (4.8) [26] | 5.5 (7.9) [30] | 4.8 (6.3) [26] | 11.3 (5.9) [53] | −7.8 (3.3) [48] | −5.6 (3.3) [48] | −5.6 (3.3) [48] | 16.3 (50.4) [169] |
| 6mm | 0.4 (3.1) [26] | 0.6 (3.8) [30] | 3.0 (4.3) [19] | 5.5 (4.0) [53] | −5.8 (2.3) [56] | −4.1 (3.4) [56] | −3.2 (2.6) [56] | −2.3 (14.1) [217] |
| 9mm | N/A | −1.0 (1.7) [30] | 0.5 (2.3) [18] | 2.4 (1.7) [53] | −4.6 (0.2) [8] | −3.6 (0.3) [8] | −3.5 (0.3) [8] | −0.9 (2.3) [32] |
| 12mm | −0.9 (0.6) [20] | −0.8 (0.5) [26] | 0.0 (0.6) [20] | 0.0 (0.8) [20] | −0.1 (0.5) [16] | 0.0 (0.6) [16] | 0.8 (0.5) [16] | 4.9 (3.7) [64] |
| 15mm | N/A | −0.1 (0.4) [26] | 0.6 (0.3) [20] | 0.8 (0.2) [20] | −0.1 (0.2) [8] | −0.3 (0.2) [8] | 0.4 (0.3) [8] | 4.4 (2.9) [32] |
Note. Data are mean (± standard deviation) percentage overestimations of nodule volume measured at 9.6-, 15-, 26-, and 36-mm FOVs. The number of observations contributing to each mean value is given in parentheses. NA = not applicable: Measurements based on given combination of nodule size and FOV were not obtained because of time constraints.
Effect of Section Thickness
Because few measurements were performed in spherical nodules at section thicknesses other than 0.625 mm, multivariable regression analysis to specifically address section thickness was performed by using lobulated nodules only. Regression model results indicated a highly significant (P < .0001) effect of section thickness on percentage overestimation of volume (Table 3). In addition, there was a significant (P < .0001) relationship between section thickness and both the linear effects and the quadratic effects of nodule diameter on percentage overestimation of volume, with the effect of section thickness on volume overestimation being much more pronounced among the smaller nodules. For example, for a 3-mm lobulated nodule in which the volume was measured on 0.625-mm sections, the model predicted a 4.3% underestimation of volume compared with a predicted 151.9% overestimation if this nodule were measured on 5.00-mm sections. For a 6-mm nodule, however, the section thickness effect was less dramatic: The model predicted a 4.7% underestimation of volume measured on 0.625-mm sections versus a 23.7% overestimation of volume measured on 5.00-mm sections.
Table 3.
Mean percentage overestimations of volume at various nodule sizes and section thicknesses.
| Spherical Nodules CT Slice Thickness |
Lobulated Nodules CT Slice Thickness |
|||||||
|---|---|---|---|---|---|---|---|---|
| Nodule Diameter (reference standard) | 0.625mm | 1.25mm | 2.50mm | 5.00mm | 0.625mm | 1.25mm | 2.50mm | 5.00mm |
| 3mm | 57.2 (48.1) [124] | 58.0 (36.3) [3] | N/A | N/A | −4.7 (4.9) [96] | 56.0 (11.0) [24] | 108.9 (38.4) [18] | N/A |
| 4mm | 12.4 (12.2) [132] | 24.3 (4.6) [3] | N/A | N/A | −5.3 (4.3) [224] | −1.8 (4.5) [56] | 48.1 (45.5) [51] | 132.9 (36.7) [21] |
| 5mm | 6.6 (7.4) [132] | 12.6 (4.7) [3] | N/A | N/A | −5.9 (3.6) [192] | −0.2 (8.3) [48] | 7.1 (9.2) [48] | 105.3 (87.5) [25] |
| 6mm | 2.8 (4.4) [125] | 8.5 (3.4) [3] | N/A | N/A | −3.8 (3.0) [224] | 1.9 (4.9) [56] | 4.1 (4.7) [56] | −14.6 (24.7) [49] |
| 9mm | 1.0 (2.3) [98] | 4.3 (2.0) [3] | N/A | N/A | −3.7 (0.7) [32] | −1.2 (0.5) [8] | 2.3 (1.3) [8] | −1.8 (1.9) [8] |
| 12mm | −0.5 (0.7) [86] | N/A | N/A | N/A | 0.5 (0.8) [64] | 3.2 (0.6) [16] | 5.4 (0.5) [16] | 9.7 (3.8) [16] |
| 15mm | 0.4 (0.5) [66] | N/A | N/A | N/A | 0.3 (0.6) [32] | 2.9 (0.3) [8] | 5.2 (0.7) [8] | 8.4 (1.4) [8] |
Note. Data are mean (± standard deviation) percentage overestimations of nodule volume measured at 0.625-, 1.25-, 2.50-, and 5.00-mm section thicknesses. The number of observations contributing to each mean value is given in parentheses. NA = not applicable: Measurements based on given combination of nodule size and section thickness were not obtained because of time constraints.
Discussion
For volumetric analysis to be useful, it must be both accurate and reproducible. In controlled experiments, it is relatively easy to ensure the standardization of imaging parameters. However, in clinical practice, these parameters may vary. In addition, the time necessary to reconstruct data sets in different ways may be a hindrance to using volumetric analysis. Thus, it is necessary to understand the appropriate reconstruction parameters that should be used and to determine whether postprocessing (e.g., changing FOV) has any effect on measurement accuracy. Our study results indicate that reconstruction kernel and FOV do not appear to have clinically meaningful effects on pulmonary nodule volume estimations; however, section thickness has a significant effect on bias and precision, particularly for smaller nodules. The measurements obtained by using the 0.625-mm section thickness were superior, with minimal bias and maximal precision across all reference-standard diameters. The measurements obtained by using the 1.25-mm section thickness were particularly poor for 3-mm nodules, and those obtained by using the 2.50-mm section thickness were particularly poor for 4-mm or smaller nodules. Use of the 5.00-mm section thickness yielded particularly poor measurements for 5.00-mm and smaller nodules. Thus, for unbiased and precise volume estimation of small (<6 mm) pulmonary nodules, a section thickness of no greater than 1.00–1.25 mm should be used. Although the other reconstruction parameters had only small effects, they should be kept constant when obtaining follow-up measurements.
In our study, we sought to methodically evaluate the various imaging parameters to assess their effects on bias and precision in volume estimations. It was reassuring to find that while small variances were observed, reconstruction kernel and FOV did not yield substantially underestimated or substantially overestimated volumes. In our opinion, the bone kernel in the volume measurement software system that we used yields the best combination of accuracy and subjective image quality; however, overall bias may be best reduced by using the lung kernel. Results regarding the effects of FOV were mixed. Although significant FOV-related measurement improvements were seen among the spherical nodules, the absolute magnitude of the improvement was small, and no significant FOV-based differences in lobulated nodule measurements were observed. Because a few suspicious nodules encountered in clinical practice are purely spherical and according to our results, it is not necessary to use a coned-down FOV to obtain measurements. Thus, one can select the reconstruction kernel and FOV according to preference and be confident that the result will be accurate and reproducible for assessment, as long as the selected parameters are held constant at follow-up.
Clearly, section thickness is the most important parameter, and it becomes increasingly important with decreasing nodule size. This is because of the volume- averaging artifacts that are introduced when the section thickness approaches or exceeds the nodule size. We found that for nodules 6 mm or smaller, the section thickness should be 1.25 mm or less. For larger nodules, a section thickness that allows at least three measurements of the lesion is required, although measurement accuracy improves with decreasing section thickness at all sizes. Thus, depending on the detector array that is available, a section thickness of 0.625 mm or no greater than 1.25 mm is recommended for volume measurements. A section thickness of 2.50 mm is acceptable for nodules larger than 8 mm, but the use of a 5.00-mm section thickness is discouraged.
The findings in our study are in keeping with those in other similar studies—namely, that the preferred reconstruction kernel for volume measurement is a sharp or high-frequency algorithm (7,8). Contrary to the other study investigators, however, we did not observe a significant kernel-related difference in measurements and settled on the use of an intermediate (bone) kernel. It should be noted that in the other studies, only two kernel choices—high and low frequency— were analyzed. Although Honda et al (7) observed a significant difference in measured volume between these two kernels, they performed an in vivo study without using a reference-standard volume. Therefore, the differences in their measurements may represent a combination of volume underestimation and volume overestimation.
Like prior study investigators (7,9), we did not observe significant variations in the volumes of lobulated nodules with changing FOV. This was somewhat surprising because at a fixed matrix size, the voxel size decreases with decreasing FOV. Therefore, the expected observation was that of improved measurement accuracy with decreasing FOV. According to the results of both our study and prior investigations, there is no compelling reason to reconstruct images with a smaller FOV for lung nodule volume measurements. However, attempts to measure serial volumes with the same FOV should be made.
Investigators in several previous studies have also analyzed the effects of section thickness, often by using overlapping reconstruction algorithms (9–13). For the nodules not attached to the wire in our study, the mean percentage volume overestimation was similar for the spherical and lobulated nodules. Although we did not examine spiculated nodules, it has recently been suggested that the overestimation of the volumes of these lesions is even greater (11). Our decision to use non-overlapping sections may have affected the results we obtained with the 2.50- and 5.00-mm section thicknesses. Although it appears that overlapping sections are necessary with increasing section thickness, at section thicknesses of 1.25 mm and lower, section overlap does not substantially affect nodule volume measurements. It should be noted that at least three sections should be used to obtain an accurate measurement. Thus, the section thickness can conceivably be varied according to nodule size. For nodules smaller than 8 mm, a section thickness of 1.25 mm or less is recommended and overlapping sections are not necessary. If one decides to use a larger section thickness to measure nodules, an overlapping reconstruction should be considered (7); however, we did not formally evaluate this in our study.
Our study had limitations that were related to the use of a lung phantom. Our nodule analysis took place in an ideal motionless setting. Therefore, the contribution of inspiration depth to error could not be assessed. For nodules larger than 3 mm, the change in volume between expiration and inspiration may be as high as 23% (14). Thus, depth of inspiration may be a greater source of error than the parameters that we analyzed. Second, we used a semiautomated approach to measurement. In some cases, the attached wire—mimicking an adjacent vessel—was an important cause of variation from the reference-standard measurement. The effect of adjacent vessels was also investigated by Ko et al, who found that the mean error increased only slightly, by 2–3 mm3 for nodules smaller than 40 mm3 (15). In our model, the wire had a greater effect on nodule volume measurement, particularly at small sizes, and presumably reflected differences in the “vessel” phantom. The use of a humanadapted approach in which areas clearly not belonging to the nodule are interactively removed may have resulted in greater accuracy (16). However, this approach introduces another source of variability, and it is unclear whether radiologists in a busy clinical practice would take the time to make the meticulous changes that can be made in a clinical study. Thus, we believe the semiautomated approach is a better model for clinical practice.
Finally, we did not assess the effect of varying tube current in the context of the other selected parameters. It has been shown that error in the measurement of spherical nodule volumes increases with decreasing milliampere-second value (8). We speculate that the effect of noise on volume measurements would be greater for lobulated nodules, and this is an area of further study.
Practical applications
The choice of section thickness is critical for accurate pulmonary nodule volume measurement. It is preferable to perform these measurements with a section thickness of 1.25 mm or less; in lieu of this, however, the chosen section thickness should result in at least three sections intersecting the nodule. Since most scans are not routinely reconstructed with thin sections, if one decides to follow up with volumetric analysis, an additional reconstruction with 1.25-mm section thickness should be performed through the nodule. Other reconstruction parameters can be used at the discretion of the supervising radiologist. Every attempt should be made to keep these parameters constant at follow-up.
Advances in Knowledge
The choice of reconstruction algorithm and FOV, particularly when compared to slice thickness, does not substantially effect volumetric measurements.
When performing volumetric analysis of small pulmonary nodules (5-10mm), a slice thickness of no greater than 1.25 mm should be used. Thinner sections are necessary for volumetric analysis of nodules < 5mm.
Volume measurements of nodules 3–6 mm in diameter obtained by using volumetric software and CT section thicknesses of 0.625 mm or greater are often overestimations, which are most pronounced in 3–4-mm-diameter nodules.
Implications for Patient Care
Our study data suggest that when assessing nodules smaller than 10 mm, to ensure that volumetric assessments are within 5% of the actual volume, only CT section thicknesses of 0.625, 1.25, and 2.50 mm should be used to measure nodules 3–5 mm, 5–6 mm, and 6–10 mm in diameter, respectively.
Reconstruction kernel and FOV have minimal effects in volumetric analysis.
Acknowledgement
Supported by a grant from the Department of Defense Telemedicine and Advanced Technology Research Center, U.S. Army Medical Research and Material Command (Award W81XWH-05-1-0378).
References
- 1.Henschke CI, McCauley DI, Yankelevitz DF, et al. Early Lung Cancer Detection Project: overall design and findings from baseline screening. Lancet. 1999;354:99–105. doi: 10.1016/S0140-6736(99)06093-6. [DOI] [PubMed] [Google Scholar]
- 2.Swensen SJ, Jett JR, Hartman TE, et al. Lung cancer screening with CT: Mayo Clinic experience. Radiology. 2003;226:756–761. doi: 10.1148/radiol.2263020036. [DOI] [PubMed] [Google Scholar]
- 3.MacMahon H, Austin JH, Gamsu G, et al. Guidelines for management of small pulmonary nodules detected on CT scans: a statement from the Fleischner Society. Radiology. 2005;237:395–400. doi: 10.1148/radiol.2372041887. [DOI] [PubMed] [Google Scholar]
- 4.Reeves AP, Chan AB, Yankelevitz DF, Henschke CI, Kressler B, Kostis WJ. On measuring the change in size of pulmonary nodules. IEEE Trans Med Imaging. 2006;25:435–450. doi: 10.1109/TMI.2006.871548. [DOI] [PubMed] [Google Scholar]
- 5.Yankelevitz DF, Gupta R, Zhao B, Henschke CI. Small pulmonary nodules: evaluation with repeat CT—preliminary experience. Radiology. 1999;212:561–566. doi: 10.1148/radiology.212.2.r99au33561. [DOI] [PubMed] [Google Scholar]
- 6.Sirohey S. Lung VCAR: a technical description. GE Healthcare Web site; 2005. [May 10, 2007]. http://www.gehealthcare.com/usen/ct/clin_app/docs/9754WhtPprTech_4.pdf. [Google Scholar]
- 7.Honda O, Sumikawa H, Johkoh T, et al. Computer-assisted lung nodule volumetry from multi-detector row CT: influence of image reconstruction parameters. Eur J Radiol. 2007;62:106–113. doi: 10.1016/j.ejrad.2006.11.017. [DOI] [PubMed] [Google Scholar]
- 8.Ko JP, Rusinek H, Jacobs EL, et al. Small pulmonary nodules: volume measurement at chest CT—phantom study. Radiology. 2003;228:864–870. doi: 10.1148/radiol.2283020059. [DOI] [PubMed] [Google Scholar]
- 9.Goo JM, Tongdee T, Tongdee R, Yeo K, Hildebolt CF, Bae KT. Volumetric measurement of synthetic lung nodules with multi–detector row CT: effect of various image reconstruction parameters and segmentation thresholds on measurement accuracy. Radiology. 2005;235:850–856. doi: 10.1148/radiol.2353040737. [DOI] [PubMed] [Google Scholar]
- 10.Kostis WJ, Yankelevitz DF, Reeves AP, Fluture SC, Henschke CI. Small pulmonary nodules: reproducibility of three-dimensional volumetric measurement and estimation of time to follow-up CT. Radiology. 2004;231:446–452. doi: 10.1148/radiol.2312030553. [DOI] [PubMed] [Google Scholar]
- 11.Petrou M, Quint LE, Nan B, Baker LH. Pulmonary nodule volumetric measurement variability as a function of CT slice thickness and nodule morphology. AJR Am J Roentgenol. 2007;188:306–312. doi: 10.2214/AJR.05.1063. [DOI] [PubMed] [Google Scholar]
- 12.Winer-Muram HT, Jennings SG, Meyer CA, et al. Effect of varying CT section width on volumetric measurement of lung tumors and application of compensatory equations. Radiology. 2003;229:184–194. doi: 10.1148/radiol.2291020859. [DOI] [PubMed] [Google Scholar]
- 13.Zhao B, Schwartz LH, Moskowitz CS, et al. Pulmonary metastases: effect of CT section thickness on measurement—initial experience. Radiology. 2005;234:934–939. doi: 10.1148/radiol.2343040020. [DOI] [PubMed] [Google Scholar]
- 14.Goo JM, Kim KG, Gierada DS, Castro M, Bae KT. Volumetric measurements of lung nodules with multi-detector row CT: effect of changes in lung volume. Korean J Radiol. 2006;7:243–248. doi: 10.3348/kjr.2006.7.4.243. [DOI] [PMC free article] [PubMed] [Google Scholar]
- 15.Ko JP, Marcus R, Bomsztyk E, et al. Effect of blood vessels on measurement of nodule volume in a chest phantom. Radiology. 2006;239:79–85. doi: 10.1148/radiol.2391041453. [DOI] [PMC free article] [PubMed] [Google Scholar]
- 16.Bolte H, Riedel C, Jahnke T, et al. Reproducibility of computer-aided volumetry of artificial small pulmonary nodules in ex vivo porcine lungs. Invest Radiol. 2006;41:28–35. doi: 10.1097/01.rli.0000191366.05586.4d. [DOI] [PubMed] [Google Scholar]