

Abstract
Receptor interaction protein kinase 1 (RIP1) is a molecular cell-fate switch. RIP1, together with Fas-associated protein with death domain (FADD) and caspase-8, forms the RIPoptosome that activates apoptosis. RIP1 also associates with RIP3 to form the necrosome that triggers necroptosis. The RIPoptosome assembles through interactions between the death domains (DDs) of RIP1 and FADD and between death effector domains (DEDs) of FADD and caspase-8. In this study, we analyzed the overall structure of the RIP1 DD/FADD DD complex, the core of the RIPoptosome, by negative-stain electron microscopy and modeling. The results show that RIP1 DD and FADD DD form a stable complex in vitro similar to the previously described Fas DD/FADD DD complex, suggesting that the RIPoptosome and the Fas death-inducing signaling complex share a common assembly mechanism. Both complexes adopt a helical conformation that requires type I, II, and III interactions between the death domains.
Cell death has been actively studied in the medical research field for several decades due to its importance and involvement in many human diseases such as cancer and neurodegenerative diseases.1,2 As a result, it is now known that there are two major types of programmed cell death, apoptosis and necroptosis.3−5 Apoptosis is a major molecular program to eliminate potentially dangerous and unnecessary cells by intrinsic (mitochondrial) or extrinsic (death ligand-mediated) pathways. Necroptosis (also called programmed necrosis) contributes to the regulation of the immune system, cancer development, and stress-mediated cellular responses.6−8 Necrotic cell death was initially viewed as an accidental and unregulated event. However, many studies have shown that necrotic cell death can be programmed and regulated via unique signaling pathways.4,6,8,9
Apoptosis and necroptosis may be intertwined. For example, signaling events initiated by the binding of secreted and cell surface death ligands such as TNFα, FasL, and TRAIL to death receptors may lead to either apoptosis or necroptosis under different cellular contexts. Receptor interaction protein kinase 1 (RIP1) and 3 (RIP3), Fas-associated protein with death domain (FADD), and caspase-8 are the main downstream signaling components.6,10 RIP1, FADD, and caspase-8 assemble into a complex termed the RIPoptosome, which is responsible for apoptosis induction.11,12 However, when caspase activity is inhibited by pharmacological agents or during viral infections, RIP1 associates with RIP3 to form a complex termed the necrosome, which activates necroptosis.8,13
RIP1 contains a C-terminal death domain (DD) that allows the recruitment of FADD through homotypic DD–DD interactions (Figure 1A). FADD is an adaptor protein that contains an N-terminal death effector domain (DED) and a C-terminal DD. The N-terminal DED of FADD interacts with the caspase-8 DED. DED and DD both belong to the death domain superfamily, which also includes the caspase recruitment domain (CARD) and pyrin domain (PYD).14−16 While previous structural studies of the necrosome formed by RIP1 and RIP3 revealed a functional amyloid-like organization,17 the structural basis for the assembly of RIP1 and FADD within the RIPoptosome remains completely unknown.
Figure 1.

In vitro reconstitution and EM analysis of the RIP1 DD/FADD DD complex. (A) Domain organization of RIP3 and the RIPoptosome components, RIP1, FADD, and caspase-8. Interacting domains are indicated by blue circles. DD, death domain; DED, death effector domain. (B) Gel filtration profiles of RIP1 DD alone (black dotted line), FADD DD alone (black solid line), and the complex (red solid line). The inset shows an SDS-PAGE gel of the peak fractions of the complex. (C) Determination of the molar mass of the complex by multiangle light scattering (see also Supplementary Figure 4). (D) The 20 ISAC class averages with the highest cross correlation with the homology model of the RIP1 DD/FADD DD complex are shown (top rows), together with the corresponding projections from the model (bottom rows) and the cross-correlation coefficients. The averages show different projection views of the complex, indicating that it adsorbed to the grid in different orientations. The side length of the individual panels is 20.4 nm.
In this study, we reconstituted the RIP1 DD/FADD DD complex, the core of the RIPoptosome, and elucidated the overall structure of the complex by negative-stain electron microscopy (EM) and modeling, providing new insight into the mechanism underlying RIP1-mediated apoptosis and necroptosis. Our study shows that RIP1 DD and FADD DD form a stable complex in vitro with a structure similar to that of the Fas DD/FADD DD complex. The structure of the RIP1 DD/FADD DD complex is another example of the conserved interactions between domains in the DD superfamily. The results presented here suggest that a helical assembly using three distinct types of interactions is the general mechanism that underlies the assembly of domains of the DD superfamily.
Materials and Methods
Protein Expression and Purification
The death domains of RIP1 (residues 583–664) and FADD (residues 93–184) were subcloned into the plasmid vector pET26b (Novagen) with a C-terminal hexa-histidine tag. In another construct, glutathione S-transferase (GST) was added to the N terminus of RIP1. The domains were individually expressed in Escherichia coli CodonPlus strain BL21(DE3)-RIPL (Stratagene) following overnight induction at 20 °C, after which they were purified using Ni-NTA affinity resin (Qiagen). The RIP1 DD and FADD DD proteins were subsequently mixed at a molar ratio of approximately 1:1. Following incubation at room temperature for 1 h, the protein solution was concentrated to 8–10 mg/mL and applied to a Superdex 200 gel-filtration column HR 10/30 (GE Healthcare). The complex eluted at around 12–13 mL and was concentrated to 6–8 mg/mL.
Multiangle Light Scattering (MALS)
The molar mass of the RIP1 DD/FADD DD complex was determined by MALS using complexes formed either with His- or with GST-tagged RIP1. The complex was injected onto a Superdex 200 HR 10/30 gel-filtration column (GE Healthcare) that had been equilibrated in a buffer containing 20 mM Tris, pH 8.0, and 50 mM NaCl. The chromatography system was coupled to a three-angle light scattering detector (mini-DAWN EOS) and a refractive index detector (Optilab DSP) (Wyatt Technology). Data were collected every 0.5 s at a flow rate of 0.2 mL/min and analyzed using the ASTRA program, which gave the molar mass and mass distribution (polydispersity) of the sample.
Electron Microscopy and Image Processing
The RIP1 DD/FADD DD complex sample was diluted to a final concentration of 0.01 mg/mL in 50 mM NaCl and 20 mM Tris, pH 8.0, and then negatively stained with uranyl formate as previously described.18 Images were recorded with an FEI Tecnai T12 electron microscope (FEI, Hillsboro, OR) equipped with a LaB6 filament and operated at an acceleration voltage of 120 kV. Images were recorded using low-dose procedures on a 2000 × 2000 pixel CCD camera (Gatan, Pleasanton, CA) using a defocus of −1.5 μm and a nominal magnification of 52000×. The calibrated magnification was 70527×, yielding a pixel size of 2.13 Å on the specimen level.
BOXER, the display program associated with the EMAN software package,19 was used to interactively select 16368 particles from 283 CCD images, and the SPIDER software package20 was used to window the particles into 96 × 96 pixel images. To perform iterative stable alignment and clustering (ISAC)21 in SPARX,22 the size of the particle images was reduced to 64 × 64 pixels, and the particles were prealigned and centered. ISAC was run on the Orchestra High Performance Computing Cluster at Harvard Medical School (http://rc.hms.harvard.edu), specifying 200 images per group and a pixel error of 2. After 12 generations, 185 classes were obtained, accounting for 6066 particles (37% of the entire data set). Averages of these classes were calculated using the original 96 × 96 pixel images. The particles were also subjected to 10 cycles of multireference alignment in SPIDER. Each round of multireference alignment was followed by K-means classification, specifying 200 output classes. The references used for the first multireference alignment were randomly selected from the raw images.
To compare the class averages with the homology model of the RIP1 DD/FADD DD complex (see below), the model was Fourier transformed, filtered to 20 Å with a Butterworth low-pass filter, and transformed back. Evenly spaced projections were calculated at 4° intervals and subjected to 10 cycles of alignment with masked EM class averages. The 20 class averages with the highest cross correlation and the corresponding projections from the model are presented in Figure 1D.
Sequence Alignment
The amino acid sequences of DDs were analyzed using Clustal W (http://www.ebi.ac.uk/Tools/msa/clustalw2/).
Homology Modeling
A homology model of RIP1 DD was constructed using the SWISS-MODEL homology modeling server.23 The previously solved Fas DD structure (PDB id 3OQ9)24 was used as the modeling template. The stereochemical quality of the constructed model was validated with a Ramachandran plot generated using PROCHECK.25 Electrostatic surfaces and ribbon diagrams were generated using the PyMOL program (DeDeLano, W. L. (2002) The PyMOL Molecular Graphics System, DeLano Scientific, San Carlos).
Mutational Analysis of Complex Formation in Vitro
Site-directed mutagenesis was performed using the Quikchange kit (Stratagene) and confirmed by sequencing. Purified wild-type or mutant RIP1 DD and FADD DD proteins were first mixed and then incubated at room temperature for 1 h, after which the protein solutions were incubated with Ni-NTA resin for 1 h at room temperature. The protein samples were then loaded onto SDS-PAGE gels. The gels were stained with Coomassie Blue.
Complex Formation Assay by Gel-Filtration Chromatography
Purified wild-type or mutant RIP1 DD and FADD DD proteins were mixed, incubated for 1 h at room temperature, and concentrated to 8–10 mg/mL using a concentration kit (Millipore). The concentrated protein solutions were then applied to a Superdex 200 gel-filtration column 10/30 (GE healthcare) that had been pre-equilibrated with a solution of 20 mM Tris, pH 8.0, and 50 mM NaCl. Assembly of the complex was evaluated based on the positions of the eluted protein peaks monitored at 280 nm followed by SDS-PAGE.
Results
In Vitro Reconstitution and the Overall Structure of the RIP1 DD/FADD DD Complex
Recent studies have shown that RIP1 works as a molecular switch of cell fate.26 Upon death receptor–ligand interaction, RIP1 forms a complex with FADD and caspase-8, the RIPoptosome, which induces apoptosis. However, when caspase activity is inhibited under certain conditions, RIP1 instead forms a complex with RIP3, the necrosome, which triggers necroptosis (Figure 1A). RIP1 contains a C-terminal DD, which allows the recruitment of FADD through homotypic DD–DD interactions (Figure 1A). FADD is an adaptor protein that contains an N-terminal DED and a C-terminal DD. The N-terminal DED of FADD interacts with the tandem DED of caspase-8 (Figure 1A).
To elucidate the molecular basis of RIPoptosome formation, we expressed and purified RIP1 DD and FADD DD. Although RIP1 DD and FADD DD were both monomeric in solution; the two proteins formed an oligomeric complex when they were mixed together (Figure 1B). The complex eluted at ∼120 kDa from a gel-filtration column (Figure 1B). The molecular mass of the complex was measured at 118.7 kDa (2% fitting error) by multiangle light scattering (MALS) (Figure 1C). Since FADD DD and Fas DD also form a large oligomeric complex,24 we hypothesized that RIP1 DD may interact with FADD DD in a similar fashion.
Electron microscopy (EM) of negatively stained RIP1 DD/FADD DD complexes revealed a monodispersed and homogeneous particle population (Supplementary Figure 1). Analysis of about 16000 particle images by the iterative stable alignment and clustering (ISAC) procedure yielded 185 classes (Supplementary Figure 2). K-means classification of all the particles into 200 classes using SPIDER20 (Supplementary Figure 3) confirmed that the ISAC averages are a good representation of the entire particle population. The ISAC averages depict molecules of similar size (∼9 nm) with structural features similar to those of the recently published Fas DD/FADD DD complex (Figure 1D, upper panels). Projections from a homology model of the RIP1 DD/FADD DD complex based on the structure of the Fas DD/FADD DD complex (see below) are in good agreement with the experimental class averages (Figure 1D, lower panels).
The Fas DD/FADD DD complex consists of five to seven Fas DD and five FADD DD molecules in solution. The sixth and seventh Fas DD molecules are least tightly bound resulting in the crystallization of the core 5:5 Fas DD/FADD DD complex.24 The apparent similarity with the Fas DD/FADD DD complex under EM prompted us to determine the exact stoichiometry in the RIP1 DD/FADD DD complex. The MALS measurement of 118.7 kDa (Figure 1C) already suggested a five RIP1 DD (10.6 kDa) and five FADD DD (11.79 kDa) complex, which has a calculated molecular mass of 111.3 kDa. However, because of the similar molecular weights of the RIP1 and FADD DDs, the same molecular mass is also consistent with other stoichiometries such as 4:6 or 3:7. To increase the accuracy of the stoichiometry determination, we performed MALS experiments on a complex that contains GST-tagged RIP1 DD. The added GST increases the difference in the molecular weights of RIP1 DD and FADD DD and thus results in a better discrimination index (Supplementary Figure 4A). GST-tagged RIP1 formed a complex with FADD DD in solution, and the complex eluted at ∼200 kDa from a gel-filtration column (Supplementary Figure 4B). MALS measurement gave a molecular mass for this complex of ∼244.2 kDa (2.3% fitting error) (Supplementary Figure 4C). This value is consistent with a complex of five GST-tagged RIP1 DD (each 37.3 kDa) and five His-tagged FADD DD (each 11.8 kDa), which has a calculated molecular mass of 245.4 kDa.
Structure-Based Modeling of RIP1 DD and Comparison with the Structure of the Fas DD/FADD DD Complex
Alignment revealed that RIP1 DD and Fas DD share a high sequence similarity, with 25% sequence identity (Figure 2A). Structural information is available for three death domain complexes, the PIDDosome (RAIDD DD/PIDD DD), the MyDDosome (MyD88 DD/IRAK2 DD/IRAK4 DD), and DISC (Fas DD/FADD DD). All three complexes assemble via a unique oligomerization mechanism that uses three types of interactions (types I, II, and III) at six unique interfaces (types Ia, Ib, IIa, IIb, IIIa, and IIIb).24,27 The type Ia surface is primarily formed by residues at the H1 and H4 helices and interacts with the type Ib surface, which is formed mainly by residues at the H2 and H3 helices. The type IIa surface formed by residues at the H4 helix and the H4–H5 loop interacts with the type IIb surface formed by the H6 helix and the H5–H6 loop. The type IIIa surface formed by residues at the H3 helix interacts with the type IIIb surface formed by residues at the H1–H2 and H3–H4 loops (Figure 2B). A previous structure-based mutation study showed that Fas mutations E272K (type Ia), R250E (type Ib), Q283K (type IIa), K287D (type IIa), T305K (type IIb), N302K (type IIb), E261K (type IIIa) and T270K (type IIIb), which change key residues for each type of interaction, all disrupt complex formation except for mutations at the type IIb surface (T305K and N302K).24
Figure 2.

Analyses of the putative interfaces involved in the assembly of the RIP1 DD/FADD DD complex. (A) Alignment of the Fas DD and RIP1 DD sequences. Amino acid residues in Fas DD that have been identified to be important for interaction with FADD DD are shown in red. The corresponding residues in RIP1 DD are also shown in red. (B) The top panel shows a schematic diagram of the three types of contacts in DD/DD complexes. The bottom panel shows the structure of the Fas DD/FADD DD complex, a representative DD/DD complex, which was determined at neutral pH. (C) Homology model of the RIP1 DD. The model was generated using the homology modeling server SWISS-MODEL and the Fas DD structure (PDB id 3OQ9) as the template. (D) Surface of RIP1 DD. RIP1 DD residues corresponding to the Fas DD residues that are critical for interaction with FADD DD are shown in red.
Residues in Fas DD that upon mutation disrupt complex formation are well conserved in the sequence of RIP1 DD (Figure 2A). Therefore, we modeled the RIP1 DD structure based on the structure of Fas DD (PDB id 3OQ9) (Figure 2C) and mapped the mutations that might disrupt the formation of the RIP1 DD/FADD DD complex on the modeled structure of RIP1 DD (Figure 2D). A representative type Ia mutation in Fas DD, E272K, corresponds to the E626K mutation in RIP1 DD, while the R250E (type Ib) mutation in Fas DD corresponds to R603E in RIP1 DD. Similarly, Q283K (type IIa) in Fas DD corresponds to M637K in RIP1 DD, K287D (type IIa) in Fas DD corresponds to K642D in RIP1 DD, E261K (type IIIa) in Fas DD corresponds to E614K in RIP1 DD, and T270K (type IIIb) in Fas DD corresponds to G623K in RIP1 DD.
Mutations Generated Based on the Fas DD/FADD DD Structure Disrupt RIP1 DD/FADD DD Complex Formation
To study the assembly of RIP1 DD and FADD DD into the RIPoptosome, which may be similar to that of the Fas DD/FADD DD complex, we generated sequence- and structure-based mutations at the six potential interfaces used in the three interaction modes and analyzed complex formation by a His tag pull-down assay followed by gel-filtration chromatography. Our experimental data showed that the mutations disrupted complex formation as expected. Although untagged wild-type RIP1 DD coeluted with His-tagged FADD DD when the proteins were mixed and loaded onto a Ni-NTA affinity column (Figure 3A), RIP1 carrying the R603E (type Ib disruption), E614K (type IIIa disruption), G623K (type IIIb disruption), E626K (type Ia disruption), M637K (type IIa disruption), and K642D (type IIa disruption) mutations did not coelute with FADD DD (Figure 3B). As a control, the K604E mutant, carrying a mutation at a residue not involved in complex formation, comigrated with FADD DD (Figure 3B). RIP1 DD with the D660K mutation at the type IIb surface still formed a strong complex with FADD DD (Figure 3B). This finding is consistent with the previous observation that disruption of the type IIb interface on Fas DD did not block formation of the Fas DD/FADD DD complex. The results of the present study support the notion that the assembly mechanism of the RIP1 DD/FADD DD complex is essentially identical to that of the Fas DD/FADD DD complex.
Figure 3.

Mutagenesis of RIP1 DD residues at surfaces implicated in the interaction with FADD DD. (A) Untagged wild-type RIP1 DD is pulled down with His-tagged FADD DD. M, size marker; E, elution fraction. (B) Pull-down analysis of the effect of mutations of residues in putative interaction surfaces of RIP1 DD on the in vitro association with His-tagged FADD DD. (C) Gel-filtration chromatography analysis of the association of RIP1 DD mutants with FADD DD. The black arrow indicates the position in the gel-filtration chromatograph where the RIP1 DD/FADD DD complex elutes.
The inability of RIP1 DD mutants to form complexes with FADD DD was further confirmed by gel-filtration chromatography (Figure 3C). Although pull-down analysis showed that RIP1 DD D660K could still form a complex with FADD DD, gel-filtration analysis did not show a peak for this complex (Figure 3A). This result suggests that the D660K mutation weakens but does not completely disrupt complex formation. Interestingly, the D660K mutant formed a smaller sized complex with FADD DD that eluted around 15 mL in gel filtration, suggesting that it may form a stable intermediate complex or may exist in an equilibrium between an unstable large complex, intermediate complex, and even monomers. However, because smaller complexes were never seen in previously studied DD complexes, further investigations are required to address the effects of the D660K mutation at the type IIb interface.
Pull-down experiments were also performed with His-tagged FADD mutants and untagged RIP1. Mutations introduced in FADD included R117E (type Ib), D123R (type IIIa), R135E (type IIIb), R142E (type Ia), L172K (type IIb), K153E (type IIa), N150K (type IIa), and D175K (type IIb) (Figure 4A). Although untagged RIP1 DD coeluted with His-tagged wild-type FADD DD, the RIP1 mutants did not coelute with FADD DD (Figure 4B). As in the Fas DD/FADD DD complex, disruption of the type IIa interface by the N150K mutation did not show a distinct effect on complex formation (Figure 3B). In summary, the mutagenesis results presented here are fully consistent with the structure of the RIP1 DD/FADD DD complex that was modeled based on the structure of the Fas DD/FADD DD complex.
Figure 4.
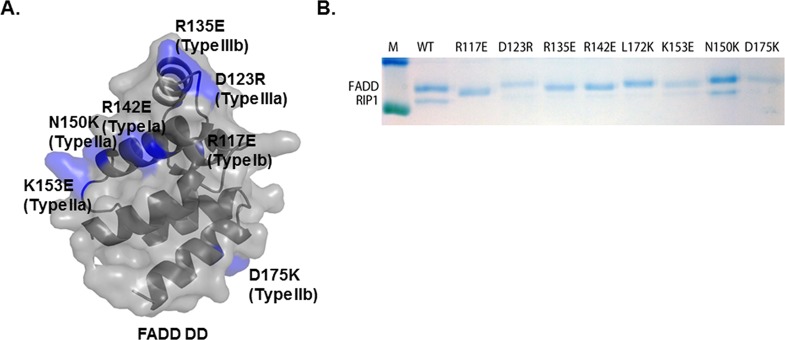
Pull-down analysis of untagged RIP1 DD with His-tagged wild-type and mutant FADD DD. (A) Surface of FADD DD. Residues are indicated that are critical for the interaction with Fas DD and were mutated in this study. (B) Pull-down analysis of the effect of mutations of residues in putative interaction surfaces of His-tagged FADD DD on the in vitro association with untagged RIP1 DD.
Model for the RIP1 DD/FADD DD Complex, The Core Oligomerization Platform of the RIPoptosome
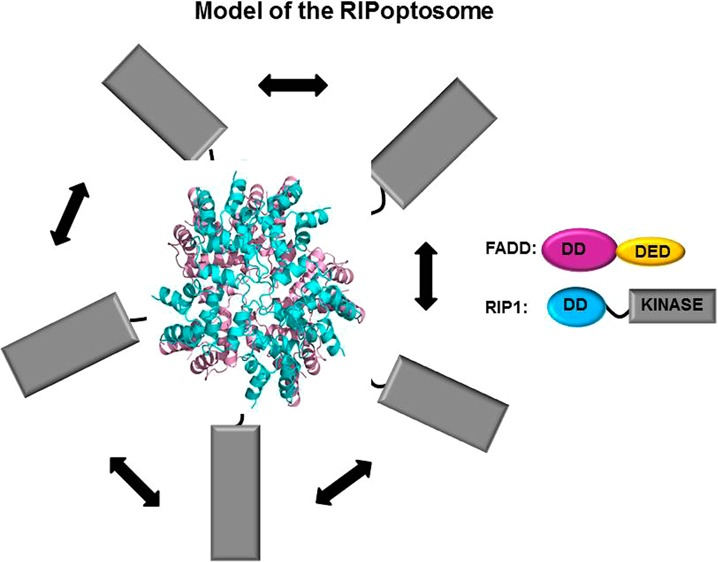
Given their apparent similarity in assembly, we modeled the structure of the RIP1 DD/FADD DD complex based on the previously determined structure of the Fas DD/FADD DD complex. We superimposed the modeled RIP1 DD with Fas DD in the Fas DD/FADD DD complex structure. All five Fas DDs superimposed well with the RIP1 DDs, with an average RMSD of 1.5 Å. In our model of the RIP1 DD/FADD DD complex, the top layer is formed by five RIP DDs and the bottom layer by five FADD DDs (Figure 5A,B). Finally, to create a schematic model of the full RIPoptosome, we added the C-terminal DED of FADD and the C-terminal kinase domain of RIP1. Since the C termini of the DDs are located at the periphery of the complex, these additional domains can easily be accommodated by the RIP1 DD/FADD DD assembly (Figure 5C).
Figure 5.

Model of the RIPoptosome. (A) Side view of the model for the RIP1 DD/FADD DD complex. The top layer of the complex contains five RIP1 DDs (cyan), and the bottom layer contains five FADD DDs (pink). (B) Top view of the model of the RIP1 DD/FADD DD complex. (C) Schematic model of the full RIPoptosome containing the C-terminal death effector domain (DED) of FADD and the C-terminal kinase domain of RIP1. (D) Schematic planar diagram showing the construction of RIP1 DD/FADD DD complex. The positions of the three different types of contacts are shown. The locations of two different subtypes of type II contacts are also shown as IIa and IIb on the representative RIP1 DD and FADD DD molecules.
Discussion
The DD superfamily is one of the largest domain classes that mediate protein interactions. The DD superfamily is divided into four subfamilies: the death domain (DD), death effector domain (DED), caspase recruitment domain (CARD), and pyrin domain (PYD) families. Proteins that contain domains of the DD superfamily play critical roles in a number of cellular functions, including apoptosis, inflammation, and necrosis. Structural and biochemical studies revealed that domains of the DD subfamily assemble into large oligomeric protein complexes. The prototype of the DD complexes is the PIDDosome, which consists of RAIDD DD and PIDD DD.28 More recently, the structures of the MyDDosome and the Fas/FADD DD complex became available.24,28,29
It is well-known that RIP1 is involved in both apoptosis and necroptosis via formation of large molecular complexes with FADD, caspase-8, and RIP3. In this study, we characterized the overall structure of the RIP1 DD/FADD DD complex, the central core of the RIPoptosome. Our biochemical studies showed that RIP1 DD and FADD DD can form a stable complex under neutral pH conditions. Assuming that RIP1 DD and FADD DD assemble in a similar way as Fas DD and FADD DD, we propose that the RIP1 DD/FADD DD complex consists of five RIP1 DDs and five FADD DDs. This notion is corroborated by EM averages of the RIP1 DD/FADD DD complex that revealed structural features similar to those of the Fas DD/FADD DD complex. A 5:5 stoichiometry of the RIP1 DD/FADD DD complex is also supported by molecular mass measurements by MALS, which yielded 118.7 kDa for the wild-type complex. We therefore modeled the structure of the RIP1 DD/FADD DD complex based on the available structure of the Fas DD/FADD DD complex. The model was tested by mutagenesis, and the results were consistent with the model. The model for the structure of the RIP1 DD/FADD DD complex presented in this study provides structural information for another DD/DD complex and highlights the general assembly mechanism used by domains of the DD superfamily. Because DD, DED, CARD, and PYD share similar structural features, we expect that these domains assemble into large complexes similar to those formed by DDs.
Interestingly, while some DD superfamily domains form helical filaments,30−32 the RIP1 DD/FADD DD complex, as well as a number of other DD complex structures we determined previously,24,27,29 appears to exhibit a defined size. A plausible explanation is that the type IIb surface of RIP1 DD does not have sufficient affinity for binding additional domains above (Figure 5D). Similarly, the type IIa surface of FADD DD does not have sufficient affinity for binding additional domains below (Figure 5D), preventing stable association of more subunits and thus limiting the size of the helical assembly. It should be noted that the type IIb surface of RIP1 DD and the type IIa surface of FADD DD do not participate in the assembly of the core 5:5 RIP1 DD/FADD DD complex. The oligomeric helical assembly of the DDs is important for the regulation of apoptosis initiation by providing the platform for caspase-8 dimerization and activation. The cooperativity in the complex formation may itself serve the purpose to set up a threshold for the tight regulation of caspase activation and apoptosis.
Acknowledgments
We thank Dr. Pawel Penczek for guidance in the use of SPARX and ISAC. The Orchestra High Performance Computing Cluster at Harvard Medical School is a shared facility partially supported by NIH Grant NCRR 1S10RR028832-01.
Supporting Information Available
Representative raw image of RIP1 DD/FADD DD complex in negative stain, 185 class averages of negatively stained RIP1 DD/FADD DD complex obtained from 12 generations of the iterative stable alignment and clustering (ISAC) procedure, averages obtained by classifying all 16368 particles of negatively stained RIP1 DD/FADD DD complex into 200 classes using K-means classification, and analysis of the complex formed by GST-tagged RIP1 DD and FADD DD. This material is available free of charge via the Internet at http://pubs.acs.org.
Author Present Address
▽ Department of Otolaryngology, Massachusetts Eye and Ear Infirmary, and Department of Otology and Laryngology, Harvard Medical School, Boston, MA 02114, USA.
The authors declare no competing financial interest.
This study was supported by the Basic Science Research Program through the National Research Foundation of Korea (NRF) of the Ministry of Education, Science and Technology (Grant NRF-2012R1A2A2A01010870) and a grant from the Korea Healthcare Technology R&D Project, Ministry of Health & Welfare, Republic of Korea (Grant HI13C1449). T.W. is an investigator with the Howard Hughes Medical Institute.
Funding Statement
National Institutes of Health, United States
Supplementary Material
References
- Kerr J. F.; Wyllie A. H.; Currie A. R. (1972) Apoptosis: A basic biological phenomenon with wide-ranging implications in tissue kinetics. Br. J. Cancer 26, 239–257. [DOI] [PMC free article] [PubMed] [Google Scholar]
- Evan G. I.; Vousden K. H. (2001) Proliferation, cell cycle and apoptosis in cancer. Nature 411, 342–348. [DOI] [PubMed] [Google Scholar]
- Feoktistova M.; Geserick P.; Panayotova-Dimitrova D.; Leverkus M. (2012) Pick your poison: the Ripoptosome, a cell death platform regulating apoptosis and necroptosis. Cell Cycle 11, 460–467. [DOI] [PubMed] [Google Scholar]
- Nehs M. A.; Lin C. I.; Kozono D. E.; Whang E. E.; Cho N. L.; Zhu K.; Moalem J.; Moore F. D. Jr.; Ruan D. T. (2011) Necroptosis is a novel mechanism of radiation-induced cell death in anaplastic thyroid and adrenocortical cancers. Surgery 150, 1032–1039. [DOI] [PubMed] [Google Scholar]
- Wrighton K. H. (2011) Cell death: A killer puts a stop on necroptosis. Nat. Rev. Mol. Cell Biol. 12, 279. [DOI] [PubMed] [Google Scholar]
- Wu W.; Liu P.; Li J. (2012) Necroptosis: An emerging form of programmed cell death. Crit. Rev. Oncol. Hematol. 82, 249–258. [DOI] [PubMed] [Google Scholar]
- Christofferson D. E.; Yuan J. (2010) Necroptosis as an alternative form of programmed cell death. Curr. Opin. Cell Biol. 22, 263–268. [DOI] [PMC free article] [PubMed] [Google Scholar]
- Cho Y. S.; Challa S.; Moquin D.; Genga R.; Ray T. D.; Guildford M.; Chan F. K. (2009) Phosphorylation-driven assembly of the RIP1-RIP3 complex regulates programmed necrosis and virus-induced inflammation. Cell 137, 1112–1123. [DOI] [PMC free article] [PubMed] [Google Scholar]
- Edinger A. L.; Thompson C. B. (2004) Death by design: Apoptosis, necrosis and autophagy. Curr. Opin. Cell Biol. 16, 663–669. [DOI] [PubMed] [Google Scholar]
- Moquin D.; Chan F. K. (2010) The molecular regulation of programmed necrotic cell injury. Trends Biochem. Sci. 35, 434–441. [DOI] [PMC free article] [PubMed] [Google Scholar]
- Feoktistova M.; Geserick P.; Kellert B.; Dimitrova D. P.; Langlais C.; Hupe M.; Cain K.; MacFarlane M.; Hacker G.; Leverkus M. (2011) cIAPs block Ripoptosome formation, a RIP1/caspase-8 containing intracellular cell death complex differentially regulated by cFLIP isoforms. Mol. Cell 43, 449–463. [DOI] [PMC free article] [PubMed] [Google Scholar]
- Wang L.; Du F.; Wang X. (2008) TNF-alpha induces two distinct caspase-8 activation pathways. Cell 133, 693–703. [DOI] [PubMed] [Google Scholar]
- He S.; Wang L.; Miao L.; Wang T.; Du F.; Zhao L.; Wang X. (2009) Receptor interacting protein kinase-3 determines cellular necrotic response to TNF-alpha. Cell 137, 1100–1111. [DOI] [PubMed] [Google Scholar]
- Park H. H.; Lo Y. C.; Lin S. C.; Wang L.; Yang J. K.; Wu H. (2007) The Death Domain Superfamily in Intracellular Signaling of Apoptosis and Inflammation. Annu. Rev. Immunol. 25, 561–586. [DOI] [PMC free article] [PubMed] [Google Scholar]
- Park H. H. (2012) PYRIN domains and their interactions in the apoptosis and inflammation signaling pathway. Apoptosis 17, 1247–1257. [DOI] [PubMed] [Google Scholar]
- Bae J. Y.; Park H. H. (2011) Crystal structure of NALP3 protein pyrin domain (PYD) and its implications in inflammasome assembly. J. Biol. Chem. 286, 39528–39536. [DOI] [PMC free article] [PubMed] [Google Scholar]
- Li J.; McQuade T.; Siemer A. B.; Napetschnig J.; Moriwaki K.; Hsiao Y. S.; Damko E.; Moquin D.; Walz T.; McDermott A.; Chan F. K.; Wu H. (2012) The RIP1/RIP3 necrosome forms a functional amyloid signaling complex required for programmed necrosis. Cell 150, 339–350. [DOI] [PMC free article] [PubMed] [Google Scholar]
- Ohi M.; Li Y.; Cheng Y.; Walz T. (2004) Negative Staining and Image Classification - Powerful Tools in Modern Electron Microscopy. Biol. Proced. Online 6, 23–34. [DOI] [PMC free article] [PubMed] [Google Scholar]
- Ludtke S. J.; Baldwin P. R.; Chiu W. (1999) EMAN: Semiautomated software for high-resolution single-particle reconstructions. J. Struct. Biol. 128, 82–97. [DOI] [PubMed] [Google Scholar]
- Frank J.; Radermacher M.; Penczek P.; Zhu J.; Li Y.; Ladjadj M.; Leith A. (1996) SPIDER and WEB: Processing and visualization of images in 3D electron microscopy and related fields. J. Struct. Biol. 116, 190–199. [DOI] [PubMed] [Google Scholar]
- Yang Z.; Fang J.; Chittuluru J.; Asturias F. J.; Penczek P. A. (2012) Iterative stable alignment and clustering of 2D transmission electron microscope images. Structure 20, 237–247. [DOI] [PMC free article] [PubMed] [Google Scholar]
- Hohn M.; Tang G.; Goodyear G.; Baldwin P. R.; Huang Z.; Penczek P. A.; Yang C.; Glaeser R. M.; Adams P. D.; Ludtke S. J. (2007) SPARX, a new environment for Cryo-EM image processing. J. Struct. Biol. 157, 47–55. [DOI] [PubMed] [Google Scholar]
- Schwede T.; Kopp J.; Guex N.; Peitsch M. C. (2003) SWISS-MODEL: An automated protein homology-modeling server. Nucleic Acids Res. 31, 3381–3385. [DOI] [PMC free article] [PubMed] [Google Scholar]
- Wang L.; Yang J. K.; Kabaleeswaran V.; Rice A. J.; Cruz A. C.; Park A. Y.; Yin Q.; Damko E.; Jang S. B.; Raunser S.; Robinson C. V.; Siegel R. M.; Walz T.; Wu H. (2010) The Fas-FADD death domain complex structure reveals the basis of DISC assembly and disease mutations. Nat. Struct Mol. Biol. 17, 1324–1329. [DOI] [PMC free article] [PubMed] [Google Scholar]
- Laskowski R. A.; Rullmannn J. A.; MacArthur M. W.; Kaptein R.; Thornton J. M. (1996) AQUA and PROCHECK-NMR: programs for checking the quality of protein structures solved by NMR. J. Biomol NMR 8, 477–486. [DOI] [PubMed] [Google Scholar]
- O’Donnell M. A.; Legarda-Addison D.; Skountzos P.; Yeh W. C.; Ting A. T. (2007) Ubiquitination of RIP1 regulates an NF-kappaB-independent cell-death switch in TNF signaling. Curr. Biol. 17, 418–424. [DOI] [PMC free article] [PubMed] [Google Scholar]
- Park H. H.; Logette E.; Rauser S.; Cuenin S.; Walz T.; Tschopp J.; Wu H. (2007) Death domain assembly mechanism revealed by crystal structure of the oligomeric PIDDosome core complex. Cell 128, 533–546. [DOI] [PMC free article] [PubMed] [Google Scholar]
- Park H. H. (2011) Structural analyses of death domains and their interactions. Apoptosis 16, 209–220. [DOI] [PubMed] [Google Scholar]
- Lin S. C.; Lo Y. C.; Wu H. (2010) Helical assembly in the MyD88-IRAK4-IRAK2 complex in TLR/IL-1R signalling. Nature 465, 885–890. [DOI] [PMC free article] [PubMed] [Google Scholar]
- Xu H.; He X.; Zheng H.; Huang L. J.; Hou F.; Yu Z.; de la Cruz M. J.; Borkowski B.; Zhang X.; Chen Z. J.; Jiang Q. X. (2014) Structural basis for the prion-like MAVS filaments in antiviral innate immunity. eLife 3, e01489. [DOI] [PMC free article] [PubMed] [Google Scholar]
- Lu A.; Magupalli V. G.; Ruan J.; Yin Q.; Atianand M. K.; Vos M. R.; Schroder G. F.; Fitzgerald K. A.; Wu H.; Egelman E. H. (2014) Unified polymerization mechanism for the assembly of ASC-dependent inflammasomes. Cell 156, 1193–1206. [DOI] [PMC free article] [PubMed] [Google Scholar]
- Qiao Q.; Yang C.; Zheng C.; Fontan L.; David L.; Yu X.; Bracken C.; Rosen M.; Melnick A.; Egelman E. H.; Wu H. (2013) Structural architecture of the CARMA1/Bcl10/MALT1 signalosome: nucleation-induced filamentous assembly. Mol. Cell 51, 766–779. [DOI] [PMC free article] [PubMed] [Google Scholar]
Associated Data
This section collects any data citations, data availability statements, or supplementary materials included in this article.