

Abstract
Tumor necrosis factor receptor II (TNFRII) is one of the TNF receptor superfamily members and our recent pathological studies show that TNFRII is deficient in the brains of Alzheimer's disease (AD). However, the mechanisms of TNFRII in AD pathogenesis remain unclear. In the present study, by using the gene-targeting approach to delete TNFRII in AD transgenic mouse model, we found that, in the brain of APP23 mice with TNFRII deletion (APP23/TNFRII−/−), AD-like pathology, i.e. plaque formation and microglial activation, occurs as early as 6 months of age. To test whether the increased levels of Aβ plaques was due to elevated Aβ, we measured Aβ and found that Aβ levels indeed were significantly increased at this age. Because β-secretase, BACE1, is critical enzyme for Aβ production, we have examined BACE1 and found that BACE1 is increased in both protein levels and enzymatic activity as early as 6 months of age; Having shown that BACE1 promoter region contains NF-κB binding sites, we found that cytoplasmic NF-κB was elevated and SUMO1 binding to IκBα was decreased. To further verify these findings, we have overexpressed TNFRII and identified that overexpressing TNFRII can reverse the findings from APP23/TNFRII−/− mice. Altogether, our results demonstrate novel roles of TNFRII in the regulation of Aβ production, suggesting a potential therapeutic strategy for AD by up-regulating TNFRII levels and elevating phosphorylated IκBα by SUMOylation.
INTRODUCTION
Pathologically, AD brains can be identified by the progressive formation of insoluble amyloid plaques that are composed of amyloid β-peptide (Aβ) fragments, which are proteolytically derived from the larger amyloid precursor protein (APP). Aβ peptide was produced by two proteolytic enzymes, β- (BACE1) and γ-secretase. APP is firstly cleaved by BACE1 at the N-terminus of the Aβ domain (1–4). This cleavage generates the soluble APPβ (sAPPβ) and C99 fragments, which undergo a second cleavage by γ-secretase (3,5–7). γ-Secretase cleavage is not precise and produces a spectrum of Aβ peptides that vary in length by a few amino acids at the carboxyl terminus (8).
Prominent activation of inflammatory processes and innate immune responses are observed in AD brain samples (9–13). Particularly, microglia are activated at the sites of amyloid deposits in the AD brain and release a wide variety of pro-inflammatory mediators which contribute to further neuronal dysfunction and even cell death (14–17). TNFα, one of pro-inflammatory cytokines, exerts its cellular effects through two distinct receptors—type I and type II of TNF receptors (TNFRI and TNFRII). The two receptor subtypes are similar in their extracellular regions because each contains four cysteine-rich repeat domains. However, they are structurally different (78% differences in amino acid sequences) in their intracellular regions, indicating possible distinct biological functions and intracellular signal transduction pathways. Recently we found (18) that TNFRI deletion decreased Aβ peptide generation by inhibiting BACE1 levels via the NF-κB pathway. Moreover, we recently found that TNFRII is deficient in AD brains (19). Whether and how TNFRII plays a role in AD pathogenesis is unknown. In this study, we knocked out TNFRII gene in transgenic APP23 mice and found that Aβ plaque number and levels dramatically increase as early as 6 months of age. We also found increases in both BACE1 protein level and enzyme activity. And the promotion of BACE1 could be reversed by overexpressing TNFRII. Interestingly, we found that the deletion of TNFRII results in the de-SUMOylation of IκBα;NF-κB complexes, which destabilizes the NF-κB complex and enhances NF-κB dissociation and translocation into nuclei.
RESULTS
Amyloid plaque formation is elevated in APP23/TNFRII−/− mice
APP23 transgenic mice with 7-fold human APP mutations overproduce Aβ, Aβ40 and Aβ42, and develop significant amyloid deposits by 14 months of age (20). To explore the possibility of TNFRII roles in Aβ plaque formation, we generated APP23/TNFRII−/− mice by crossing APP23 mice with TNFRII knockout mice (TNFRII−/−) (21). Using immunohistochemical staining, we examined the brain sections with an anti-Aβ monoclonal antibody 6E10 (3,22), and observed that, at 12 months of age (Fig. 1A–D), APP23 mice displayed numerous Aβ plaques throughout the cortex and hippocampus, which was consistent with previous reports (18,20). Interestingly, in APP23/TNFRII−/− mice, Aβ plaques were visualized as early as 6 months of age (Fig. 1A and B). However, these Aβ plaques were rarely observed in APP23 mice at this time point (Fig. 1A and B, *P < 0.01). At 9 and 12 months of age, although both APP23 and APP23/TNFRII−/− mice displayed large amounts of Aβ plaques in the cortex and hippocampus regions, a significant increase in the number of Aβ plaques were seen in APP23/TNFRII−/− brains (Fig. 1C and D, *P < 0.01) compared with age-matched APP23 mice, indicating that the genetic deletion of TNFRII gene might be the cause of early onset of Aβ plaque formation and increased number of Aβ plaque. At 3 months of age, neither APP23 nor APP23/TNFRII−/− mice displayed signs of Aβ plaque formation (data not shown).
Figure 1.
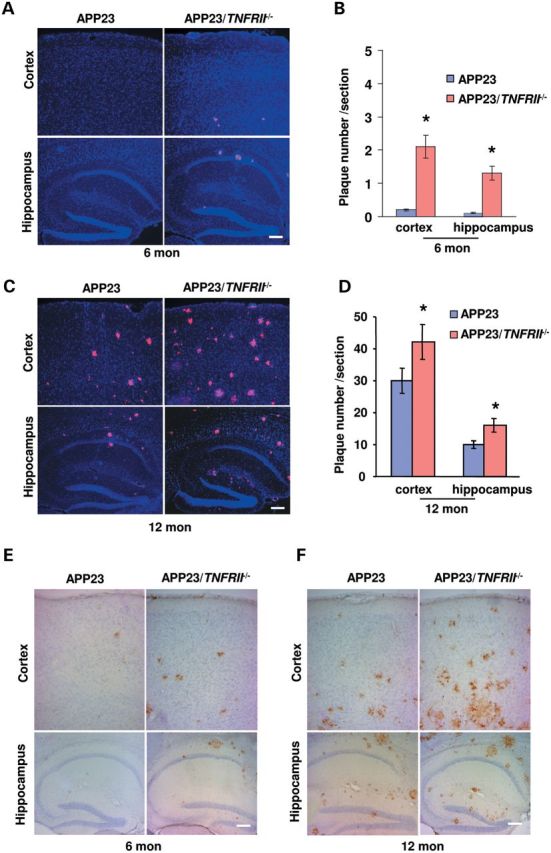
TNFRII deletion increased amyloid plaque formation early as 6 months old in APP23 mice. (A) Brain sections through the cortex and hippocampus from 6-month-old APP23 and APP23/TNFRII−/− mice were immunostained with anti-Aβ monoclonal antibody 6E10. Amyloid plaques were observed in APP23/TNFRII−/− mice in both the cortex and hippocampus while no obvious amyloid plaques in APP23 mice. (B) Stereological double blinded analysis by two independent researchers revealed increased amyloid plaques in the cortex and hippocampus in APP23/TNFRII−/− mice compared with APP23 mice. (C) Brain sections through the cortex and hippocampus from 12-month-old APP23 and APP23/TNFRII−/− mice were immunostained with anti-Aβ monoclonal antibody 6E10. Amyloid plaques in both the cortex and hippocampus were observed in both APP23 and APP23/TNFRII−/− mice, with more amyloid plaques in APP23/TNFRII−/− mice. (D) Stereological analysis revealed increased amyloid plaques in cortex and hippocampus in APP23/TNFRII−/− mice compared with APP23 mice of 12 months. Cell nuclei were counterstained with DAPI. *P < 0.01. (E) Immunostaining revealed a clear CD45 staining in 6-month-old APP23/TNFRII−/− mice while no staining was observed in age-matched APP23 mice. (F) An extensive CD45 staining in the cortex and hippocampus was observed in both APP23 and APP23/TNFRII−/− mice with much more visible staining in APP23/TNFRII−/− mice. Bars: 50 µm.
Microglia activation is increased in APP23/TNFRII−/− mice
Microglia activation is another hallmark of Aβ pathology progression (23–25). Using CD45 and CD11b, two well-characterized microglia activation markers (23–25), we observed whether there were more activated microglia in APP23 mouse brains with TNFRII−/− deletion. Without Aβ plaque formation, neither APP23 nor APP23/TNFRII−/− mice displayed any CD45 staining at 3 months of age, indicating that the activation of microglia could not be obviously observed without Aβ plaque formation. At 6 months of age, while APP23 mice exhibited light CD45 positive staining (Fig. 1E), APP23/TNFRII−/− mice had greatly increased number of CD45 positive cells in the cortex and hippocampus (Fig. 1E). At 12 months of age, both APP23 and APP23/TNRII−/− mice illustrated extensive immunoreactivity with antibodies against CD45 in the cortex and hippocampus (Fig. 1F), which was consistent with previous reports (18,26).
Aβ production is elevated in APP23/TNFRII−/− mice
To examine whether early onset of Aβ plaque formation and increased numbers of Aβ plaques in APP23/TNFRII−/− mice was due to changes of Aβ production, we measured levels of total Aβ1−x, Aβ40 and Aβ42 in APP23 and APP23/TNFRII−/− mouse brains (n = 10 for each group). Consistent with the results of the increased numbers of Aβ plaques, total Aβ1−x levels were elevated at 6 months of age in APP23/TNFRII−/− mice compared with APP23 mice (Fig. 2A,*P < 0.05, **P < 0.01). The increase tendency of total Aβ1−x levels was merged until 12 months of age in APP23 and APP23/TNFRII−/− mice (Fig. 2A, **P < 0.01). Next, we measured the levels of Aβ40 and Aβ42, two major components of Aβ peptide during aggregation, and the ratio of Aβ42/Aβ40 which was correlated with Aβ aggregation (27,28). We found a steady increase in soluble Aβ40 level from 3 to 12 months of age in APP23 mice (Fig. 2B). However, there was 46% decrease in soluble Aβ40 level in 6-month-old APP23/TNFRII−/− mice compared with age-matched APP23 mice (Fig. 2B, **P < 0.01). No significant differences of soluble Aβ40 level were found among other age groups examined (3, 9 and 12 months old). We also found a significant decrease in soluble Aβ42 levels exclusively in 6-month-old APP23/TNFRII−/− mice (Fig. 2C, **P < 0.01). To measure insoluble Aβ40 and Aβ42, as we described in the Materials and Methods, the insoluble pellets from centrifugation of brain homogenates with radioimmunoprecipitation buffer (RIPA) buffer were dissolved in formic acid and, then insoluble Aβ40 and Aβ42 protein levels were measured by enzyme-linked immunoabsorbant assay (ELISA) kits. A corresponding 2-fold increase in insoluble Aβ40 levels was observed in APP23/TNFRII−/− mice compared with APP23 mice at the age of 6-, 9- and 12-months old, except 3 months of age (Fig. 2D, *P < 0.05, **P < 0.01). Similar results were obtained for insoluble Aβ42 level, except at the group of 12 months old (Fig. 2E, *P < 0.05, **P < 0.01).
Figure 2.
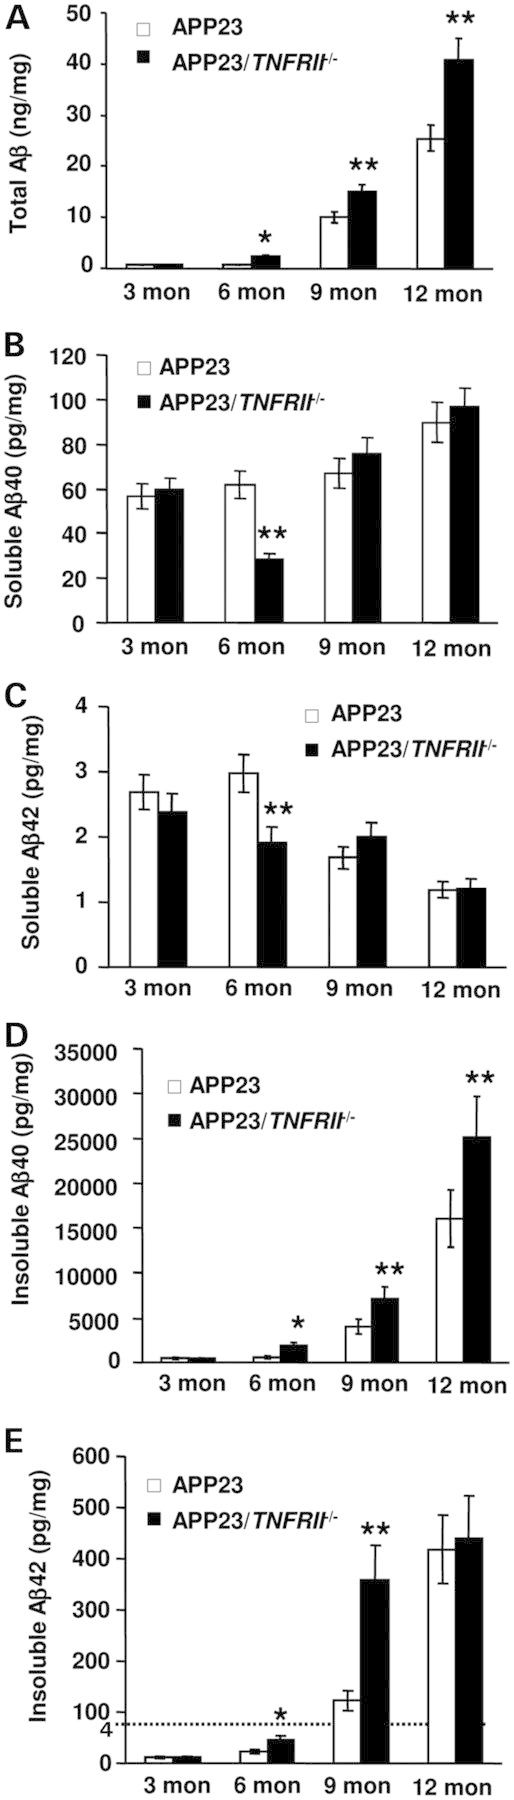
TNFRII deletion increases Aβ levels in 6-month-old APP23 mice. (A) Total Aβ1−x levels were significantly increased in APP23/TNFRII−/− mice at 6 months of age while the levels in APP23 mice remained relatively low. With aging, total Aβ1−x levels displayed a significant increase in APP23/TNFRII−/− mice compared with that in APP23 mice. (B) There was a significant reduction in soluble Aβ40 at the age of 6 months in APP23/TNFRII−/− mice when compared with APP23 mice. There was no significant difference observed in the other age groups. (C) There was a significant reduction in soluble Aβ42 in APP23/TNFRII−/− mice at 6 months of age compared with age-matched APP23 mice. There was no significant difference observed in the other age groups. (D) Insoluble Aβ40 levels were increased with aging both in APP23/TNFRII−/− mice and APP23 mice. Increased insoluble Aβ40 levels were observed in APP23/TNFRII−/− mice compared with APP23 mice at 6 months of age. The significant difference lasted until 12 months of age. (E) Insoluble Aβ42 levels were increased with aging both in APP23/TNFRII−/− mice and APP23 mice. Increased insoluble Aβ42 levels were observed in APP23/TNFRII−/− mice 6 months of age. The significant difference lasted until 9 months of age. *P < 0.05, **P < 0.01.
BACE1 levels and enzymatic activity, but neither γ-secretase nor Aβ degradation enzymes, are elevated in APP23/TNFRII−/− mice
There are three possible mechanisms that account for increased Aβ production in APP23/TNFRII−/− mice. The first is altering APP protein levels; the second is the activity changes of enzymes involved in Aβ production, such as BACE1 and γ-secretase; the third is the changes of the degradation enzymes neprilysin (NEP) and insulin degradation enzymes (IDE). We examined the expression levels of APP, BACE1, γ-secretase, NEP and IDE at different age stages in wild type (WT), APP23 and APP23/TNFRII−/− mice. Results showed similar APP levels in both APP23/TNFRII−/− and APP23 mice at all age groups (data not shown), suggesting that the difference in soluble and insoluble Aβ40 and Aβ42 levels between APP23/TNFRII−/− and APP23 mice was not due to a change in APP protein levels. The only differences observed in our western blots were the levels of BACE1. Corresponding to increased Aβ levels and amyloid plaques in APP23/TNFRII−/− mice, significant increases in BACE1 levels began as early as 6 months in APP23/TNFRII−/− mice compared with age-matched APP23 mice (Fig. 3A). Increased BACE1 levels were seen in the mice through 12 months. Combining the data, increased Aβ production might be due to the increased APP processing by an increased expression of BACE1.
Figure 3.
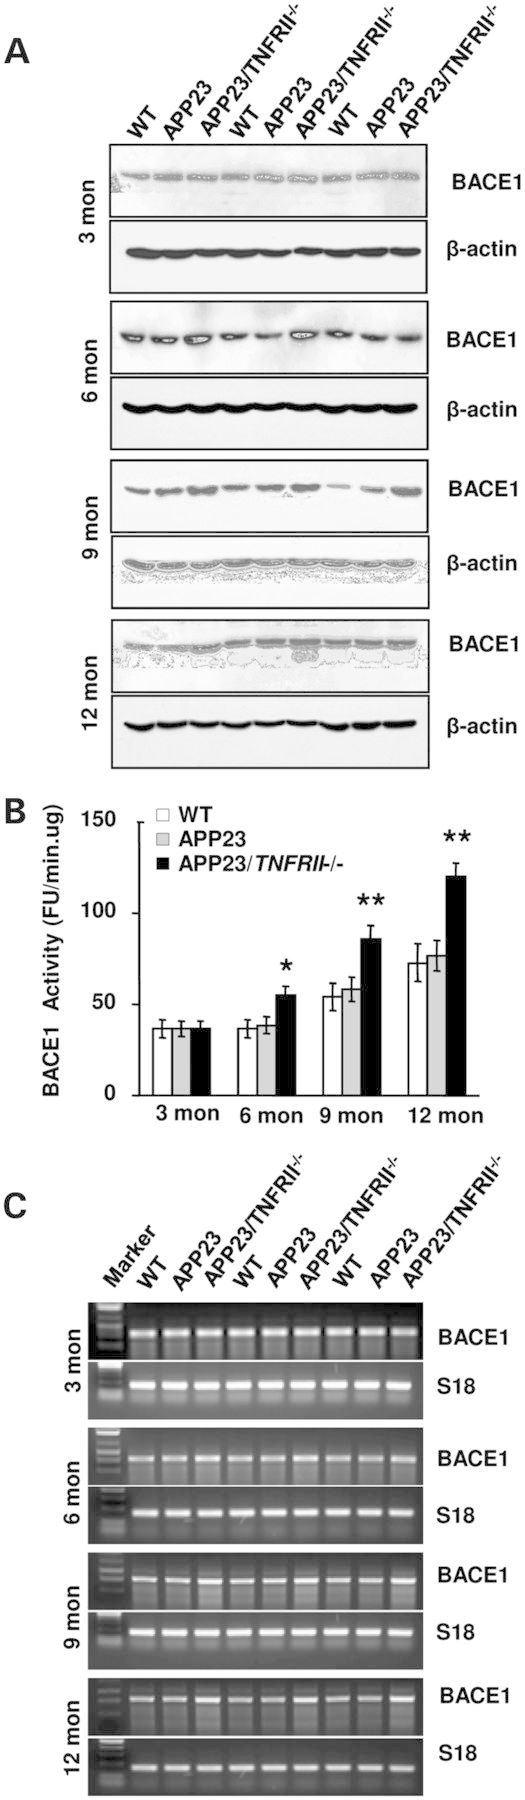
TNFRII deletion increases BACE1 levels in APP23 mice as early as 6 months of age. (A) BACE1 levels began to increase in APP23/TNFRII−/− mice at 6-, 9- and 12-months old. (B). There was no significant difference in BACE1 enzymatic activity between WT and APP23 mice. However, increased BACE1 enzymatic activity was observed at 6 months in APP23/TNFRII−/− mice compared with APP23 mice. This difference lasted until 12 months of age. (C). RT-PCR showed increased BACE1 levels in 6-, 9- and 12-months-old APP23/TNFRII−/− mice compared with APP23 mice. Mouse s18 was used as a loading control.
Next, we analyzed BACE1 enzymatic activity (18,29–31) and found an significant increase in BACE1 activity at the age of 6 months in APP23/TNFRII−/− mice when compared with APP23 mice. Similar to the results of BACE1 protein changes, enzymatic activity continued to increase through the 12th month of age in APP23/TNFRII−/− mice (Fig. 3B), indicating that TNFRII deletion not only increases BACE1 expression level but also elevates BACE1 enzymatic activity. This may be the cause of more Aβ production from increased APP processing by BACE1.
To further explore whether increased BACE1 protein levels were regulated at the transcriptional level or just at the translational level, we performed reverse transcriptase-polymerase chain reaction (RT-PCR) to measure BACE1 mRNA levels and found increased levels in 6-, 9-, and 12-month-old groups of APP23/TNFRII−/− mice compared with APP23 mice (Fig. 3C). There were no significant changes among the 3-month-old group (Fig. 3C), consistent with the results from western blots (Fig. 3A). This indicated that the genetic deletion of TNFRII increased BACE1 protein levels through enhanced transcriptional regulation.
The levels of enzyme activities for NEP and IDE were not changed at all age groups of APP23/TNFRII−/− mice compared with levels in APP23 mice (Fig. 4A–D). The results indicate that the clearance mechanism of Aβ was not related to increased Aβ levels found in APP23/TNFRII−/− mice. The catalytic subunit of γ-secretase complex, PS1, did not reveal any differences between APP23/TNFRII−/− and APP23 mice at all age groups that were studied (data not shown).
Figure 4.
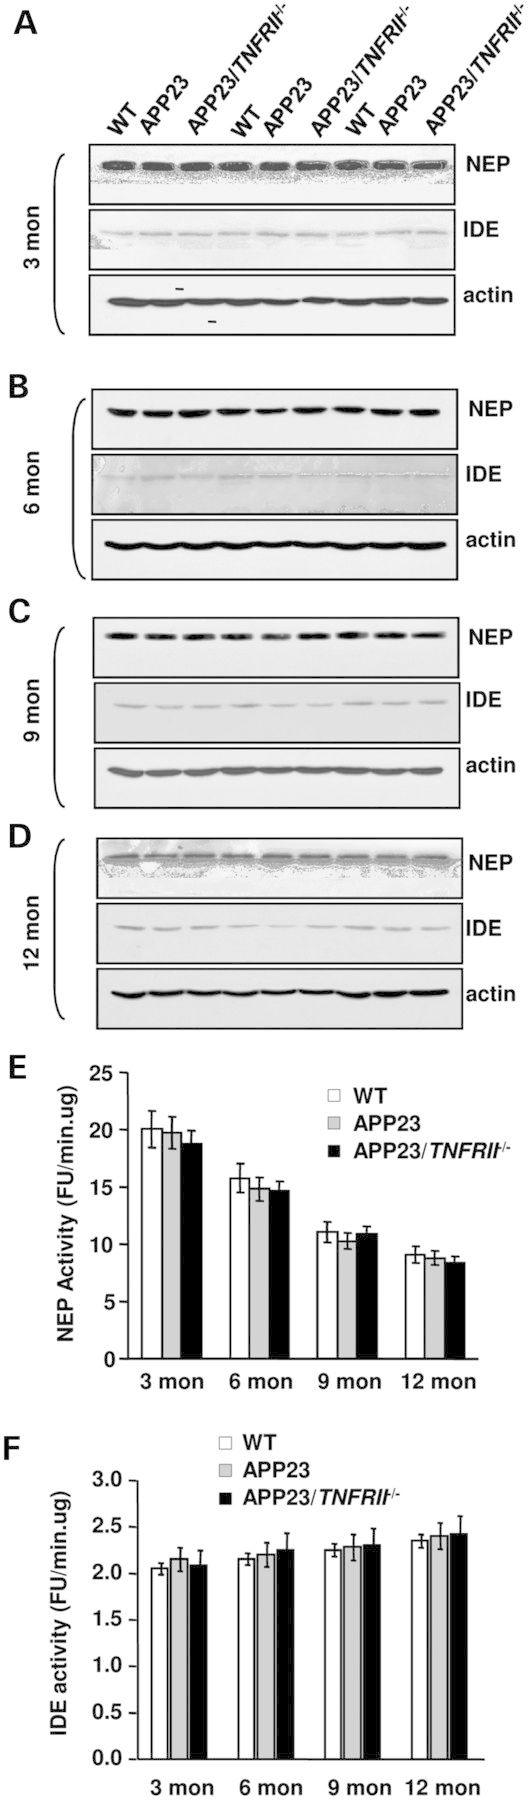
Deletion of TNFRII gene on APP23 transgenic mice has no effect on NEP or IDE protein expression levels and enzymatic activity. (A)–(D) Western blot studies show that little changes of protein expression of NEP and IDE in brains among APP23/TNFRII−/−, APP23 and WT mice at ages of 3, 6, 9 and 12 months old although protein levels of NEP and IDE decline in all of groups as age increases. Furthermore, no significant changes were observed in NEP (E) and IDE (F) enzymatic activity among APP23, APP23/TNFRII−/− and WT mice at all ages. Error bars represent standard deviation.
BACE1 transcription and expression are reduced in TNFRII overexpressed cells
To confirm the suppressive regulation of TNFRII in BACE1 regulation, we transiently transfected APP stable cells with pFlag-CMV-TNFRII and measured the levels of Aβ40 and Aβ42 in the conditioned medium. Interestingly, we found a decreased level of Aβ40 and Aβ42 peptides in the TNFRII overexpressed cells (Fig. 5A and B). We also detected the protein levels involved in Aβ production. Similar to the results obtained from our TNFRII knockout mice; we found that neither γ-secretase subunit PS1 nor Aβ clearance enzymes NEP and IDE changed (Fig. 5H). Expectedly, we found a decreased BACE1 level in TNFRII overexpressed cells (Fig. 5C), along with a significant decrease in BACE1 enzymatic activity (Fig. 5D, *P < 0.01), when compared with the controls. To validate the effect of TNFRII on BACE1, the levels of sAPPβ in the conditioned medium were detected. We found a decreased sAPPβ level in TNFRII transfected cells (Fig. 5E). We also measured the mRNA level of BACE1 and found that, in agreement with our results obtained from western blots (Fig. 5E), BACE1 mRNA levels decreased accordingly after TNFRII overexpression (Fig. 5F).
Figure 5.
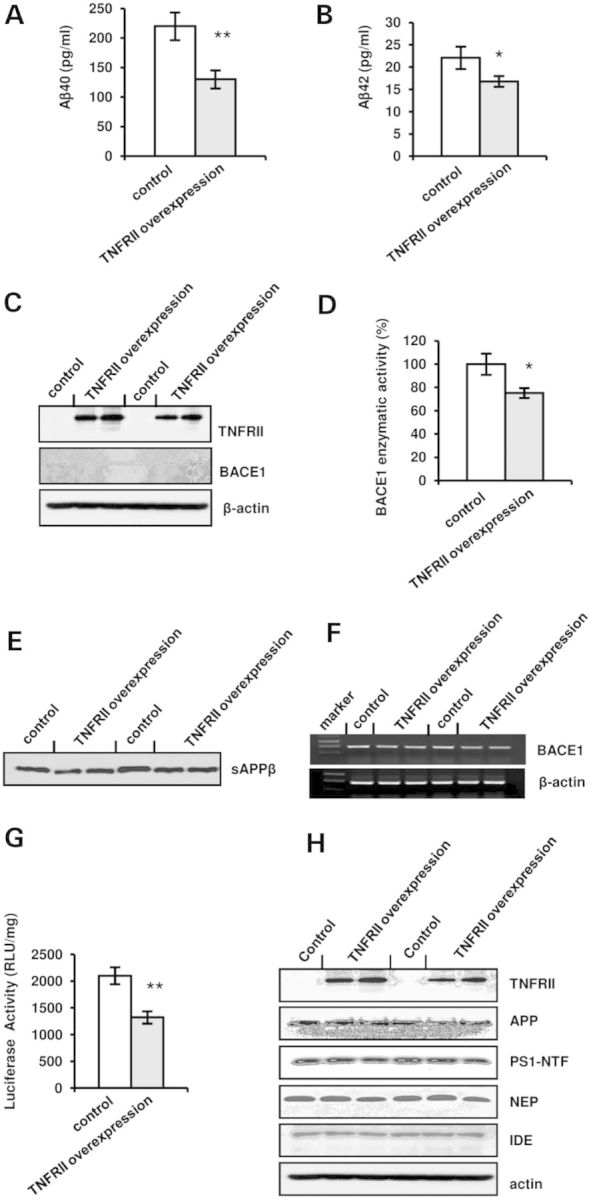
TNFRII overexpression reduces Aβ40 and Aβ42 levels. (A) Aβ40 levels in the culture medium reduced after overexpression of TNFRII in APP stable cell line. (B) Aβ42 levels in the culture medium decreased with overexpression of TNFRII in APP stable cell line. (C) BACE1 level significantly decreased in TNFRII overexpressed cells. (D) BACE1 enzymatic activity decreased in TNFRII overexpressed cells. (E) sAPPβ levels in the culture medium reduced after overexpression of TNFRII in APP stable cell line. (F) BACE1 mRNA levels decreased in TNFRII overexpressed cells. (G) Luciferase activity assay showed a decreased BACE1 promoter activity with TNFRII overexpression. Data were presented as an arbitrary unit to β-galactosidase enzyme and shown as mean ± SEM.
To further confirm TNFRII role in the transcriptional regulation of BACE1, we transfected HEK293T cells with a pBIP-A vector containing a BACE1 promoter (−1941 to +292) that was upstream of a luciferase reporter gene (32,33) together with pFlag-CMV-TNFRII. Expectedly, we found a significant decrease in BACE1 promoter activity in TNFRII overexpressed cells (Fig. 5G, *P < 0.01), indicating that TNFRII affects BACE1 promoter and inhibits its transcription.
Genetic deletion of TNFRII results in elevation of NF-κB nuclear translocation via decrease of SUMOylation
A line of evidences showed that NF-κB was involved in TNFRII-mediated signal transduction pathway (34–36), and was bound to BACE1 promoter-specific NF-κB site (37). To explore the subcellular distribution of NF-κB, we immunostained with an antibody against the p65 subunit of NF-κB, and results showed an increased expression level of NF-κB in the nuclei of TNFRII−/− brains (Fig. 6A). In non-stimulated cells, NF-κB is sequestered by IκBs in cytoplasm; stimulation of various inducers cause IκB phosphorylation and subsequent degradation, liberating NF-κB and transporting into nuclei (18). One possible explanation is that increased nuclear NF-κB levels is due to an increase in NF-κB release from complex IκBα;NF-κB. Small ubiquitin-related modifier (SUMO) is the ubiquitin-like protein family (38–41). The covalent attachment of SUMOs (SUMOylation) to target proteins is analogous to ubiquitination. IκBα SUMOylation may stabilize IκBα;NF-κB complex and decrease NF-κB release through preventing ubiquitination by E2 (42–44). We double stained brain sections of TNFRII−/− mice with antibodies against p-IκB and SUMO1. Results showed decreased p-IκB levels and decreased co-localization of SUMO1 and p-IκBα (Fig. 6B). We further examined the SUMO1 expression by western blot and found no significant level changes between the controls and TNFRII−/− brains, suggesting that TNFRII deletion reduces SUMO1 binding to IκB protein but not elevates SUMO1 level. However, when we tested another member of SUMOs, SUMO-4 (43,44), a significant decrease in SUMO-4 level was observed in TNFRII−/− brains (Fig. 6C). Together, our results suggest TNFRII is correlated with the SUMO changes of binding capacity to IκB. Whether the SUMOylation affects IκBα expression and its phosphorylation is still unknown. We tested the expression levels by western blot, and slight but insignificant increases in IκBα and IKKα were present, along with a significant decrease in p-IκBα (Fig. 6C).
Figure 6.
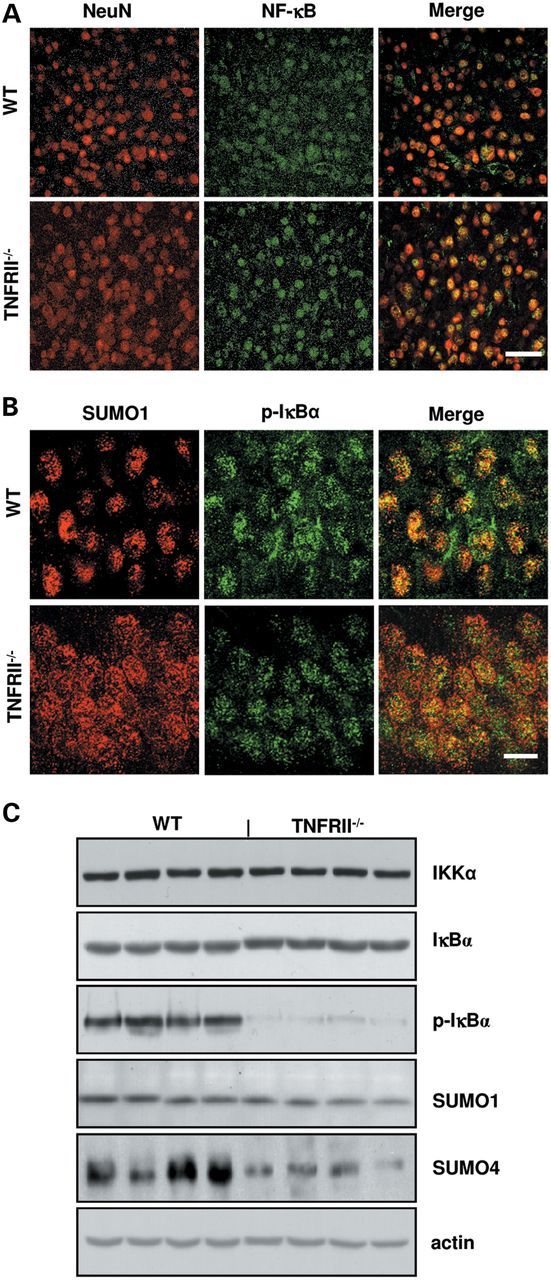
TNFRII deletion results in increase of nuclear NF-κB translocation and reduction of phosphorylated IκBα (p-IκBα) and SUMO4. (A) Immunostaining showed an increase in NF-κB levels in neuron nucleus (NeuN: red color; NF-κB: green color) in the cortex of TNFRII−/− brains. (B) Representative images revealed that a decreased co-localization of p-IκBα (green color) with SUMO1 (red color) is observed in TNFRII−/− brains. (C) Western blot showed a slight increase in IκBα levels, no significant differences of IKKα and SUMO1 levels, and a significant decrease in p-IκBα and SUMO4 levels in TNFRII−/− brains. Bars: 20 µm.
Overexpression of TNFRII prevents NF-κB nuclear translocation by increase of SUMOylation
To further confirm the changes of NF-κB and SUMOs observed in TNFRII−/− brains, we overexpressed TNFRII and found a decreased expression level of NF-κB in nuclear extraction (Fig. 7A). Accordingly, an increased NF-κB level was observed in cytoplasm (Fig. 7B). The finding was also demonstrated by immunohistostaining (Fig. 7C). Meanwhile, we observed a significant increase in p-IκBα protein levels, but no significant change in non-phosphorylated IκBα (Fig. 7B); these results were further confirmed by immunocytochemistry with antibodies against SUMO1 and p-IκBα (Fig. 7D). One possible explanation of why the NF-κB and p-IκBα levels increased in cytoplasm is that SUMO1 keeps complex IκBα;NF-κB stability. Images showed increased co-localization of SUMO1 and p-IκBα in TNFRII overexpressed cells (Fig. 7D). The results suggest that TNFRII-induced SUMOylation plays a role in the decreased release of NF-κB from complex IκBα;NF-κB.
Figure 7.
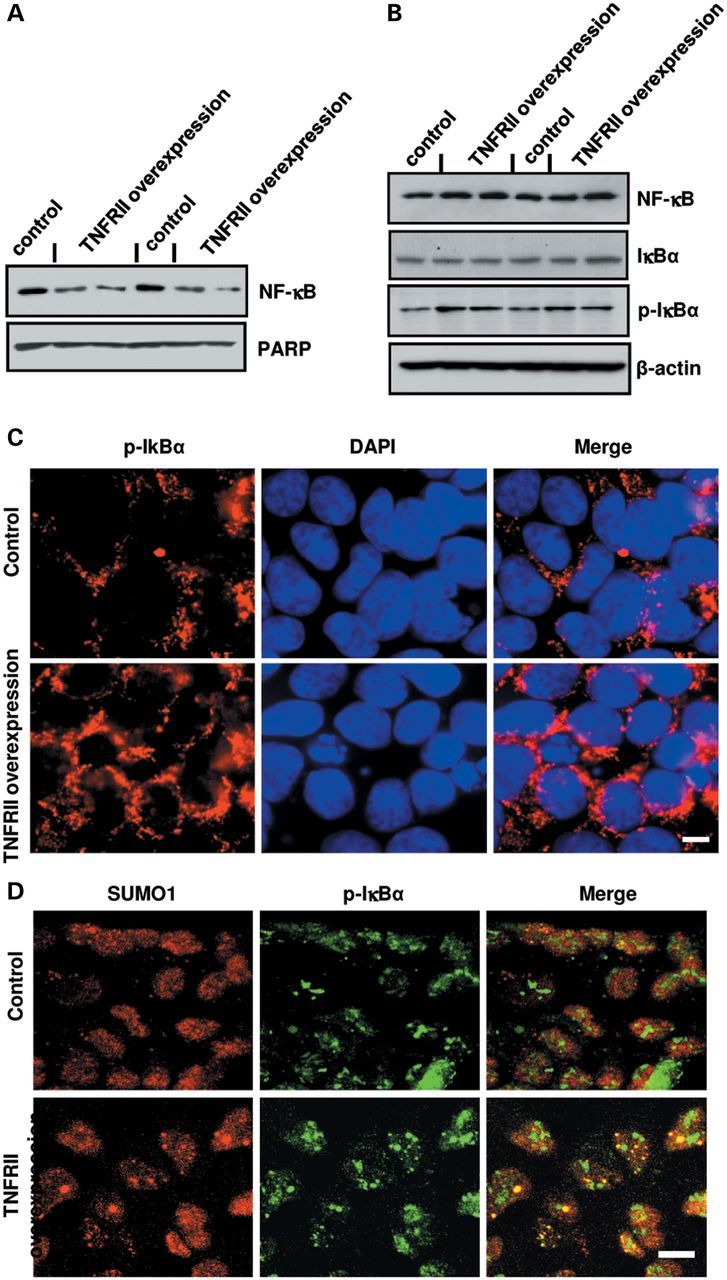
TNFRII overexpression decreases nuclear NF-κB translocation by decreasing SUMO1 binding to IκBα. (A) Changes of intranuclear NF-κB levels using western blot in TNFRII transfected cells. PARP was used as a loading control for the nuclear fraction. (B) Changes in the cytosolic levels of NF-κB, IκBα and p-IκBα levels using western blots in TNFRII overexpressed cells. β-actin was used as a loading control for the cytoplasmic fraction. (C) Immunofluorescent images of changes in phosphorylated IκBα (p-IκBα) in TNFRII overexpressed cells. (D) Changes in co-localization of p-IκBα and SUMO1 in TNFRII transfected cells using immunofluorescent staining. Cell nuclei were counterstained with DAPI. Bars in C and D: 10 µm.
DISCUSSION
We observed that genetically deleting TNFRII in APP23 mice resulted in premature and more amyloid plaques due to the up-regulation of BACE1 protein levels and activities. In contrast, TNFRII overexpression inhibited BACE1 transcription by limiting NF-κB nuclear translocation. TNFRII inhibition of NF-κB release is due to enhancing SOMOylation of IκB;NF-κB complex. These findings provide evidence that TNFRII plays a beneficial role in AD, and without it, early onset of amyloid plaques would occur.
NF-κB belongs to a family of ubiquitously expressed Rel-related transcription factors and is activated by the proteolytic degradation of inhibitors from NF-κB (IκBs) in the cytoplasm. Once activated, NF-κB is translocated to the nuclei and exerts its function on gene transcription. BACE1 promoter contains a number of putative transcription factor binding sites, including Sp1, NF-κB, YY1, MZF1, HNF-3β and four GATA sites, and is highly conserved between rats, mice and humans (3,6,33). A detailed analysis using BACE1 promoter constructs carrying NF-κB site mutations revealed a unique cell type-specific regulation of BACE1 promoter activity (6). We found that NF-κB has a bilateral role in the regulation of BACE1 promoter activity in different cell types. In neuroblastoma cells, such as SH-SY5Y cells or PC12 cells, NF-κB acts as a suppressor under basal conditions. In the situation of exposing soluble Aβ peptides to neurons or activation of glial cells by TNF-α, however, NF-κB acts as an activator on BACE1 expression (37). In the present study, we found that NF-κB played an activating role in BACE1 promoter in APP23 mice, consistent with our previous results (18).
Overall, inflammatory changes are observed in AD brains, particularly around amyloid deposits, which are rich in activated microglia. Immunocytokine TNFα is a central mediator of inflammation, immune response and antiviral defense (45,46). TNFα binds and signals through two distinct receptors, TNFRI and TNFRII, and are capable of activating NF-κB through different mechanisms (34–36). Our previous study illustrated that TNFRI signaling could directly regulate BACE1 transcription through NF-κB pathway (18). Here, we suggested that TNFRII could also directly regulate BACE1 transcription through NF-κB pathway. However, the regulations of TNFRI and TNFRII on the activation of NF-κB were quite different. It has been suggested that TNFRI is capable of activating NF-κB through its Fas-associated death domain protein (FADD) /TNFR1-associated death domain protein (TRADD) interaction (34). However, the exact signal transduction pathway in the TNFRII-mediated activation of NF-κB is still unclear. It is possible that RIP, NIK, JNK and other molecules might be involved in TNFRII-NF-κB pathway (34). The ability of TNFRI to activate NF-κB appears to account for majority of TNFα-stimulated NF-κB activation, while TNFRII-stimulation accounts for ∼10% of the achievable TNFR-stimulated NF-κB activity (34). It suggests that TNFRII is not only a ligand passing protein, but it is also actively involved in NF-κB activation. There has been reported that TNFRII could lead to the activation of NF-κB even in the absence of the ligand (47,48).
Here, we found that, however, in TNFRII deletion brains, NF-κB levels are not decreased but increased, conversely, which resulted from IκB;NF-κB SUMOylation. Ubiquitin and the individual SUMO family members are all targeted to different proteins with diverse biological functions. Ubiquitin predominantly regulates degradation of its target proteins (41). SUMO1 is an ubiquitin-like protein, which binds to a wide range of target proteins. SUMO1 is conjugated IκBα to regulate nuclear trafficking and protein stability (42). SUMO-1-modified IκBα cannot be ubiquitinated and function as an antagonist of ubiquitin in the proteasome-mediated degradation process. As a result, overexpression of SUMO-1 inhibits signal-induced activation of NF-κB-dependent transcription (42). In the present study, we discovered that TNFRII was able to reduce NF-κB release by SUMOylation of IκBα;NFκB complex. SUMO4 is another member of the SUMO gene family. It is located in the cytoplasm and specifically modifies IκBα, leading to negative regulation of NF-κB-dependent gene transcription (43,44). SUMO4 expression in TNFRII−/− brains is much lower than in WT controls, also suggesting TNFRII role in stabilizing NF-κB in cytoplasm. Our observation in TNFRII deletion or overexpression suggested that one of the physiological functions of TNRFII is primarily the maintenance of IκBα;NF-κB stability. It may be partly explained that even if TNFRII is stimulated, due to prevention from NF-κB release, the NF-κB activation response is at a lower level (∼10% compared with TNFR1-stimulation) (34). It also suggest that the activation of NF-κB may be elevated to a limited level in spite of the activation of TNFRII-NF-κB pathway.
Collectively, genetic deletion of TNFRII resulted in NF-κB accumulation in the nuclei due to a decrease in the binding of SUMOs to IκB;NF-κB, which elevated BACE1 transcription and led to an increase in BACE1 expression as well as BACE1 enzymatic activity. Accordingly, it increased cleavage of APP by BACE1, ultimately, led to the increased Aβ production and amyloid plaque formation as confirmed in our experiment (Fig. 8). Moreover, inflammation in AD is considered as ‘secondary response’. Our present study demonstrates that conventionally genetic deletion of TNFRII enhances AD-like pathology. This suggests that inflammatory changes in the very early stage, even in the developmental period, may affect the brain function, i.e. such as synapse elimination, neuron–glial communication as well as neural circuits. This may be also considered as ‘primary’ or ‘environmental impact to the brain’, which then influences APP or even tau cascade.
Figure 8.

Model for the mechanism of genetic deletion of TNFRII-induced activation of BACE1 enzyme by IκBα phosphorylation, resulting in AD-like pathology. (A) Activation of TNFRI and TNFRII on the BACE1 expression in normal cells. Both TNFRI and TNFRII are able to activate IKK through different pathways. With its phosphorylation, it can then phosphorylate IκBα, liberating NF-κB and resulting in its translocation to the nuclear. Within the nuclear, NF-κB could act on either BACE1 promoter or IκBα gene which all contain NF-κB binding sites. This leads to the BACE1 and IκBα gene transcription and increased levels of BACE1 activity and IκBα in the cells. IκBα acts as an autoregulatory loop to transport NF-κB out of the nuclear. (B) Condition under genetic deletion of TNFRII. With the genetic deletion of TNFRII, the pathway mediated by TNFRII is blocked, which in turn causes the reduced transcriptional regulation of IκBα gene. With the reduced cellular IκBα levels, NF-κB will accumulate in the nuclear. This will lead to the persistent activation on BACE1 gene and enhanced BACE1 expression.
MATERIALS AND METHODS
Generation of APP transgenic mice with deletion of TNFRII
TNFRII knockout (TNFRII−/−) mice were of C57BL/6 background, constructed as previously reported (49). APP23 transgenic mice with human APP (751 isoform) cDNA harboring the Swedish double mutation (KM670/671NL) developed senile plaques in the cerebral cortex and hippocampus, along with neuronal loss at 18 months of age that was most evident in the hippocampal CA1 region (20). APP23 and TNFRII−/− mice were crossed and APP23+/TNFRII+/− progeny were backcrossed with TNFRII−/− mice to generate APP23+TNFRII−/− mice; such mice were further backcrossed to TNFRII−/− for six generations. The resulting APP23+TNFRII−/− mice were used in the experiments. To keep the APP gene heterozygous, APP23 mice were continually crossed with C57BL/6 WT mice; the resulting mice were genotyped and APP positive mice were used in the experiments.
Immunohistochemistry
As previously described (18,50), paraformaldehyde-fixed brains were sectioned at 30 μm and incubated with 6E10 (Chemicon), CD45 and CD11b (Serotec). Immuno-double staining were performed with anti-NF-κB polyclonal antibody (Santa Cruz Biotech), anti-p-IκBα monoclonal antibody (Cell Signal), SUMO1 polyclonal antibody (Abcam), and counter staining with 4′,6-diamidino-2-phenylindole (DAPI) (Santa Cruz Biotech).
Enzyme-linked immunoabsorbant assay
APP23 and APP23/TNFRII−/− mice at 3, 6, 9 and 12 months of age were sacrificed, and half of the brain was homogenized in a homogenization buffer [250 mm sucrose, 20 mm Tris–HCl pH 7.4, 1 mm ethylenediaminetetraacetic acid (EDTA), 1 mm ethylene glycol tetraacetic acid (EGTA)]. For soluble and insoluble Aβ fractions, mouse brains were homogenized in 1×RIPA buffer by a Dounce homogenizer; the supernatant resulting from 14 000 rpm centrifugation for 30 min was the soluble fraction. The insoluble pellet was dissolved in formic acid and neutralized by neutralization buffer (3 m Tris Base). Sample protein concentration was quantitated by protein assay kit (Bio-rad).
For total Aβ1−x ELISA, monoclonal 4G8 (Chemicon) was used as capture antibody and biotinylated 6E10 (Serotec) was used as detection antibody (3). Both Aβ40 and Aβ42 were measured by an Aβ40 and Aβ42 ELISA kit from Biosource following the manufacturer's instructions.
Western blots
Fifty micrograms of total proteins were separated on sodium dodecyl sulphate-polyacrylamide gel electrophoresis gel and transferred to PVDF membrane. The blots were probed with following antibodies: anti-6E10 monoclonal antibody (R&D system); anti-BACE monoclonal antibody (R&D system); anti-PS1 N-terminus polyclonal antibody (gift from Dr Sangram Sisodia, University of Chicago); anti-NEP monoclonal antibody (R&D system), anti-IDE polyclonal antibody (Oncogene); anti-NF-κB p65 polyclonal antibody, anti-IκBα polyclonal antibody (Abcam) and anti-PARP polyclonal antibody (Santa Cruz Biotech); anti-p-IκBα (S32 and S36) monoclonal antibody (Abcam), anti-SUMO1 (Abcam), anti-SUMO4 monoclonal antibody (Sigma) and anti-β-actin monoclonal antibody (Sigma).
BACE1 activity assay
An aliquot of brain homogenates from APP23, APP23/TNFRII−/− and WT mice was further lysed with a lysis buffer (10 mm Tris–HCl [pH 7.4], 150 mm NaCl, 1 mm EDTA, 1 mm EGTA, 1 mm Na3VO4, 10% Glycerol, 0.5% Triton X-100). BACE1 substrate (Biosource) was dissolved in DMSO and mixed with reaction buffer (50 mm HAc, 100 mm NaCl; pH 4.1). An equal amount of protein was mixed with 100 µl of substrate, and fluorescence intensity was measured with a microplate reader at an excitation wavelength of 320 nm and an emission wavelength of 390 nm.
Cloning and transfection
Human TNFRII was amplified by RT-PCR and then subcloned to pFlag-CMV vector (Sigma). We used 293 cells stably transfected with human APP695 (gift from Dr Dennis Selkoe from Bragham & Women's Hospital, Harvard University) that were maintained in Dulbecco's modified Eagle's medium with 10% fetal bovine serum. APP695 stable cells were transfected with TNFRII expression vector by Effectene (Qiagen) according to the manufacturer's instructions. Forty-eight hours after transfection, the conditional medium and cells were collected for Aβ ELISA, western blots and BACE1 activity assay as described above. The pCMX-IκBα M plasmid was a gift from Dr Verman (Salk Institute for Biological Studies). It was co-transfected into APP695 stable cells with pFlag-CMV-TNFRII as described above.
RT-PCR
Total RNA was extracted from pFlag-CMV-TNFRII transfected APP695 stable cells by RNeasy mini kit from Qiagen. A one-step RT-PCR kit used was from Invitrogen for BACE1 detection. For human BACE1 RT-PCR (475 bp), reverse primer 5′-CGT GGA TGA CTG TGA GAT GG and forward primer 5′-AGG GAG CAT GAT CAT TGG AG were used to amplify regions 696–1170 from BACE1 mRNA. For β-actin RT-PCR (462 bp), forward primer 5′-GGA CTT CGA GCA AGA GAT GG and reverse primer 5′ GAA GCA TTT GCG GTG GAG were used to amplify β-actin mRNA coding region from 633 to 1125. For mouse BACE1 PT-PCR (530 bp), forward primer 5′-CAG TGG AAG GTC CGT TTG TT and reverse primer 5′-CTA AAG GAT GCT GGG CAG AG were used to amplify BACE1 mRNA coding region from 1734 to 2263. Mouse s18 was used as a loading control; forward primer, 5′-CAG AAG GAC GTG AAG GAT GG and reverse primer, 5′-CAG TGG TCT TGG TGT GCT GA were used. The amplified mouse S18 fragment was 159 bp. Total RNA was extracted from the brains of WT, APP23 and APP23/TNFRII−/− mice at 3, 6, 9 and 12 months (n = 5 for each group) using an RNA mini column kit (Invitrogen). Real time PCR was performed at 51°C for 30 min for cDNA synthesis then 94°C for 30 s, 50°C for 30 s, 68°C for 1 min, for a total of 35 cycles.
Cell transfection and luciferase assay
We transfected 293T cells with pFlag-CMV-TNFRII and pB1P-A vector containing a BACE1 promoter (−1941 to +292) upstream from a luciferase reporter gene (32) using Effectene (Qiagen). Cells were collected 48 h after transfection, and a luciferase assay (Promega) was performed following the manufacturer's instructions. As an internal control, PCH110 containing β-galactosidase enzyme was used. Luminescence intensity was measured with a microplate reader, normalized to the value of β-galactosidase enzyme, and plotted as an arbitrary unit to β-galactosidase enzyme.
Nuclear extraction
Nuclear fraction was extracted from APP695 stable cells transfected with pFlag-CMV-TNFRII using a nuclear extraction kit (Imgenex Corporation). Nuclear and cytoplasmic fractions were collected for the western blots of NF-κB, IκBα and p-IκBα. Poly (ADP-ribose) polymerase (PARP) was used as a loading control for nuclear fraction and β-actin was loading control for cytoplasmic fraction.
Quantitation of immunoreactive structures
Serial sagittal sections (30 µm) through the entire rostrocaudal extent of the hippocampus were cut with a cryostat. Every 10th section was immunostained with an anti-6E10 antibody. On all sections containing the hippocampus, we delineated the pyramidal cell layer CA1. The total number of Aβ-immunoreactive plaques was obtained using unbiased stereology (51,52) and a Leica microscope (Leica, Germany) equipped with a DEI-470 digital camera (Optronics, Goleta, CA). For each section, we delineated a 400 µm2 area in the CA1 and cortex, and then counted all Aβ-immunoreactive plaques within that 400 µm2 box. The average number of Aβ-immunoreactive plaques was calculated per animal (n = 10). We also measured the diameter of each counted plaque, and used the same method to count activated microglial cells (stained with CD45) in the hippocampus and cortex in a double blind manner. Differences between groups were tested with Image-pro Plus Analysis (MediaCybernetics, Silver Spring, MD).
Statistical analyses
Each experiment was performed independently at least three times, and the results were presented as mean ± standard error of mean (SEM). One-way analysis of variance (ANOVA) and Student–Newman–Keuls test, or t-test, was used to compare the differences between the means. A level of P < 0.05 was considered to be statistically significant.
AUTHORS’ CONTRIBUTIONS
H.J., P.H. performed biochemical and immunohistochemical experiments, participated in data analyses and wrote the manuscript draft. J.X. made valuable and critical suggestions and comments in physiology. M.S. provided APP23 transgenic mice through collaboration. Y.S. and R.L. initiated the project and designed the experiments, and participated in data analyses and overviewed manuscript drafting and finalized final version of the paper. All authors have read and approved the final manuscript.
FUNDING
This work was supported by National Institute on Aging (NIA)RO1 (852888,032441), Arizona Biomedical Research Commission (ABRC)002, Alzheimer Association (IIRG-09-61521 and IIRG-0759510), American Health Assistance Foundation (AFAH) (G2006-118), 973 program in China (2011CB504102, 2012CB526703), the National Foundation of Natural Science of China (81171207) and Program for New Century Excellent Talents in University in China.
ACKNOWLEDGEMENTS
We thank Dr Dennis Selkoe (Brigham Women's Hospital, Harvard Medical School) for APP transfected cells, Dr Gang Yu (University of Texas Southwest) for APH1 and Dr Samgram Sisodia (University of Chicago) for PS-1 antibody, Dr Kumar Sambamurti (Medical University of South Carolina) and Dr Weihong Song (University of British Columbia) for providing BACE1 short and long promoters.
Conflict of Interest statement. None declared.
REFERENCES
- 1.Sinha S., Anderson J.P., Barbour R., Basi G.S., Caccavello R., Davis D., Doan M., Dovey H.F., Frigon N., Hong J., et al. Purification and cloning of amyloid precursor protein beta-secretase from human brain. Nature. 1999;402:537–540. doi: 10.1038/990114. [DOI] [PubMed] [Google Scholar]
- 2.Sinha S., Lieberburg I. Cellular mechanisms of beta-amyloid production and secretion. Proc. Natl. Acad. Sci. USA. 1999;96:11049–11053. doi: 10.1073/pnas.96.20.11049. [DOI] [PMC free article] [PubMed] [Google Scholar]
- 3.Vassar R., Bennett B.D., Babu-Khan S., Kahn S., Mendiaz E.A., Denis P., Teplow D.B., Ross S., Amarante P., Loeloff R., et al. Beta-secretase cleavage of Alzheimer’s amyloid precursor protein by the transmembrane aspartic protease BACE. Science. 1999;286:735–741. doi: 10.1126/science.286.5440.735. [DOI] [PubMed] [Google Scholar]
- 4.Yan R., Bienkowski M.J., Shuck M.E., Miao H., Tory M.C., Pauley A.M., Brashier J.R., Stratman N.C., Mathews W.R., Buhl A.E., et al. Membrane-anchored aspartyl protease with Alzheimer’s disease beta-secretase activity. Nature. 1999;402:533–537. doi: 10.1038/990107. [DOI] [PubMed] [Google Scholar]
- 5.Cai H., Wang Y., McCarthy D., Wen H., Borchelt D.R., Price D.L., Wong P.C. BACE1 is the major beta-secretase for generation of Abeta peptides by neurons. Nat. Neurosci. 2001;4:233–234. doi: 10.1038/85064. [DOI] [PubMed] [Google Scholar]
- 6.Rossner S., Sastre M., Bourne K., Lichtenthaler S.F. Transcriptional and translational regulation of BACE1 expression—implications for Alzheimer’s disease. Prog. Neurobiol. 2006;79:95–111. doi: 10.1016/j.pneurobio.2006.06.001. [DOI] [PubMed] [Google Scholar]
- 7.Vassar R. BACE1: the beta-secretase enzyme in Alzheimer’s disease. J. Mol. Neurosci. 2004;23:105–114. doi: 10.1385/JMN:23:1-2:105. [DOI] [PubMed] [Google Scholar]
- 8.Xia W., Zhang J., Ostaszewski B.L., Kimberly W.T., Seubert P., Koo E.H., Shen J., Selkoe D.J. Presenilin 1 regulates the processing of beta-amyloid precursor protein C-terminal fragments and the generation of amyloid beta-protein in endoplasmic reticulum and Golgi. Biochemistry. 1998;37:16465–16471. doi: 10.1021/bi9816195. [DOI] [PubMed] [Google Scholar]
- 9.Akiyama H., Barger S., Barnum S., Bradt B., Bauer J., Cole G.M., Cooper N.R., Eikelenboom P., Emmerling M., Fiebich B.L., et al. Inflammation and Alzheimer’s disease. Neurobiol. Aging. 2000;21:383–421. doi: 10.1016/s0197-4580(00)00124-x. [DOI] [PMC free article] [PubMed] [Google Scholar]
- 10.Shen Y., Meri S. Yin and Yang: complement activation and regulation in Alzheimer’s disease. Prog. Neurobiol. 2003;70:463–472. doi: 10.1016/j.pneurobio.2003.08.001. [DOI] [PubMed] [Google Scholar]
- 11.Shen Y., Sullivan T., Lee C.M., Meri S., Shiosaki K., Lin C.W. Induced expression of neuronal membrane attack complex and cell death by Alzheimer’s beta-amyloid peptide. Brain. Res. 1998;796:187–197. doi: 10.1016/s0006-8993(98)00346-1. [DOI] [PubMed] [Google Scholar]
- 12.Wyss-Coray T., Mucke L. Inflammation in neurodegenerative disease—a double-edged sword. Neuron. 2002;35:419–432. doi: 10.1016/s0896-6273(02)00794-8. [DOI] [PubMed] [Google Scholar]
- 13.Yang L.B., Li R., Meri S., Rogers J., Shen Y. Deficiency of complement defense protein CD59 may contribute to neurodegeneration in Alzheimer’s disease. J. Neurosci. 2000;20:7505–7509. doi: 10.1523/JNEUROSCI.20-20-07505.2000. [DOI] [PMC free article] [PubMed] [Google Scholar]
- 14.Heneka M.T., O'Banion M.K. Inflammatory processes in Alzheimer’s disease. J. Neuroimmunol. 2007;184:69–91. doi: 10.1016/j.jneuroim.2006.11.017. [DOI] [PubMed] [Google Scholar]
- 15.McAlpine F.E., Lee J.K., Harms A.S., Ruhn K.A., Blurton-Jones M., Hong J., Das P., Golde T.E., LaFerla F.M., Oddo S., Blesch A., Tansey M.G. Inhibition of soluble TNF signaling in a mouse model of Alzheimer’s disease prevents pre-plaque amyloid-associated neuropathology. Neurobiol. Dis. 2009;34:163–177. doi: 10.1016/j.nbd.2009.01.006. [DOI] [PMC free article] [PubMed] [Google Scholar]
- 16.Tan Z.S., Beiser A.S., Vasan R.S., Roubenoff R., Dinarello C.A., Harris T.B., Benjamin E.J., Au R., Kiel D.P., Wolf P.A., Seshadri S. Inflammatory markers and the risk of Alzheimer disease: the Framingham Study. Neurology. 2007;68:1902–1908. doi: 10.1212/01.wnl.0000263217.36439.da. [DOI] [PubMed] [Google Scholar]
- 17.Tripathy D., Thirumangalakudi L., Grammas P. Expression of macrophage inflammatory protein 1-alpha is elevated in Alzheimer’s vessels and is regulated by oxidative stress. J. Alzheimers. Dis. 2007;11:447–455. doi: 10.3233/jad-2007-11405. [DOI] [PubMed] [Google Scholar]
- 18.He P., Zhong Z., Lindholm K., Berning L., Lee W., Lemere C., Staufenbiel M., Li R., Shen Y. Deletion of tumor necrosis factor death receptor inhibits amyloid {beta} generation and prevents learning and memory deficits in Alzheimer’s mice. J. Cell Biol. 2007;178:829–841. doi: 10.1083/jcb.200705042. [DOI] [PMC free article] [PubMed] [Google Scholar]
- 19.Cheng X., Yang L., He P., Li R., Shen Y. Differential activation of tumor necrosis factor receptors distinguishes between brains from Alzheimer’s disease and non-demented patients. J. Alzheimers Dis. 2010;19:621–630. doi: 10.3233/JAD-2010-1253. [DOI] [PMC free article] [PubMed] [Google Scholar]
- 20.Sommer B., Staufenbiel M. A beta peptide deposition in the brains of transgenic mice: evidence for a key event in Alzheimer’s disease pathogenesis. Mol. Psychiatry. 1998;3 doi: 10.1038/sj.mp.4000397. 284–286, 282–283. [DOI] [PubMed] [Google Scholar]
- 21.Peschon J.J., Torrance D.S., Stocking K.L., Glaccum M.B., Otten C., Willis C.R., Charrier K., Morrissey P.J., Ware C.B., Mohler K.M. TNF receptor-deficient mice reveal divergent roles for p55 and p75 in several models of inflammation. J. Immunol. 1998;160:943–952. [PubMed] [Google Scholar]
- 22.Van Dooren T., Muyllaert D., Borghgraef P., Cresens A., Devijver H., Van der Auwera I., Wera S., Dewachter I., Van Leuven F. Neuronal or glial expression of human apolipoprotein e4 affects parenchymal and vascular amyloid pathology differentially in different brain regions of double- and triple-transgenic mice. Am. J. Pathol. 2006;168:245–260. doi: 10.2353/ajpath.2006.050752. [DOI] [PMC free article] [PubMed] [Google Scholar]
- 23.Simard A.R., Soulet D., Gowing G., Julien J.P., Rivest S. Bone marrow-derived microglia play a critical role in restricting senile plaque formation in Alzheimer’s disease. Neuron. 2006;49:489–502. doi: 10.1016/j.neuron.2006.01.022. [DOI] [PubMed] [Google Scholar]
- 24.Wilcock D.M., Rojiani A., Rosenthal A., Levkowitz G., Subbarao S., Alamed J., Wilson D., Wilson N., Freeman M.J., Gordon M.N., Morgan D. Passive amyloid immunotherapy clears amyloid and transiently activates microglia in a transgenic mouse model of amyloid deposition. J. Neurosci. 2004;24:6144–6151. doi: 10.1523/JNEUROSCI.1090-04.2004. [DOI] [PMC free article] [PubMed] [Google Scholar]
- 25.Yan Q., Zhang J., Liu H., Babu-Khan S., Vassar R., Biere A.L., Citron M., Landreth G. Anti-inflammatory drug therapy alters beta-amyloid processing and deposition in an animal model of Alzheimer’s disease. J. Neurosci. 2003;23:7504–7509. doi: 10.1523/JNEUROSCI.23-20-07504.2003. [DOI] [PMC free article] [PubMed] [Google Scholar]
- 26.Wilcock D.M., DiCarlo G., Henderson D., Jackson J., Clarke K., Ugen K.E., Gordon M.N., Morgan D. Intracranially administered anti-Abeta antibodies reduce beta-amyloid deposition by mechanisms both independent of and associated with microglial activation. J. Neurosci. 2003;23:3745–3751. doi: 10.1523/JNEUROSCI.23-09-03745.2003. [DOI] [PMC free article] [PubMed] [Google Scholar]
- 27.Selkoe D.J. The cell biology of beta-amyloid precursor protein and presenilin in Alzheimer’s disease. Trends Cell Biol. 1998;8:447–453. doi: 10.1016/s0962-8924(98)01363-4. [DOI] [PubMed] [Google Scholar]
- 28.Younkin S.G. Evidence that A beta 42 is the real culprit in Alzheimer’s disease. Ann. Neurol. 1995;37:287–288. doi: 10.1002/ana.410370303. [DOI] [PubMed] [Google Scholar]
- 29.Li R., Lindholm K., Yang L.B., Yue X., Citron M., Yan R., Beach T., Sue L., Sabbagh M., Cai H., et al. Amyloid beta peptide load is correlated with increased beta-secretase activity in sporadic Alzheimer's disease patients. Proc. Natl. Acad. Sci. USA. 2004;101:3632–3637. doi: 10.1073/pnas.0205689101. [DOI] [PMC free article] [PubMed] [Google Scholar]
- 30.Yang L.B., Lindholm K., Yan R., Citron M., Xia W., Yang X.L., Beach T., Sue L., Wong P., Price D., Li R., Shen Y. Elevated beta-secretase expression and enzymatic activity detected in sporadic Alzheimer disease. Nat. Med. 2003;9:3–4. doi: 10.1038/nm0103-3. [DOI] [PubMed] [Google Scholar]
- 31.Zhong Z., Ewers M., Teipel S., Burger K., Wallin A., Blennow K., He P., McAllister C., Hampel H., Shen Y. Levels of beta-secretase (BACE1) in cerebrospinal fluid as a predictor of risk in mild cognitive impairment. Arch. Gen. Psychiatry. (JAMA Psychiatry) 2007;64:718–726. doi: 10.1001/archpsyc.64.6.718. [DOI] [PubMed] [Google Scholar]
- 32.Christensen M.A., Zhou W., Qing H., Lehman A., Philipsen S., Song W. Transcriptional regulation of BACE1, the beta-amyloid precursor protein beta-secretase, by Sp1. Mol. Cell Biol. 2004;24:865–874. doi: 10.1128/MCB.24.2.865-874.2004. [DOI] [PMC free article] [PubMed] [Google Scholar]
- 33.Sambamurti K., Kinsey R., Maloney B., Ge Y.W., Lahiri D.K. Gene structure and organization of the human beta-secretase (BACE) promoter. FASEB J. 2004;18:1034–1036. doi: 10.1096/fj.03-1378fje. [DOI] [PubMed] [Google Scholar]
- 34.McFarlane S.M., Pashmi G., Connell M.C., Littlejohn A.F., Tucker S.J., Vandenabeele P., MacEwan D.J. Differential activation of nuclear factor-kappaB by tumour necrosis factor receptor subtypes. TNFR1 predominates whereas TNFR2 activates transcription poorly. FEBS Lett. 2002;515:119–126. doi: 10.1016/s0014-5793(02)02450-x. [DOI] [PubMed] [Google Scholar]
- 35.Rothe M., Sarma V., Dixit V.M., Goeddel D.V. TRAF2-mediated activation of NF-kappa B by TNF receptor 2 and CD40. Science. 1995;269:1424–1427. doi: 10.1126/science.7544915. [DOI] [PubMed] [Google Scholar]
- 36.Rothe M., Wong S.C., Henzel W.J., Goeddel D.V. A novel family of putative signal transducers associated with the cytoplasmic domain of the 75 kDa tumor necrosis factor receptor. Cell. 1994;78:681–692. doi: 10.1016/0092-8674(94)90532-0. [DOI] [PubMed] [Google Scholar]
- 37.Bourne K.Z., Ferrari D.C., Lange-Dohna C., Rossner S., Wood T.G., Perez-Polo J.R. Differential regulation of BACE1 promoter activity by nuclear factor-kappaB in neurons and glia upon exposure to beta-amyloid peptides. J. Neurosci. Res. 2007;85:1194–1204. doi: 10.1002/jnr.21252. [DOI] [PubMed] [Google Scholar]
- 38.Dohmen R.J. SUMO protein modification. Biochim. Biophys. Acta. 2004;1695:113–131. doi: 10.1016/j.bbamcr.2004.09.021. [DOI] [PubMed] [Google Scholar]
- 39.Hay R.T. SUMO: a history of modification. Mol. Cell. 2005;18:1–12. doi: 10.1016/j.molcel.2005.03.012. [DOI] [PubMed] [Google Scholar]
- 40.Mabb A.M., Miyamoto S. SUMO and NF-kappaB ties. Cell Mol. Life Sci. 2007;64:1979–1996. doi: 10.1007/s00018-007-7005-2. [DOI] [PMC free article] [PubMed] [Google Scholar]
- 41.Schwartz D.C., Hochstrasser M. A superfamily of protein tags: ubiquitin, SUMO and related modifiers. Trends Biochem. Sci. 2003;28:321–328. doi: 10.1016/S0968-0004(03)00113-0. [DOI] [PubMed] [Google Scholar]
- 42.Desterro J.M., Rodriguez M.S., Hay R.T. SUMO-1 modification of IkappaBalpha inhibits NF-kappaB activation. Mol. Cell. 1998;2:233–239. doi: 10.1016/s1097-2765(00)80133-1. [DOI] [PubMed] [Google Scholar]
- 43.Guo D., Li M., Zhang Y., Yang P., Eckenrode S., Hopkins D., Zheng W., Purohit S., Podolsky R.H., Muir A., et al. A functional variant of SUMO4, a new I kappa B alpha modifier, is associated with type 1 diabetes. Nat. Genet. 2004;36:837–841. doi: 10.1038/ng1391. [DOI] [PubMed] [Google Scholar]
- 44.Wang C.Y., Yang P., Li M., Gong F. Characterization of a negative feedback network between SUMO4 expression and NFkappaB transcriptional activity. Biochem. Biophys. Res. Commun. 2009;381:477–481. doi: 10.1016/j.bbrc.2009.02.060. [DOI] [PubMed] [Google Scholar]
- 45.Old L.J. Tumor necrosis factor. Sci. Am. 1988;258 doi: 10.1038/scientificamerican0588-59. 59–60, 69–75. [DOI] [PubMed] [Google Scholar]
- 46.Thommesen L., Laegreid A. Distinct differences between TNF receptor 1- and TNF receptor 2-mediated activation of NFkappaB. J. Biochem. Mol. Biol. 2005;38:281–289. doi: 10.5483/bmbrep.2005.38.3.281. [DOI] [PubMed] [Google Scholar]
- 47.Brink R., Lodish H.F. Tumor necrosis factor receptor (TNFR)-associated factor 2A (TRAF2A), a TRAF2 splice variant with an extended RING finger domain that inhibits TNFR2-mediated NF-kappaB activation. J. Biol. Chem. 1998;273:4129–4134. doi: 10.1074/jbc.273.7.4129. [DOI] [PubMed] [Google Scholar]
- 48.Takeuchi M., Rothe M., Goeddel D.V. Anatomy of TRAF2. Distinct domains for nuclear factor-kappaB activation and association with tumor necrosis factor signaling proteins. J. Biol. Chem. 1996;271:19935–19942. doi: 10.1074/jbc.271.33.19935. [DOI] [PubMed] [Google Scholar]
- 49.Botto M., Dell'Agnola C., Bygrave A.E., Thompson E.M., Cook H.T., Petry F., Loos M., Pandolfi P.P., Walport M.J. Homozygous C1q deficiency causes glomerulonephritis associated with multiple apoptotic bodies. Nat. Genet. 1998;19:56–59. doi: 10.1038/ng0598-56. [DOI] [PubMed] [Google Scholar]
- 50.Matsuoka Y., Picciano M., Malester B., LaFrancois J., Zehr C., Daeschner J.M., Olschowka J.A., Fonseca M.I., O'Banion M.K., Tenner A.J., Lemere C.A., Duff K. Inflammatory responses to amyloidosis in a transgenic mouse model of Alzheimer’s disease. Am. J. Pathol. 2001;158:1345–1354. doi: 10.1016/S0002-9440(10)64085-0. [DOI] [PMC free article] [PubMed] [Google Scholar]
- 51.Casas C., Sergeant N., Itier J.M., Blanchard V., Wirths O., van der Kolk N., Vingtdeux V., van de Steeg E., Ret G., Canton T., et al. Massive CA1/2 neuronal loss with intraneuronal and N-terminal truncated Abeta42 accumulation in a novel Alzheimer transgenic model. Am. J. Pathol. 2004;165:1289–1300. doi: 10.1016/s0002-9440(10)63388-3. [DOI] [PMC free article] [PubMed] [Google Scholar]
- 52.Schmitz C., Rutten B.P., Pielen A., Schafer S., Wirths O., Tremp G., Czech C., Blanchard V., Multhaup G., Rezaie P., et al. Hippocampal neuron loss exceeds amyloid plaque load in a transgenic mouse model of Alzheimer’s disease. Am. J. Pathol. 2004;164:1495–1502. doi: 10.1016/S0002-9440(10)63235-X. [DOI] [PMC free article] [PubMed] [Google Scholar]