Abstract
Single crystal copper oxide nanoplatelets with a high percentage of {001} facets were synthesized by a facile hydrothermal approach. The as-prepared materials were characterized by X-ray diffraction, Fourier transform infrared spectroscopy, field emission scanning electron microscopy, and high resolution transmission microscopy. Via density functional theory calculations, it was found that the {001} facets are active crystal planes. When the single crystal CuO nanoplatelets were applied as an anode material in Li-ion batteries, they demonstrated outstanding electrochemical performance with high lithium storage capacity, satisfactory cyclability, and excellent high rate capacity. When used as a sensing material in gas sensors, they exhibited a superior sensitivity towards toxic and flammable gases.
Nanosize materials have peculiar properties that are not expected in the bulk phase, and elucidation of these properties has already led to breakthroughs in various fields of science and technology. The electrical and optical properties of nanoparticles are often size- and shape-dependent, and hence, it is essential to be able to control the particle size, shape, and distribution1,2,3. These require a detailed understanding of the mechanisms of nucleation and growth, as well as processes such as aggregation and coarsening4,5. Compared to the morphogenesis of metal oxide, however, much less attention has been paid to the crystal plane effects of nanocrystals in different reactions. Actually, they should have attracted remarkable attention, because they are essential factors for the interaction6,7,8,9. Uniform crystal planes at the nanoscale are the most important prerequisite in investigating the differences in properties due to facets from different planes. As one example, TiO2 with exposed {001} facets has been widely researched10,11,12,13,14, because both theoretical and experimental studies have found that the minority {001} facets in the equilibrium state are especially reactive15.
As an important transition metal oxide, cupric oxide (CuO) has been extensively studied due to its diverse applications, such as in gas sensors, catalysis, batteries, high critical temperature superconductors, solar energy conversion, and field emission emitters16,17,18,19. As anode for Li-ion battery, CuO can achieve superior electrochemical performance20. In this study, we found that the {001} facets of CuO are more reactive. We show that p-type semiconductor gas sensors based on CuO with {001} exposed facets have a rapid response and high sensitivity to very low concentrations of flammable and toxic gases. Furthermore, CuO with {001} exposed facets has also demonstrated significantly improved lithium storage capacity and cycling stability in lithium ion cells. In particular, it has excellent high rate performance in Li-ion batteries.
Results and discussion
Structural and morphological analyses
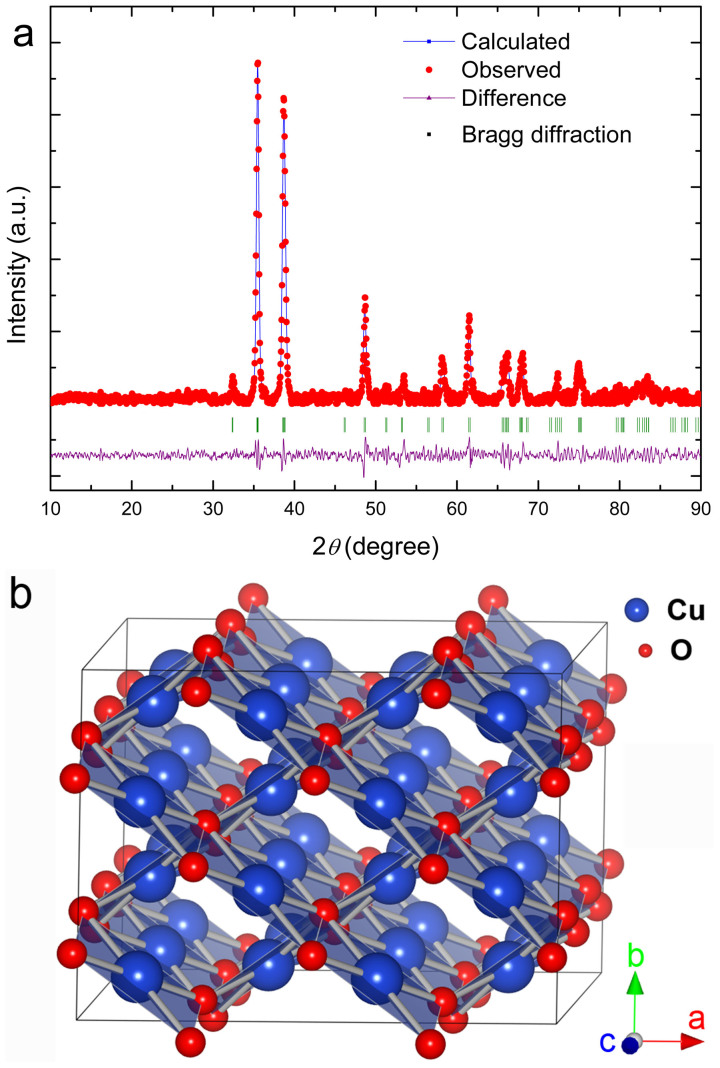
Figure 1(a) shows the refined X-ray diffraction pattern of the CuO nanoplatelets. It can be well indexed with a pure monoclinic symmetry unit cell with space group C2/c and has satisfactory convergence factors (Rwp = 9.23%, Rp = 7.57%, χ2 = 3.17). The lattice parameters were refined as listed in Table 1. The refined crystal structure of CuO is shown in Figure 1(b), in which the Cu atom is coordinated by four coplanar O atoms forming an almost rectangular parallelogram, while the O coordination polyhedron has four Cu atoms at the corners of a distorted tetrahedron. The CuO, by sharing opposite edges, forms two ribbons of parallelograms running in the [l10] and  directions. In the [101] and
  directions, two types of -Cu-O-Cu- chains could be differentiated.
Figure 1.
(a) Rietveld refinement pattern of X-ray diffraction data for as-prepared CuO nanoplatelets. (b) Crystal structure of the refined CuO unit cell.
Table 1. Optimized lattice parameters of CuO.
| CuO | |||
|---|---|---|---|
| Lattice parameters | Calculated | Experimental | Difference/% |
| a/Å | 4.68 | 4.69 | 0.21 |
| b/Å | 3.42 | 3.43 | 0.29 |
| c/Å | 5.14 | 5.10 | 0.78 |
| α,β, γ/° | 90 99.53 90 | 90 99.51 90 | 0.02 |
| Cell volume/Å3 | 80.59 | 81.37 | 0.96 |
Upon energy minimisation of the bulk crystal, the lattice parameters of CuO were calculated, as shown in Table 1. All the differences between the calculated results and the experimental values are less than 1%, indicating good accuracy of the computational method.
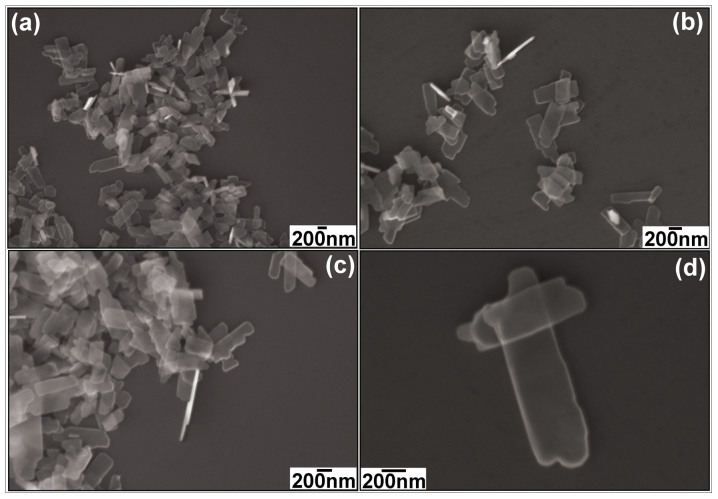
The morphology of as-prepared CuO is revealed by FESEM, as shown in Figure 2. In the low magnification FESEM image (Figure 2(a)), it can be seen that the CuO consists of well-defined nanoplatelet structures with irregular, roughly rectangular outlines. The width of the cross-section is between 200 and 300 nm. The thickness is less than 50 nm, as shown in Figure 2(b) and (c). Because the nanoplatelets are thin enough, they are transparent even when they overlap, which is demonstrated by the high magnification FESEM image (Figure 2(d). For comparison, different alkali and amount of the alkali were used for preparation. When the NaOH solution was used instead of the LiOH, CuO nanoparticles were obtained as shown by Figures S1 and S2 in the Supporting Information (SI). The morphology of as-prepared CuO nanoparticles is not changed too much if the amount of NaOH was reduced, as shown by Figure S3 (a) (SI). When the LiOH amount was increased to 20 mmol, it was found that the as-prepared CuO still preserved the nanoplatelets morphology as shown by Figure S3(b) (SI). Therefore, the kind of alkalis is more important for the synthesis of CuO nanoplatelets,
Figure 2. FESEM images of the as-prepared faceted CuO nanoplatelets: (a) low magnification, (b) and (c) medium magnification, and (d) high magnification.
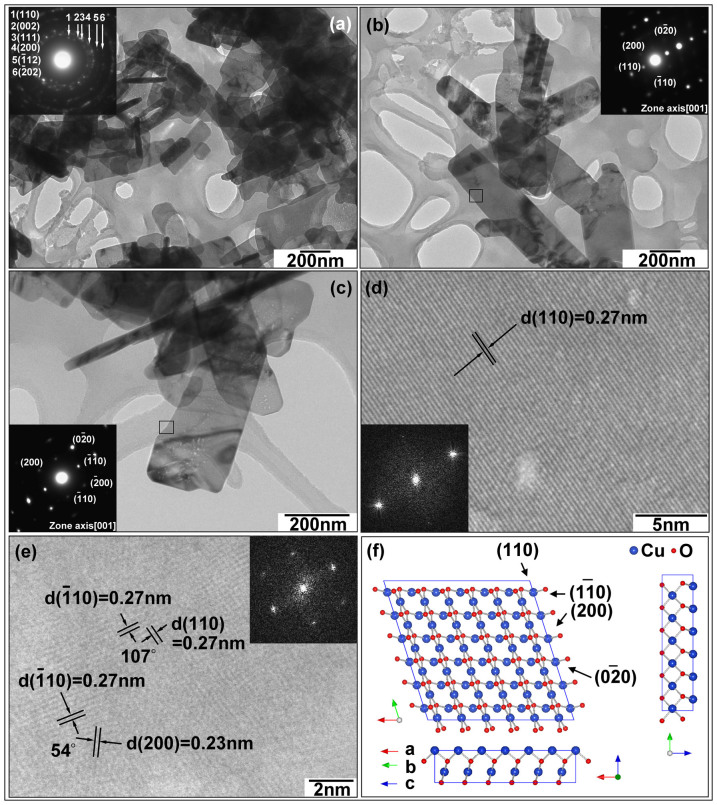
The morphology of the as-prepared CuO nanoplatelets was further characterized by TEM and HRTEM analyses (Figure 3). Figure 3(a) contains a low magnification TEM image of the CuO nanocrystals and its corresponding SAED pattern (inset in Figure 3(a)). From the SAED pattern, it can be seen that all diffraction rings can be indexed to the monoclinic CuO phase. High magnification TEM images (Figure 3(b) and (c)) demonstrate that the free-standing nanocrystals are thin enough to be transparent. The SAED patterns (insets in Figure 3(b) and (c)) taken from different CuO nanocrystals show the same rhombus of diffraction spots along the [001] zone axis (as the (200), (020), (011), and (110) crystal planes can be indexed), suggesting that each free-standing CuO nanocrystal has the same {001} facets exposed. The lattice resolved HRTEM images (Figures 3(d) and (e)) directly present the (110),  , and (200) crystal planes with 0.27 nm and 0.23 nm d-spacings, and 107° and 54° interfacial angles. The normal direction to these crystal planes can be further confirmed as [001]. Thus, as illustrated by Figure 3(f), the as-prepared CuO faceted single-crystal has {001} dominant exposed crystal planes.
Figure 3.
(a) Low magnification TEM image of CuO. (b–c) High magnification TEM images of CuO. (d–e) Lattice resolved HRTEM images of CuO. (f) Crystal structure of {001} crystal planes of CuO. Insets in (a), (b), and (c) are selected area electron diffraction (SAED) patterns. Insets in (d) and (e) are fast-Fourier-transform (FFT) patterns.
The quality of the CuO nanoplatelets was also examined by FTIR spectroscopy, as shown in Figure S4 (SI). The typical FTIR spectrum of the as-prepared CuO nanoplatelets has sharp and narrow peaks at 663, 574, and 458 cm−1, characteristic peaks for the Cu-O stretching vibration, which is redshifted compared with a previous report20. The high-frequency mode at 663 cm−1 is the Cu-O stretching vibration along the  direction, and the mode at 574 cm−1 is the Cu-O stretching vibration along the [101] direction21.
To study the surface activities of CuO, a set of suitable surface energies for the crystal planes were calculated. The surface region in our calculations is composed of a finite number of two-dimensional infinite planes formed by cutting the crystal along a particular Miller index (hkl) plane. In each plane, a two-dimensional cell represents every site in the plane. Following the approach of Tasker22, several of these cells in successive planes comprise the basic repeated unit of CuO that has the composition of the bulk crystal unit cell. We treated the {100}, {010}, {001}, {110}, {101}, and {011} crystal planes in this work. According to the previous results23,24, the relaxed surface energy is lower than the unrelaxed surface energy, which indicates the importance of modelling the surface relaxation. Herein, the ion coordinates in each cell were calculated by using the relaxed crystal coordinates. The relaxed unit cell of CuO was extended to construct the surface models as shown in Figure 4.
Figure 4. Side views of relaxed {101}, {001}, {011}, {010}, {110}, and {100} crystal planes of CuO.
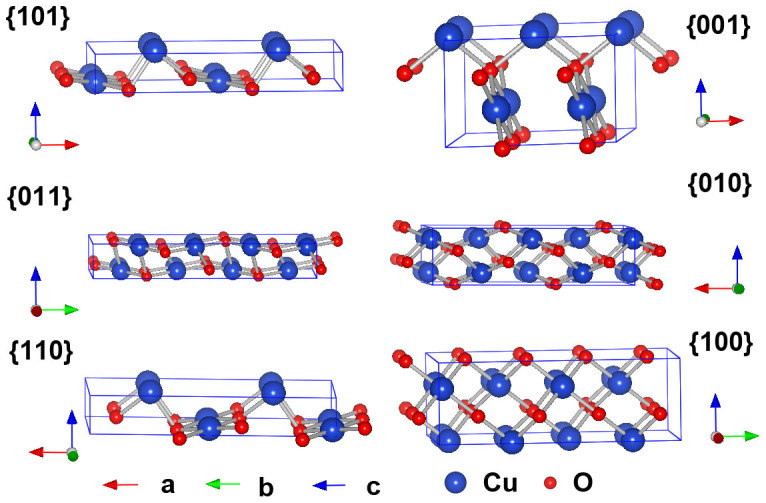
The most stable surface energies for the relaxed surface regions of CuO are listed in Table 2. It shows that the {010} surfaces of CuO have the lowest energy (1.04 J m−2), while the {011} surfaces have the second smallest surface energy, followed by the {100} surfaces, which are all less than 2 J m−2, indicating their structural similarities. {101} and {110} surfaces have relatively larger surface energies, which are all more than 2.5 J m−2. {001} surfaces have the largest surface energy, 4.23 J m−2. Therefore, the most active surfaces of CuO are {001}. We also calculated the interaction energy between lithium and different facets of CuO. It can be seen that {001} facets yield the lowest interaction energy (1.88 J m−2), while {010} facets show the highest value (8.47 J m−2). Apparently, the {001} crystal planes show the highest activity due to their high surface energy, which can provide more reactive sites to facilitate interaction with Li, and therefore, they consume the lowest energy to accomplish reactions. We expect that the as-prepared CuO nanoplatelets with exposed high energy {001} facets could provide highly reactive sites, leading to enhanced performance for nanotechnological applications. We tested the gas sensing and Li-ion battery properties of the CuO nanoplatelets.
Table 2. Calculated surfaces energies, interaction energy between lithium and different facets of CuO.
| CuO | |||
|---|---|---|---|
| Surface | d-spacing, dhkl/Å | Surface energy/J m−2 | Interaction energy/J m−2 |
| 001 | 5.038 | 4.23 | 1.88 |
| 010 | 3.41 | 1.04 | 8.47 |
| 100 | 4.589 | 1.73 | 6.05 |
| 011 | 2.824 | 1.22 | 5.42 |
| 101 | 3.144 | 2.51 | 3.42 |
| 110 | 2.737 | 2.69 | 3.43 |
Gas-sensing performance
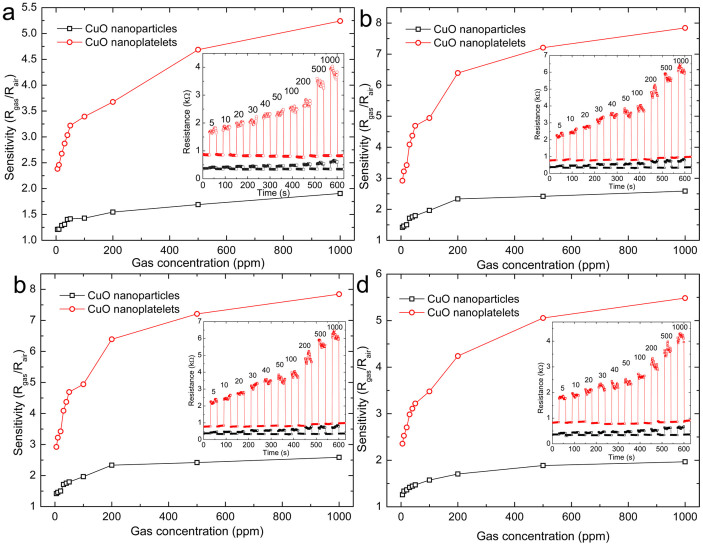
Figure 5 shows the gas sensitivities of CuO nanoplatelet based sensors as a function of the gas concentrations of acetone, butanol, ethanol, and isopropanol. For comparison, the sensitivities of CuO nanoparticles are also given in Figure 5. Generally, the sensitivity of the CuO nanoplatelets is higher than that of the CuO nanoparticles. The CuO nanoplatelets presented outstanding sensitivity to low concentrations of gases. The insets in Figure 5 show the real-time responses towards different gases. Ten testing cycles were recorded, corresponding to ten different concentrations from 5 to 1000 ppm. It can be seen that the electric resistance of the sensor (Rsensor) increased abruptly on the injection of gas, and then decreased rapidly and recovered to its initial value after the test gas was released. The response magnitude of the CuO nanoplatelets increased significantly with increasing concentration of the test gas and was much higher than that of the CuO nanoparticles. After many cycles, the resistance of the sensor recovered to its initial state, which indicates that the CuO nanoplatelet sensor has good reversibility. The response time and recovery time (defined as the times required to reach 90% of the final equilibrium value) of the CuO nanoplatelet sensor were both less than 1 s. It was also found that the on and off responses could be repeated after continuous measurement for two weeks, with no detectable changes in the signal, illustrating the good reversibility and stability of the CuO nanoplatelet based sensor.
Figure 5. Gas sensitivities of CuO nanoplatelet based sensors as a function of the gas concentrations of (a) acetone, (b) butanol, (c) ethanol, and (d) isopropanol gases.
For comparison, the gas sensing performances of CuO nanoparticles are also presented. The insets are the corresponding real-time gas-sensing curves for the CuO nanoplatelets (red) and nanoparticles (black), with the concentrations of the test gas in ppm given above the peaks.
From Ohm's law, the electrical resistance of the sensor underwent a decreasing and increasing process when the test gas was turned on and off, respectively. The mechanism responsible for the gas sensing is considered to follow the surface conduction modulation25,26. CuO is a p-type semiconductor, in which the positive holes are the majority carriers43. Upon exposure to a reducing gas, the density of p-type charge carriers (positive holes) would decrease due to surface adsorption and chemical reactions between the gas and the oxygen adsorbates (electron acceptors), resulting in an increase of the sensor's resistance27. The improved sensing performance of the CuO nanoplatelets should be ascribed to the high surface energy of the predominantly exposed {001} crystal planes, which can provide more active sites and improve the kinetics of both the reactions of the reducing gases with surface-adsorbed oxygen and the replacement of the latter from the gas phase.
Electrochemical performance of CuO nanoplatelets
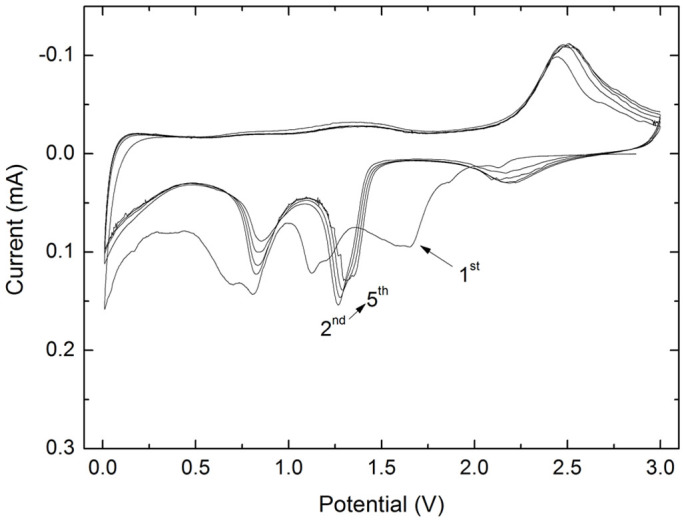
The electrochemical performance of the CuO nanoplatelets was investigated by cyclic voltammetry (CV) and galvanostatic charge and discharge measurements. Figure 6 shows the CV curves. They are similar to previous reported results28,29. During the first cycle, three cathodic peaks are observed at 1.6, 1.2, and 0.8 V, respectively. These peaks can be associated with a multistep reaction related to the creation of a  solid solution within the CuO phase, the formation of a Cu2O phase, and finally, the decomposition into metallic Cu and Li2O, respectively30,31. Furthermore, a relatively strong cathodic peak at low potential between 0.01 and 0.3 V can be derived from the formation of a solid electrolyte interphase (SEI), which can lead to an extra capacity besides the reversible Li driven decomposition of the transition-metal oxide32. The anodic peak appearing at 2.5 V is due to the oxidation of metallic Cu-Cu (I) and to the partial oxidation of Cu (I)-Cu (II). The broad bump around 1.45 V could be associated with decomposition of the SEI layer30,31. In the subsequent cycles, the cathodic and anodic peaks have a positive shift. Both the peak current and the integrated area of the anodic peak are stable and well overlapped with each other, indicating the high reversibility and good capacity retention of the CuO nanoplatelets. For comparison, the CV curves of the CuO nanoparticles are given in Figure S5 (SI). There is a broad peak that appears at about 1.03 V in the cathodic process in the first cycle, which could be attributed to the reduction process from Cu (II) to Cu. In addition, this cathodic process is also associated with electrolyte decomposition and the reversible conversion reaction of lithium ion intercalation to form Li2O. An anodic peak is present at about 2.42 V, corresponding to the reversible oxidation of Cu to Cu (II). During the anodic process, both the peak current and the integrated area of the anodic peak are decreased, indicating capacity loss during the charging process.
Figure 6. CV curves for the first 5 cycles of the CuO nanoplatelets in a lithium ion cell.
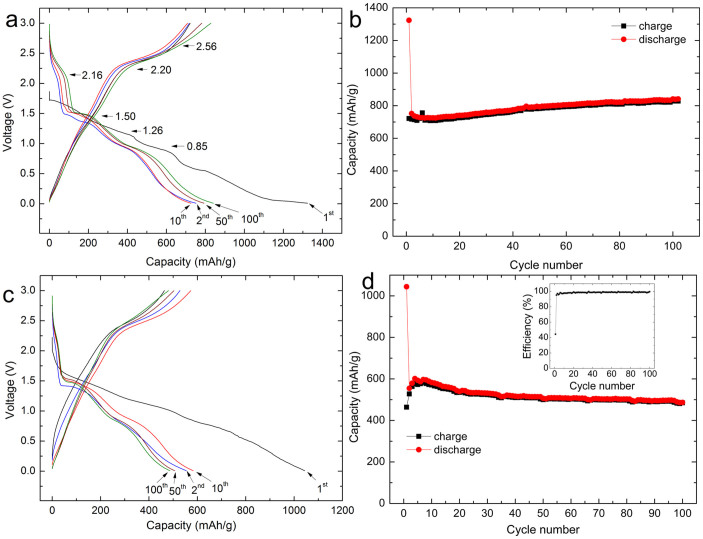
The CV peaks and their variations are consistent with the galvanostatic discharge-charge profiles as shown in Figure 7. Three distinct potential slopes are visible in both the discharge and the charge curves, as shown in Figure 7(a). As indicated by the arrows in Figure 7(a), in the discharge process, there are three different plateaus, located at 2.16, 1.5, and 0.85 V, respectively, while in the charge process, the slopes are located at around 1.26, 2.2, and 2.56 V. In the first cycle at a current density of 134 mA g−1 (0.2 C), the CuO nanoplatelet electrode achieved a discharge capacity of 1323 mA h g−1. The subsequent discharge profiles show a more pronounced step-like profile, with a typical upwards shift of the voltage plateau due to the enhanced tendency towards dissolution of the regenerated nano-CuO after the initial reaction with Li, as discovered for the CuO/Li primary battery33. Figure 7(b) presents the evolution of the charge and discharge capacities during cycling. It can be seen that after 100 cycles, the test cell delivered a discharge capacity of 841 mA h g−1, demonstrating ultra-high cyclability at a low current rate. For comparison, the initial discharge capacity of the CuO nanoparticle electrode was 1050 mA h g−1, and from the second cycle, the discharge capacity decreased continuously and only delivered 340 mA h g−1 after 100 cycles (Figure S6, SI). Obviously, the CuO nanoplatelet electrode shows better capacity retention. On increasing the current rate to 0.5 C, the capacity is still as high as 700 mA h g−1 (Figure S7, SI). The extra capacity above the theoretical value (670 mA h g−1)29 is most likely due to the decomposition of electrolyte during the discharge process. In this step, the SEI layer is formed and covers the CuO to protect the electrode from the intercalation of solvent34,35. Figure 7(c) and (d) shows the electrochemical performance of the CuO nanoplatelet electrode at the 1 C current rate. It can be seen that the initial discharge capacity is 1041 mA h g−1. Although the discharge capacity is reduced to 552 mA h g−1 in the second cycle, from the third cycle, the coulombic efficiency reaches as high as 98.96% (inset in Figure 7(d)), and the electrode presents remarkable cyclability (502 mA h g−1 after 100 cycles).
Figure 7. Discharge and charge profiles and cycling performance of CuO nanoplatelet electrode at 0.2 C (a, b) and 1 C (c, d) current rates.
The inset in (d) is the corresponding coulombic efficiency.
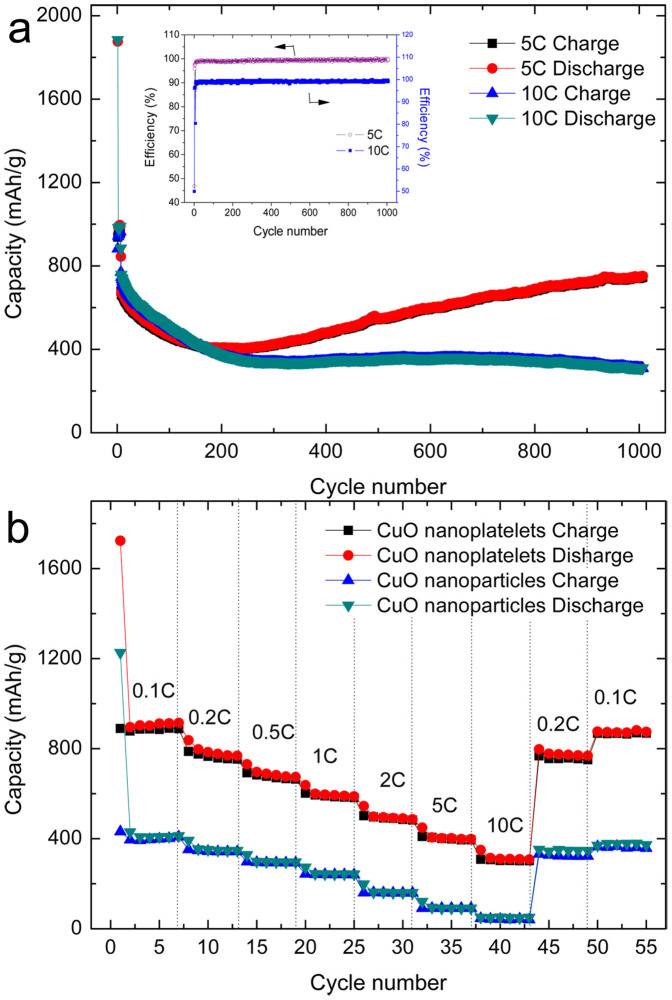
We also cycled CuO nanoplatelets at the high current rates of 5 C and 10 C for 1000 cycles to investigate their realistic applicability. As shown in Figure 8(a), the charge and discharge capacity curves are almost overlapping due to the ultra-high coulombic efficiency, with an average value of 99.27% over 1000 cycles. After 200 cycles at 5C, there is rapid capacity increase. Such capacity increase phenomenon was also reported by other publications on CuO20,36,37, other metal38, and metal oxide anodes39,40. It should be attributed to the reversible formation of gel-like polymeric species in the SEI films due to the catalytic activity of metals in the anodes20,36,37,38,39,40,41,42, and the volume change of the CuO anodes during the lithium-ion insertion/extraction may build more reversible polymeric species, which result into the continuous increase in capacity after 200 cycles20. It might be also the reason that the capacity of CuO nanoplatelets at 5C is a little lower than that of 10C rate in the first 100 cycles, because more reversible polymeric species were generated at 10 C rate in the first 100 cycles, which result into the higher capacity. The cells retained above 751 and 309 mA h g−1 discharge capacities at 5 C and 10 C, respectively, after 1000 cycles. CuO nanoparticle electrodes were also tested at 5 C and 10 C. Although they presented high initial discharge capacity, they just retained 150 and 68 mA h g−1 discharge capacity after 1000 cycles, respectively (Figure S8, SI). It can be seen that the as-prepared CuO nanoplatelet electrode exhibited superior electrochemical performance in long-term cycling at high current rate. These results are the better than other reported CuO anode materials with different size36,44,45. Figure 8(b) compares the cycling performances of CuO nanoplatelets and CuO nanoparticles at varied current rates. The CuO nanoplatelets yield 914, 798, 701, 601, 516, 411, and 322 mA h g−1 discharge capacity at the 0.1, 0.2, 0.5, 1, 2, 5, and 10 C current rates, respectively, and when the current rate is reversed back to the initial low current rate, the cell capacity recovers to the original value, indicating that the integrity of the CuO nanoplatelets has been preserved, even after high rate cycling. This implies that the CuO nanoplatelets are tolerant to varying charge and discharge currents, which is preferred for high power applications. In contrast, when the CuO nanoparticle electrode was operated at elevated current rates, the capacity was decreased to an extremely low level. (At 10 C, the capacity is only 46 mA h g−1.)
Figure 8.
(a) Cycling performance of CuO nanoplatelet electrode at the high current rates of 5 C and 10 C. The inset shows the coulombic efficiency. (b) Rate performance of the CuO nanoplatelet and CuO nanoparticle electrodes.
The superior electrochemical performance of as-prepared CuO nanoplatelets should be ascribed to the predominantly exposed {001} facets. Generally, high energy surfaces have a large density of low-coordinated atoms situated on steps and kinks, giving them high reactivity46. This favours fast ion transfer between the surface and the interior47,48. Because the {001} facets have relatively high surface energy, they can provide reactive sites for the reaction with lithium ions, which can facilitate a fast conversion reaction towards lithium during the charge and discharge processes. On the other hand, the thin nanoplatelet architecture provides a short path for lithium transport and high surface area for interfacial lithium storage35,49.
Conclusion
CuO nanoplatelets were prepared by a simple low temperature hydrothermal method. XRD, FESEM, and HRTEM analyses revealed that the CuO nanoplatelets have predominantly exposed {001} crystal planes. Through the DFT calculations, it was found that the {001} facets have the highest surface energy. For this reason, the CuO nanoplatelets exhibited high sensing responses towards ethanol, acetone, butanol, and isopropanol, indicating their potential application in monitoring toxic and flammable gases. When used as anodes for lithium storage in Li-ion batteries, the CuO nanoplatelets delivered a higher reversible lithium storage capacity than the corresponding nanoparticles. After 100 cycles, the nanoplatelet electrode retained 841 and 502 mA h g−1 capacity at the 0.2 C and 1 C rates, respectively. Furthermore, this material also demonstrated an outstanding high rate performance. The superior electrochemical performance should be ascribed to the predominantly exposed {001} reactive facets and the thin nanoplatelet architecture.
Experimental Section
Synthesis process
Copper oxide nanoplatelets with {001} facets exposed were synthesized by a low temperature hydrothermal method. In a typical synthesis process, 1 mmol copper (II) chloride dihydrate (CuCl2·7H2O, 99+%, Sigma-Aldrich), and 3 mmol lithium hydroxide monohydrate (LiOH·H2O, Sigma-Aldrich) were first dissolved in 20 ml distilled water and stirred for ten minutes. The solution was then sealed in a Teflon-lined stainless steel autoclave (25 mL capacity). The autoclave was heated and maintained at 180°C for 2 h. The autoclave was then cooled down to room temperature, leading to the conversion of the precipitate into a black solid product. The precipitates were retrieved by washing with ethanol and water several times and drying in a vacuum oven at 70°C for 12 hours.
For comparison, CuO nanoparticles were synthesized: 1 mmol of CuCl2·2H2O was dissolved in 20 ml H2O, which was stirred with a magnetic stirrer. This solution was stirred for 15 min to ensure that the CuCl2 was dissolved completely. Then, 10 ml 2 M NaOH aqueous solution was added dropwise into the CuCl2 solution under constant stirring. The solution was then sealed in a Teflon-lined stainless steel autoclave, heated, and maintained at 200°C for 12 h. When the autoclave was cooled down to room temperature, the black CuO precipitate was washed with distilled water several times and then with ethanol, filtered, and dried in an oven at 70°C for 12 hours.
Structural and physical characterization
The crystal structure and phase of the as-prepared materials were characterized by X-ray diffraction (XRD, Siemens D5000) using Cu Kα radiation with 2θ ranging from 20° to 90° and a scanning step of 0.02° sec−1. The morphology was analyzed by high resolution field emission scanning electron microscopy (FESEM, Zeiss Supra 55VP). The microscope was operated at a working distance of 2 mm with an acceleration voltage of 20 kV, and an in-lens detector was used for the imaging. The details of the structure were further characterized by transmission electron microscopy (TEM) and high-resolution transmission electron microscopy (HRTEM, JEOL JEM-2011). Selected area electron diffraction (SAED) patterns were recorded by a Gatan charge-coupled device (CCD) camera in a digital format. The Fourier transform infrared (FTIR) spectra of the samples were collected using a Bruker Tensor 27 IR spectrometer with KBr as dispersant.
Gas-sensing measurements
The gas-sensing properties of the as-prepared faceted CuO were measured by a computer-controlled WS-30A gas-sensing measurement system. Figure S9 (SI) contains a schematic diagram of the system. In the procedure for making the sensors, the as-prepared CuO is first dispersed in tetraethylammonium tetrafluoroborate (Sigma-Aldrich, 99%, as binder) and ethanol to form a slurry. The mixture is then deposited as a thin film on a ceramic tube with Au electrodes and Pt conducting wires. Finally, the ceramic tube is heated at 400°C for 2 h to evaporate the solvent. The gas sensing measurements were carried out at a working temperature of 150°C and 30% relative humidity (RH).
Electrochemical testing
The electrodes were prepared by dispersing the as-prepared CuO (80 wt.%), acetylene carbon black (10 wt.%), and poly (vinylidene fluoride) binder (PVDF, 10 wt.%) in N-methyl-2-pyrrolidone (NMP) to form a slurry. The resultant slurry was pasted onto copper foil using a doctor blade and dried at 100°C for 12 h under vacuum conditions, followed by pressing at 200 kg cm−2. Electrochemical measurements were carried out using two-electrode coin cells with lithium metal as the counter electrode. The CR2032-type coin cells were assembled in an argon-filled glove box (UniLab, Mbraun, Germany). The electrolyte solution was 1 M LiPF6 dissolved in a mixture of ethylene carbonate (EC) and dimethyl carbonate (DMC) with a volume ratio of 1:1. Cyclic voltammetry (CV) was carried out on a CHI 660C electrochemistry workstation with a scan rate of 0.1 mV s−1 from 0.01 to 3.0 V in a two-electrode system. The charge-discharge measurements were performed at ambient temperature at different current densities in the voltage range from 0.01 to 3.0 V.
Computational methods
Electronic structure calculations were based on the density functional theory (DFT) + U approach50. The exchange-correlation energy functional was represented by the local-density approximation (LDA)51 employing ultra-soft pseudopotential (USPP) formalism52, The valence configurations of the pseudopotentials were 2s2p4 for O and 3d104s1 for Cu. We used an energy cut-off of 350 eV in the plane-wave basis set expansion. Monkhorst-Pack k-point sets of 6 × 6 × 6 were used for an 8-atom unit cell of monoclinic CuO (space group C2/c). The on-site Coulomb repulsion (Hubbard U) was applied for Cu d states. The effective value for U of 9.0 eV for Cu was derived by fitting to experimental oxidation enthalpies, and it gave better estimates for band gaps53. The maximum self-consistent field convergent tolerance was less than 2 × 10⁻⁶ eV atom−1. All calculations were performed in reciprocal space.
The surface energy per unit area,  , of a particular surface is calculated from the difference between the energy of the surface block, Esurface block, and the energy of the same number of bulk ions, Ebulk, per unit area, A, and thus
 |
The variations in energy of the Li interactions on the different facets of the CuO,  , is calculated from the difference between the (hkl) surface energy,
  , the energy of Li monomer in vacuum,
  , and the total energy of the interacting system of the (hkl) CuO surface substrate and Li, per unit area, and thus
 |
For model construction, the depths of the surface regions were chosen to be large enough to ensure full relaxation of the surface ions (approximately 200 ions) and convergence of the surface energy. In each case, surface structures were fully relaxed until the total energy difference had converged within 0.001 eV.
We considered the low index surfaces containing planes that have the largest interplanar spacing (dhkl) and, as a result, are often the most stable. These are the most important planes morphologically predicted by the Bravais-Friedel-Donnay-Harker theory54. This approach assumes that the morphologically dominant faces (slowest growing) are those with thicker growth slices. Clearly, this is an over simplification, but it is nonetheless useful in reducing an infinite number of possibilities to a small set which includes the facets that will appear in the morphology.
Author Contributions
D.-W.S. performed the experiments. X.-Q.X. assisted the experiments. S.-X.D. and G.-X.W. conceived the study. D.-W.S. wrote the manuscript. All authors discussed the results and reviewed the manuscript.
Supplementary Material
Supporting Information for CuO single-crystal with exposed X001X facets - A highly efficient material for gas sensing and Li-ion battery applications
Acknowledgments
This original research was proudly supported by Commonwealth of Australia through the Automotive Australia 2020 Cooperative Research Centre (AutoCRC). The authors acknowledge use of facilities within the UOW Electron Microscopy Centre.
References
- Tarascon J. M. & Armand M. Issues and Challenges Facing Rechargeable Lithium Batteries. Nature 414, 359–367 (2001). [DOI] [PubMed] [Google Scholar]
- Bruce P. G., Scrosati B. & Tarascon J. M. Nanomaterials for Rechargeable Lithium Batteries. Angew. Chem., Int. Ed. 47, 2930–2946 (2008). [DOI] [PubMed] [Google Scholar]
- Armand M. & Tarascon J. M. Building better batteries. Nature 451, 652–657 (2008). [DOI] [PubMed] [Google Scholar]
- Sun Y. & Xia Y. Shape-controlled synthesis of gold and silver nanoparticles. Science 298, 2176–2179 (2002). [DOI] [PubMed] [Google Scholar]
- Gudiksen M. S. et al. Growth of nanowire superlattice structures for nanoscale photonics and electronics. Nature 415, 617 (2002). [DOI] [PubMed] [Google Scholar]
- Burda C. et al. Chemistry and properties of nanocrystals of different shapes. Chem. Rev. 105, 1025–1102 (2005). [DOI] [PubMed] [Google Scholar]
- Zhou K. B. et al. Enhanced catalytic activity of ceria nanorods from well-defined reactive crystal planes. J. Catal. 229, 206–212 (2005). [Google Scholar]
- Tian N. et al. Synthesis of tetrahexahedral platinum nanocrystals with high-index facets and high electro-oxidation activity. Science 316, 732–735 (2007). [DOI] [PubMed] [Google Scholar]
- Si R. & Flytzani-Stephanopoulos M. Shape and Crystal-Plane Effects of Nanoscale Ceria on the Activity of Au-CeO2 Catalysts for the Water–Gas Shift Reaction. Angew. Chem., Int. Ed. 47, 2884 (2008). [DOI] [PubMed] [Google Scholar]
- Chen J. S. et al. Constructing hierarchical spheres from large ultrathin anatase TiO2 nanosheets with nearly 100% exposed (001) facets for fast reversible lithium storage. J. Am. Chem. Soc. 132, 6124–6130 (2010). [DOI] [PubMed] [Google Scholar]
- Yang H. G. et al. Anatase TiO2 single crystals with a large percentage of reactive facets. Nature 453, 638–642 (2008). [DOI] [PubMed] [Google Scholar]
- Liu G. et al. Titania-based photocatalysts-crystal growth, doping and heterostructuring. J. Am. Chem. Soc. 131, 12868–12869 (2009).19697930 [Google Scholar]
- Yang H. G. et al. Solvothermal synthesis and photoreactivity of anatase TiO2 nanosheets with dominant {001} facets. J. Am. Chem. Soc. 131, 4078–4083 (2009). [DOI] [PubMed] [Google Scholar]
- Liu S. W., Yu J. G. & Jaroniec M. Tunable photocatalytic selectivity of hollow TiO2 microspheres composed of anatase polyhedra with exposed {001} facets. J. Am. Chem. Soc. 132, 11914–11916 (2010). [DOI] [PubMed] [Google Scholar]
- Gong X. Q. & Selloni A. Reactivity of anatase TiO2 nanoparticles: the role of the minority (001) surface. J. Phys. Chem. B 109, 19560–19562 (2005). [DOI] [PubMed] [Google Scholar]
- Zhang J. et al. Nearly monodisperse Cu2O and CuO nanospheres: preparation and applications for sensitive gas sensors. Chem. Mater. 18, 867–871 (2006). [Google Scholar]
- Rout L., Sen T. K. & Punniyamurthy T. Efficient CuO-Nanoparticle-Catalyzed C-S Cross-Coupling of Thiols with Iodobenzene. Angew. Chem., Int. Ed. 46, 5583–5586 (2007). [DOI] [PubMed] [Google Scholar]
- Poizot P. et al. Nano-sized transition-metal oxides as negative-electrode materials for lithium-ion batteries. Nature 407, 496–499 (2000). [DOI] [PubMed] [Google Scholar]
- Karthick Kumar S., Murugesan S. & Suresh S. Preparation and characterization of CuO nanostructures on copper substrate as selective solar absorbers. Mater. Chem. Phys. 143, 1209–1214 (2014). [Google Scholar]
- Xu Y. et al. Nano-structured Carbon-coated CuO Hollow Spheres as Stable and High Rate Anodes for Lithium-ion Batteries. J. Mater. Chem. A 1, 15486–15490 (2013). [Google Scholar]
- Kliche G. & Popovic Z. V. Far-infrared spectroscopic investigations on CuO. Phys. Rev. B 42, 10060–10066 (1990). [DOI] [PubMed] [Google Scholar]
- Suzuki M. et al. Observation of superspin-glass behavior in Fe3O4 nanoparticles. Phys. Rev. B 79, 024418 (2009). [Google Scholar]
- Wang S. Q., Zhang J. Y. & Chen C. H. Fe3O4 submicron spheroids as anode materials for lithium-ion batteries with stable and high electrochemical performance. J. Power Sources 195, 5379–5381 (2010). [Google Scholar]
- He Y. et al. Structure and electrochemical performance of nanostructured Fe3O4/carbon nanotube composites as anodes for lithium ion batteries. Electrochimica. Acta 55, 1140–1144 (2010). [Google Scholar]
- Gurlo A. & Riedel R. In situ and operando spectroscopy for assessing mechanisms of gas sensing. Angew. Chem., Int. Ed. 46, 3826–3848 (2007). [DOI] [PubMed] [Google Scholar]
- Law M. et al. Photochemical sensing of NO2 with SnO2 nanoribbon nanosensors at room temperature. Angew. Chem., Int. Ed. 114, 2511–2514 (2002). [DOI] [PubMed] [Google Scholar]
- Zhang J. et al. Nearly monodisperse Cu2O and CuO nanospheres: preparation and applications for sensitive gas sensors. Chem. Mater. 18, 867–871 (2006). [Google Scholar]
- García-Tamayo E. et al. J. Power Sources 196, 6425–6432 (2011). [Google Scholar]
- Wang F. et al. Co3O4 nanowires as high capacity anode materials for lithium ion batteries. J. Alloys Compd. 509, 9798–9803 (2011). [Google Scholar]
- Debart A. et al. A transmission electron microscopy study of the reactivity mechanism of tailor-made CuO particles toward lithium. J. Electrochem. Soc. 148, A1266–A1274 (2001). [Google Scholar]
- Ke F. S. et al. One-step fabrication of CuO nanoribbons array electrode and its excellent lithium storage performance. Electrochim. Acta 54, 5825–5829 (2009). [Google Scholar]
- Laruelle S. et al.On the Origin of the Extra Electrochemical Capacity Displayed by MO/Li Cells at Low Potential. J. Electrochem. Soc. 149, A627–A634 (2002). [Google Scholar]
- Zhang D. W., Yi T. H. & Chen C. H. Cu nanoparticles derived from CuO electrodes in lithium cells. Nanotechnology 16, 2338 (2005). [DOI] [PubMed] [Google Scholar]
- Balaya P., Li H., Kienle L. & Maier J. Reversible Homogeneous and Heterogeneous Li Storage in RuO2 with High Capacity. Adv. Funct. Mater. 13, 621–625 (2003). [Google Scholar]
- Maier J. Nanoionics: ion transport and electrochemical storage in confined systems. Nat. Mater. 4, 805–815 (2005). [DOI] [PubMed] [Google Scholar]
- Dèbart A. et al. A transmission electron microscopy study of the reactivity mechanism of tailor-made CuO particles toward lithium. J. Electrochem. Soc. 148, A1266–A1274 (2001). [Google Scholar]
- Xiang J. Y. et al. Electrochemical impedance analysis of a hierarchical CuO electrode composed of self-assembled nanoplates. J. Phys. Chem. C 115, 2505–2513 (2011). [Google Scholar]
- Xu Y. H., Guo J. C. & Wang C. S. Sponge-like porous carbon/tin composite anode materials for lithium ion batteries. J. Mater. Chem. 22, 9562–9567 (2012). [Google Scholar]
- Hassan M. F. et al. Solvent-assisted molten salt process: A new route to synthesise α-Fe2O3/C nanocomposite and its electrochemical performance in lithium-ion batteries. Electrochim. Acta 55, 5006–5013 (2010). [Google Scholar]
- Grugeon S. et al. An update on the reactivity of nanoparticles Co-based compounds towards Li. Solid State Sci. 5, 895–904 (2003). [Google Scholar]
- Jin S., Zhu X. & Qian Y. Copper Oxide Hierarchical Microspheres Grown on Copper Foil and Their Enhanced Performance as Anodes for Li-ion Batteries. Int. J. Electrochem. Sci. 9, 2859–2866 (2014). [Google Scholar]
- Martin L. et al. Direct observation of important morphology and composition changes at the surface of the CuO conversion material in lithium batteries. J. Power Sources 248, 861–873(2014). [Google Scholar]
- Zhao N. H. et al. Preparation of nanowire arrays of amorphous carbon nanotube-coated single crystal SnO2. Chem. Mater. 20, 2612–2614 (2008). [Google Scholar]
- Waser O. et al. Size controlled CuO nanoparticles for Li-ion batteries. J. Power Sources 241, 415–422 (2013). [Google Scholar]
- Feng L. et al. Preparation of octahedral CuO micro/nanocrystals and electrochemical performance as anode for lithium-ion battery. J. Alloys Compd. 600, 162–167 (2014). [Google Scholar]
- Lebedeva N. P., Koper M. T. M., Feliu J. M. & Van Santen R. A. Role of crystalline defects in electrocatalysis: Mechanism and kinetics of CO adlayer oxidation on stepped platinum electrodes. J. Phys. Chem. B 106, 12938–12947 (2002). [Google Scholar]
- Zhang D. Q. et al. Microwave-induced synthesis of porous single-crystal-like TiO2 with excellent lithium storage properties. Langmuir 28, 4543–4547 (2012). [DOI] [PubMed] [Google Scholar]
- Chen J. S., Liu H., Qiao S. Z. & Lou X. W. Carbon-supported ultra-thin anatase TiO2 nanosheets for fast reversible lithium storage. J. Mater. Chem. 21, 5687–5692 (2011). [Google Scholar]
- Hu Y. S., Kienle L., Guo Y. G. & Maier J. High Lithium Electroactivity of Nanometer-Sized Rutile TiO2. Adv. Mater. 18, 1421–1426 (2006). [Google Scholar]
- Anisimov V. I., Zaanen J. & Andersen O. K. Band theory and Mott insulators: Hubbard U instead of Stoner I. Phys. Rev. B 44, 943 (1991). [DOI] [PubMed] [Google Scholar]
- Perdew J. P. & Zunger A. Self-interaction correction to density-functional approximations for many-electron systems. Phys. Rev. B 23, 5048 (1981). [Google Scholar]
- Vanderbilt D. Soft self-consistent pseudopotentials in a generalized eigenvalue formalism. Phys. Rev. B 41, 7892 (1990). [DOI] [PubMed] [Google Scholar]
- Wang L., Maxisch T. & Ceder G. Oxidation energies of transition metal oxides within the GGA+ U framework. Phys. Rev. B 73, 195107 (2006). [Google Scholar]
- Yang T. et al. Highly ordered self-assembly with large area of Fe3O4 nanoparticles and the magnetic properties. J. Phys. Chem. B 109, 23233–23236 (2005). [DOI] [PubMed] [Google Scholar]
Associated Data
This section collects any data citations, data availability statements, or supplementary materials included in this article.
Supplementary Materials
Supporting Information for CuO single-crystal with exposed X001X facets - A highly efficient material for gas sensing and Li-ion battery applications


