Abstract
Modeling the dynamics of cell population in tissues involving stem cell niches allows insight into the control mechanisms of the important wound healing process. It is well known that growth and divisions of stem cells are mainly repressed by niche cells, but can also be activated by signals released from wound. In addition, the proliferation and differentiation among three different types of cell: stem cells (SCs), intermediate progenitor cells (IPCs), and fully differentiated cells (FDCs) in stem cell lineage are under different activation and inhibition controls. We have developed a novel stochastic spatial dynamic model of cells. We can characterize not only overall cell population dynamics, but also details of temporalspatial relationship of individual cells within a tissue. In our model, the shape, growth, and division of each cell are modeled using a realistic geometric model. Furthermore, the inhibited growth rate, proliferation and differentiation probabilities of individual cells are modeled through feedback loops controlled by secreted factors and wound signals from neighboring cells. With specific proliferation and differentiation probabilities, the actual division type that each cell will take is chosen by a Monte Carlo sampling process. With simulations, we study the effects of different strengths of wound signals to wound healing behaviors. We also study the correlations between chronic wound and cancerogenesis.
I. INTRODUCTION
Wound healing is a complex process but poorly understood. It relates not only directly to restoring health, but also broadly to many diseases, including cancer [1, 2]. It is well know that stem cell niche and stem cell lineage play important roles in the process of wound healing [1]. Computational models of cell population dynamics can provide insights into the control process of tissue regeneration and wound healing.
It is well know that the growth, division and differentiation of stem cells depends strongly on the microenvironment where stem cells reside, which is also known as the stem cell niche. One of the most important role of the niche cells is to help maintain the stem cell property by repressing cell division and differentiation [3, 4]. However, once a stem cell leaves the niche, it will have much higher chances to differentiate into progenitor cells and fully differentiated cells [3], which is what happens when wound healing occurs. It is also known that proliferation and differentiation among different types of cells in the stem cell lineage, including stem cells (SCs), intermediate progenitor cells (IPCs), and fully differentiated cells (FDCs), are under different activation and inhibition controls [5–8]. Secreted factors in negative feedback loops have already been identified as major elements in regulating the numbers of different cell types and in maintaining the equilibrium of cell populations [5, 9]. There have been a number of mathematical models for studying different aspects of the wound healing process [10– 12]. However the dynamics and critical roles of stem cell lineages remains unclear.
We have developed a novel spatial dynamic cell growth model to study the dynamic behaviors of stem cell lineage during wound healing process. We can characterize not only the overall cell population dynamics, but also details of temporal-spatial relationship of individual cells. In our model, the shape, growth, and division of each cell are modeled using a realistic geometric model, and the inhibited growth rate, proliferation and differentiation probabilities of individual cells are modeled through feedback loops controlled by secreted factors of neighboring cells within a proper diffusion radius. With specific proliferation and differentiation probabilities, the actual division type that each cell will take is modeled by a Monte Carlo sampling procedure. We found that with proper strengths of inhibitions to growth and self-renewal of stem cells, and proper strength of activation signals from the wound locale to stem cells, cells lost upon wound infliction can be replenished and the tissue can reach a new homeostasis. However, wound signal of inappropriate magnitude can also lead to incomplete or over-recovery. Our results also suggest potential connections between chronic wounds and cancerogenesis.
II. METHODS
In our model, the growth, division and decision making of specific division type of cells are modeled explicitly. Cell growth is modeled based on the underlying physics. Cell growth rate and probabilities of three division types are determined by the number of differentiated cells within a proper diffusion radius around each cell.
A. Cell Growth Model
We use two-dimensional mechanical vertex model to represent a tissue of contiguous, interacting cells [13]. This model represents accurately the geometric properties of a single cell as well as the collective topological properties of cells in a tissue. More details of the model can be found in ref. [13, 14].
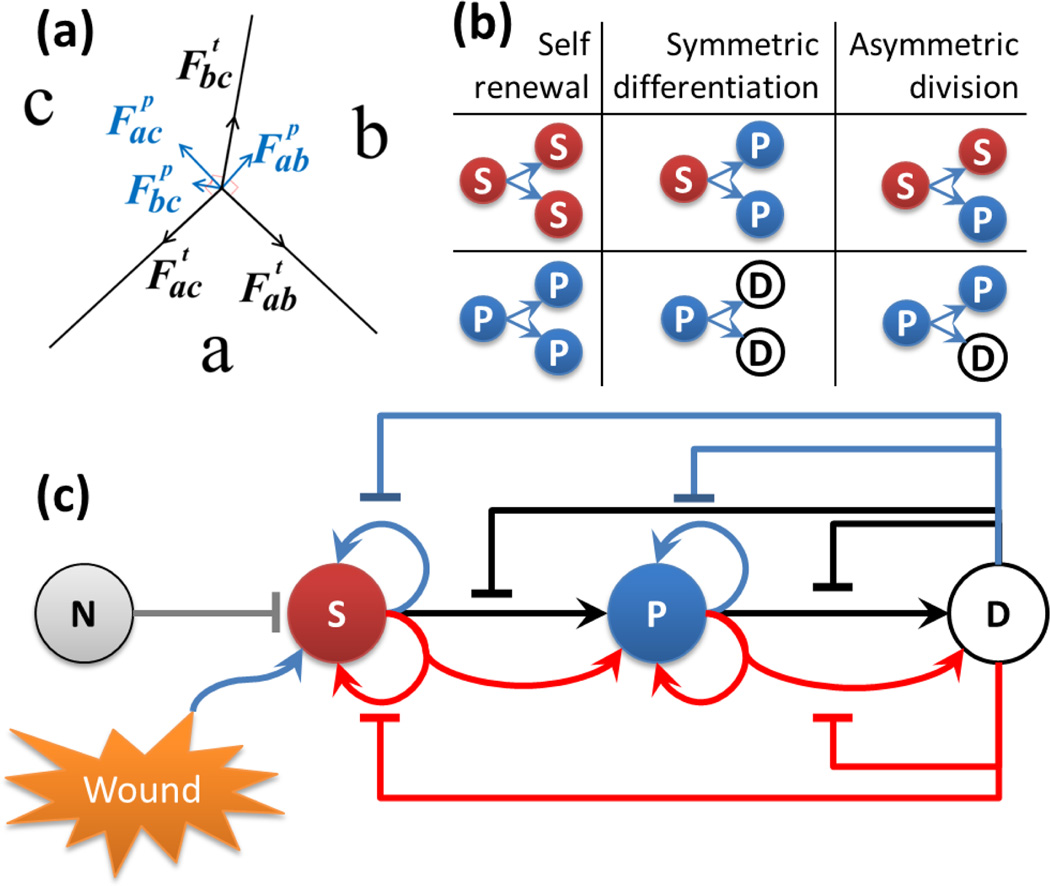
In our model, cell movement and rearrangement within a tissue depend on the mechanical forces a cell experiences. There are two types of forces in our model, tension and pressure. Tension models the compressional forces acting within a cell. These forces arise from cytoskeletal microfilaments, intermediate filaments, and cell membrane. For an edge between cell a and b, the direction of the tension force is tangential to the edge ab (Fig. 1(a)). Pressure represents the forces resisting compression. These forces arise mainly from microtubules and extracellular matrix. In our model, pressure is proportional to the difference in pressure in neighboring cells.
Fig.1.
Our model. (a) The forces at the junction vertex of three cells a, b and c in our cell growth model. Tension is tangential to the edge (black). Pressure is normal to the edge (blue). The net force on the junction vertex is obtained by summing tension and pressure acting on the vertex. (b) Division types of stem cells and progenitor cells. Red sphere labeled with (S) indicates stem cells, blue sphere (P) indicates progenitor cells, and white sphere (D) indicates differentiated cell. The same color code is used for illustration of resulting tissues. (c) Feedback controls of stem cell lineage. The gray (N) sphere indicates niche cells. Blue arrows indicate self-renewal or proliferation divisions. Black arrows indicate symmetric divisions. Red arrows indicate asymmetric divisions. Flat-head arrows extending from differentiated cell with corresponding colors indicate inhibitions to respective type of divisions.
Non-zero net force drives a vertex to a new location and the cell shape changes with the vertex movements. Local rearrangements of vertices result in reduction of the stress in the tissue, which lead the system to a lower stress state.
Cell division occurs when the size of the cell is doubled after certain steps of cell growth. A new cell wall is added that passes through the center of the mother cell. The two resulting daughter cells have half the size of the mother cell.
B. Cell Types and Division Types
Four different types of cells are modeled in our system: niche cells, stem cells, progenitor cells and differentiated cells. For simplification, niche cells do not grow and divide, but can repress the growth and division of stem cells (Fig. 1(c)). The other cell types have different cell division potentials: stem cells have unlimited division power; intermediate progenitor cells can divide at most twice; and differentiated cells lose the ability of division. Stem cells and progenitor cells can undergo three different types of divisions: [6, 15, 16]: (1) self-renewal or proliferation generates two daughter cells identical to the mother cell, (2) symmetric differentiation generates two identical daughter cells of next lineage stage, and (3) asymmetric division generates two different daughter cells, with one identical to the mother cell and the other of next lineage stage (Fig. 1(b)). Note that as progenitor cells can maximally divide twice, the type of second division of progenitor cells is limited to symmetric differentiation.
C. Feedback Controls
In our model, the growth rates and different division types of stem cells are inhibited independently by surrounding differentiated cells within a specific diffusion radius and by directly attached niche cells. To reflect the repression role of niche cells, we assume stem cells have a probability of pSQ = 0.95 to stay in quiescent state when attached to one of the niche cells, but the quiescence probability drops to pSQ = 0.01 when no niche cell attached. Following [6], we use Hill functions shown in Eqn. (1) to calculate the growth rates and division probabilities of different types of cells at each time step. We assume a basal growth rate and for stem cells, progenitor cells and differentiated cells, respectively, the basal probabilities of three division types are assigned to be equal: for stem cells and for progenitor cells. The growth rate vS(t) of stem cells, vP(t) of progenitor cells and probabilities of self-renewal pSr(t), symmetric pSs(t) and asymmetric pSa(t) divisions of stem cells and pPr(t), pPs(t) and pPa(t) of progenitor cells at time t are calculated as:
| (1) |
where ND(t) is the number of differentiated cells within three layers of neighboring cells, Nwd is the number of wound cells releasing wound signals in the three layers of neighboring cells, and Nniche is the number of niche cells in the direct neighbor of the stem cell. Hill coefficients gS, gP, hSr, hSs, hSa, hPr, hPs and hPa are assumed to be time-invariant, and used to model intrinsic cell properties and control growth rates and division probabilities of stem cells and progenitor cells, respectively. Parameter AWH is used to model the strength of the wound signal. After the new probabilities of division types are calculated, they are normalized to ensure the probabilities of three division types sum to 1.0 for progenitor cells, and 1− pSQ for stem cells. A Monte Carlo sampling step is implemented for selecting the division type based on probabilities for each dividing stem cell and progenitor cell. A uniform random number μ ∈ [0, 1] is generated at each step, and the division type is determined by the minimum value of K satisfying inequality: , in which values of i,K ∈ {1,2,3} correspond to division types: self-renewal (i, K = 1), symmetric differentiation (i, K = 2), and asymmetric division (i, K = 3), respectively.
The growth rates and division types obtained from feedback control module are used as input for cell growth. Therefore, the feedback circuits are coupled with cell growth to model more realistically the dynamics of stem cell lineage populations (Fig. 1(c)).
III. RESULTS
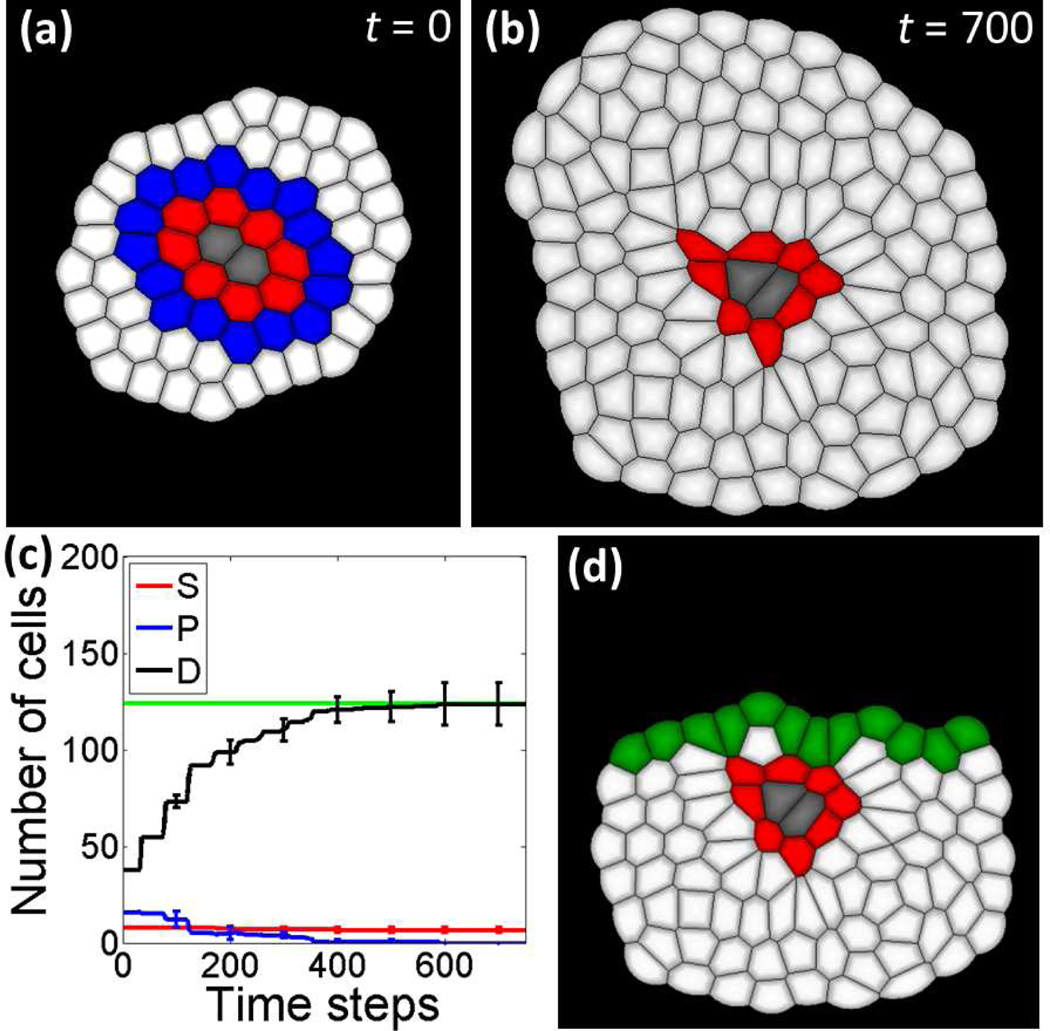
We first grow a normal tissue starting from a small group of 64 cells (2 niche cells (gray) in the center, 8 stem cells (red) surrounded by 16 progenitor cells (blue) and 38 differentiated cells (white)), as shown in Fig. 2(a). Heuristically, we found that the tissue is able to achieve homeostatic size control (Fig. 2(b) and (c)) when model parameters are gS = 0.35, gP = 0.01, hSr = 0.1, hSs = 9.0, hSa = 9.0, hPr = 0.2, hPs = 0.1 and hPa = 0.1, respectively. The size of the whole tissue stops changing, and stem cells are repressed in the quiescent state by niche cells in direct neighbors and by surrounding differentiated cells. The resulting tissue contains 120 differentiated cells and 8 stem cells attached to 2 niche cells.
Fig.2.
Normal tissue and wound infliction. (a) Small starting cell group for simulations of the temporal-spatial dynamics model contains 64 cells. Niche cells are labeled in gray, stem cells are in red, progenitor cells are in blue, and differentiated cells are in white. (b) One example normal tissue achieved homeostatic size control. This steady state tissue contains 8 stem cells, 2 niche cells and 120 differentiated cells. (C) Dynamics of cell numbers during tissue development. The red curve shows the dynamics of stem cell numbers, the blue line is progenitor cells, and the black line is differentiated cells. Error bars show the standard deviations at 100, 200, 300, 400, 500, 600 and 700 time steps are calculated from four independent simulations, respectively. The average number of differentiated cells in the steady state is shown in the green straight line. (d) Wound infliction is created by cut the top part of the normal tissue in (b). Cells at the wound edge are shown in green.
To study the wound healing process, a wound tissue (Fig. 2(d)) is created by removing the top part (40 differentiated cells) from the normal tissue in Fig. 2(b). Cells on the edge of wound are labeled in green, indicating wound healing signals are released from them to activate the growth and differentiation of stem cells in the niche to replenish those removed cells (Fig. 2(d)).
A. Wound healing by different strengths of wound signals
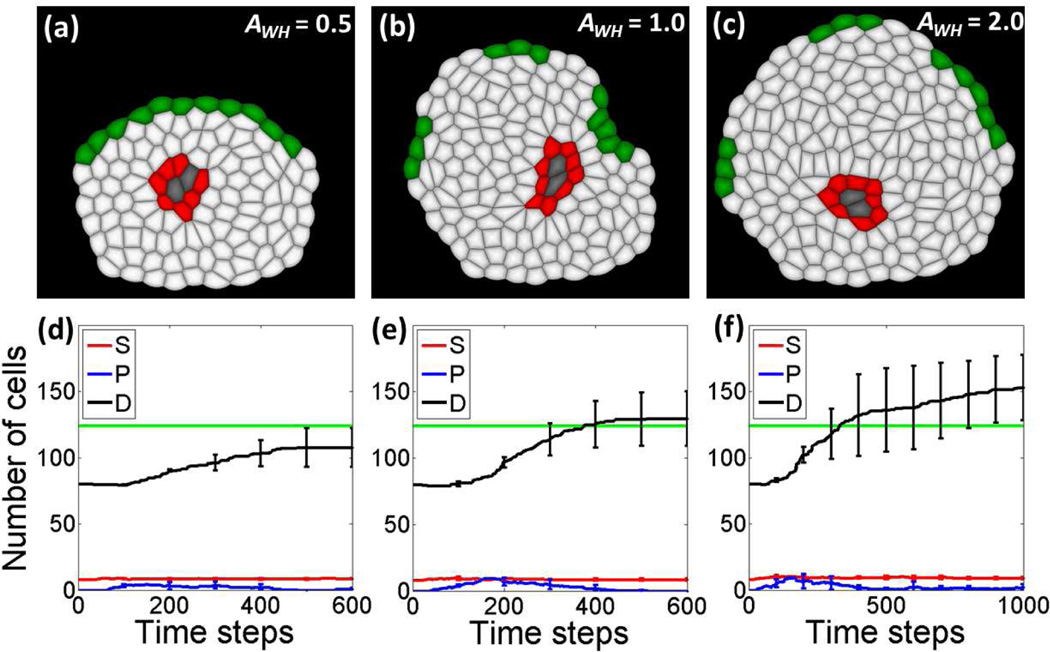
The wound healing processes are simulated starting upon the initial wound infliction. Three different strengths of wound signals AWH = 0.5, AWH = 1.0 and AWH = 2.0 are used respectively to study their effects to wound healing results. The resulting recovered tissues and the corresponding dynamics curves of cell numbers are shown in Fig. 3.
Fig.3.
Wound healing results with different strengths of wound signal AWH. (b) and (e) Normal wound healing results with AWH = 1.0. (a) and (d) Incomplete wound healing by a weak wound signal AWH = 0.5. (c) and (f) Stronger wound signal of AWH = 2.0 leads to an over-recovery, which may be related to abnormal wound healing like keloids.
In our model, simulations with parameter AWH = 1.0 can be regarded as the wound healing process of normal tissues (Fig. 3(b) and (e)). From the dynamic curves in Fig. 3(e), there is a small increase in stem cell numbers (red curve in Fig. 3(e)) around time step 100 after wound infliction, indicating that the growth and self-renewal of stem cells inside the niche are activated by the wound signals released from the cells on wound edge. Once stem cells are detached from the niche cells due to growth and division, they will differentiate into intermediate progenitor cells, which further become fully differentiated cells. This three-step process of stem cell lineage amplification is shown by the bump in the number of progenitor cells around time step 200 (blue curve in Fig. 3(e)), and the subsequent significant increase in the number of differentiated cells (black curve in Fig. 3(e)). When removed cells in the wound are replenished, wound signals from wound edge are decreased to zero, along with the progress of the regeneration process, the repression to stem cells is recovered and the whole tissue stops growing. One example resulting tissue of normal wound healing from the wound in Fig. 2(d) is shown in Fig. 3(b). Although the shape is different from the original tissue (Fig. 2(b)), the size of the whole tissue is recovered (Fig. 3(e)).
To study the effects of different strengths of wound signals, we further perform simulations with AWH = 0.5 and AWH = 2.0, respectively, and the results are shown in Fig. 3(a) and (d), and Fig. 3(c) and (f), respectively. Compared with normal wound healing, results from weaker wound signals AWH = 0.5 produce much smaller recovered tissue (Fig. 3(a)), and the number of differentiated cells does not recover to the level in the original tissue (Fig. 3(d)). With a stronger wound signal AWH = 2.0, the resulting tissue (Fig. 3(c)) and the number of regenerated differentiated cells (Fig. 3(f)) are much more than those of the original tissue, which may be related to abnormal wound healing, such as found in the keloid formation [17].
B. Effects of prolonged wound signals
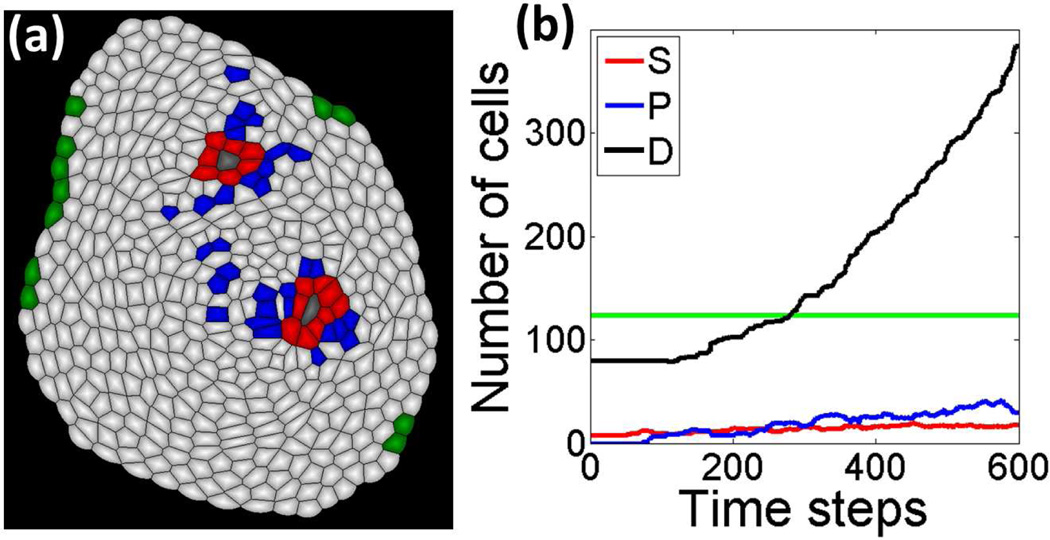
To study the effects of prolonged wound signals and the potential relations between unregulated wound healing and cancerogenesis, we examine the effects of persistent wound signals, in which the activation to stem cell growth and division is not reduced and turned off as wound healing proceeds. A snapshot and dynamics curves of cell numbers from our simulation results are shown in Fig. 4. Overall, the wounded tissue does not stop growing due to the persistent activation of stem cells by wound signals (Fig. 4(b)). This mechanism may relate to cancerogenesis in the case of chronic wound [1].
Fig.4.
Deregulated wound healing and cancerogenesis. (a) A snapshot of simulations in tissue with deregulated wound signals. (b) The dynamics of numbers of different types of cells.
IV. DISCUSSIONS AND CONCLUSIONS
Wound healing process has been theoretically modeled using continuous and deterministic modeling methods based on partial differential equations (PDE) [10–12]. A novel temporal-spatial cell population dynamics model has been developed to realistically model wound healing by combining a realistic cell growth model [13] with the population dynamics of stem cell niche and lineages [14]. The geometries and forces for cell growth and divisions are incorporated in the cell growth model, and the growth rates and division types after receiving inhibitions from surrounding differentiated cells are modeled individually in negative feedback controls. The stochastic choice of division types is modeled through a Monte Carlo sampling process. In our wound healing model, stem cells growth can be activated by wound signals, and stem cell divisions are highly regulated by niche cells.
Simulation results show that in normal case of wound healing, cells lost from wound infliction can be largely replenished by the activated stem cell lineage in the niche. The regeneration is stopped when the healing process is complete and wound signals are dissipative. We also studied the effects of different strengths of wound signals to wound healing behaviors. Our results show that weaker wound signal will lead to an incomplete wound healing, whereas stronger wound signal will cause an over-recovery, which may be related to abnormal wound healing such as keloid formation. We also studied the effects of persistent wound signals, demonstrating that the wound tissue does not stop regenerating new cells, which may result in tumor tissues. Our method can be used to study broad issues in stem cell biology, cancer biology and developmental biology.
ACKNOWLEDGMENT
This work was supported by NSF DBI 1062328 and DMS-0800257, and NIH GM079804 and GM086145.
Contributor Information
Youfang Cao, Email: youfang at uic.edu, Department of Bioengineering, University of Illinois at Chicago, Chicago, IL, USA.
Hammad Naveed, Email: hammadnaveed at yahoo.com, Department of Bioengineering, University of Illinois at Chicago, Chicago, IL, USA.
Claire Liang, Email: cliang at imsa.edu, Illinois Math and Science Academy, Aurora, IL, USA.
Jie Liang, Email: jliang at uic.edu, Department of Bioengineering, University of Illinois at Chicago, Chicago, IL, USA.
References
- 1.Arwert EN, Hoste E, Watt FM. Epithelial stem cells, wound healing and cancer. Nature Reviews Cancer. 2012;12(3):170–180. doi: 10.1038/nrc3217. [DOI] [PubMed] [Google Scholar]
- 2.Boehnke K, Falkowska-Hansen B, Stark HJ, Boukamp P. Stem cells of the human epidermis and their niche: composition and function in epidermal regeneration and carcinogenesis. Carcinogenesis. 2012;33(7):1247–1258. doi: 10.1093/carcin/bgs136. [DOI] [PubMed] [Google Scholar]
- 3.Fuchs E, Tumbar T, Guasch G. Socializing with the neighbors: stem cells and their niche. Cell. 2004;116(6):769–778. doi: 10.1016/s0092-8674(04)00255-7. [DOI] [PubMed] [Google Scholar]
- 4.Wilson A, Laurenti E, et al. Hematopoietic stem cells reversibly switch from dormancy to self-renewal during homeostasis and repair. Cell. 2008;135(6):1118–1129. doi: 10.1016/j.cell.2008.10.048. [DOI] [PubMed] [Google Scholar]
- 5.Lander AD. Pattern, Growth, and Control. Cell. 2011 Mar 18;144:955–969. doi: 10.1016/j.cell.2011.03.009. [DOI] [PMC free article] [PubMed] [Google Scholar]
- 6.Lander AD, Gokoffski KK, Wan FYM, Nie Q, Calof AL. Cell Lineages and the Logic of Proliferative Control. PLoS Biology. 2009 Jan;7:e1000015. doi: 10.1371/journal.pbio.1000015. [DOI] [PMC free article] [PubMed] [Google Scholar]
- 7.Lo WC, Chou CS, Gokoffski KK, Wan FY-M, Lander AD, Calof AL, Nie Q. Feedback regulation in multistage cell lineages. Mathematical Biosciences and Engineering. 2009;6(1):59–82. doi: 10.3934/mbe.2009.6.59. [DOI] [PMC free article] [PubMed] [Google Scholar]
- 8.Christley S, Lee B, Dai X, Nie Q. Integrative multicellular biological modeling: a case study of 3D epidermal development using GPU algorithms. BMC Systems Biology. 2010;4:107. doi: 10.1186/1752-0509-4-107. [DOI] [PMC free article] [PubMed] [Google Scholar]
- 9.Wu HH, Ivkovic S, Murray RC, Jaramillo S, Lyons KM, Johnson JE, Calof AL. Autoregulation of neurogenesis by GDF11. Neuron. 2003;37(2):197–207. doi: 10.1016/s0896-6273(02)01172-8. [DOI] [PubMed] [Google Scholar]
- 10.Cumming BD, McElwain DLS, Upton Z. A mathematical model of wound healing and subsequent scarring. Journal of The Royal Society Interface. 2010;7(42):19–34. doi: 10.1098/rsif.2008.0536. [DOI] [PMC free article] [PubMed] [Google Scholar]
- 11.Xue C, Friedman A, Sen CK. A mathematical model of ischemic cutaneous wounds. Proceedings of the National Academy of Sciences. 2009;106(39):16782–16787. doi: 10.1073/pnas.0909115106. [DOI] [PMC free article] [PubMed] [Google Scholar]
- 12.Menon SN, Flegg JA, et al. Modelling the interaction of keratinocytes and fibroblasts during normal and abnormal wound healing processes. Proceedings of the Royal Society B: Biological Sciences. 2012;279(1741):3329–3338. doi: 10.1098/rspb.2012.0319. [DOI] [PMC free article] [PubMed] [Google Scholar]
- 13.Naveed H, Li Y, Kachalo S, Liang J. Geometric Order in Proliferating Epithelia: Impact of Rearrangements and Cleavage Plane Orientation; Conf Proc IEEE Eng. Med. Biol. Soc; 2010. pp. 3808–3811. [DOI] [PMC free article] [PubMed] [Google Scholar]
- 14.Cao Y, Liang C, et al. Modeling spatial population dynamics of stem cell lineage in tissue growth; Conf Proc IEEE Eng. Med. Biol. Soc; 2012. pp. 5502–5505. [DOI] [PMC free article] [PubMed] [Google Scholar]
- 15.Roeder I, Lorenz R. Asymmetry of stem cell fate and the potential impact of the niche. Stem Cell Reviews and Reports. 2006;2(3):171–180. doi: 10.1007/s12015-006-0045-4. [DOI] [PubMed] [Google Scholar]
- 16.Götz M, Huttner WB. The cell biology of neurogenesis. Nature Reviews Molecular Cell Biology. 2005;6(10):777–788. doi: 10.1038/nrm1739. [DOI] [PubMed] [Google Scholar]
- 17.Singer AJ, Clark RA. Cutaneous wound healing. New England journal of medicine. 1999;341(10):738–746. doi: 10.1056/NEJM199909023411006. [DOI] [PubMed] [Google Scholar]


