

Abstract
Alcohol dependence (AD) is a moderately heritable phenotype with a small number of known risk genes mapped via linkage or candidate gene studies. We considered 313 males from among 600 members of documented, extended pedigrees in which AD segregates collected in Northern Hunan Province, China. A joint analysis of both males and females could not be performed as the difference in alcohol consumption variance was too large. Genome-wide association analyses were performed for approximately 300,000 single nucleotide polymorphisms (SNPs). Significant associations found in the ALDH2 region for AD (minimum p = 4.73×10⁻⁸) and two AD-related phenotypes: flushing response (minimum p = 4.75×10⁻²⁶) and maximum drinks in a 24-hour period (minimum p = 1.54×10⁻¹⁶). Association of previous candidate SNP, rs10774610 in CCDC63, was confirmed but resulted from linkage disequilibrium with ALDH2. ALDH2 is strongly associated with flushing response, AD, and maximum drinks in males, with nonsynonymous SNP rs671 explaining 29.2%, 7.9% and 22.9% of phenotypic variation, respectively, in this sample. When rs671 was considered as a candidate SNP in females, it explained 23.6% of the variation in flushing response, but alcohol consumption rates were too low among females – despite familial enrichment for AD – for an adequate test of association for either AD or maximum drinks. These results support a mediating effect of aldehyde dehydrogenase deficiency on alcohol consumption in males and a secondary, culturally-mediated limitation on alcohol consumption by females that should be appropriately modeled in future studies of alcohol consumption in populations where this may be a factor.
Keywords: Alcohol Dependence, Maximum Drinks, Flushing Response, Genome-Wide Association, Aldehyde Dehydrogenase
Introduction
Alcohol dependence (AD) is a moderately heritable disorder for which two major families of risk genes have been mapped via linkage and candidate gene association studies: the alcohol dehydrogenase (ADH) family, which contributes to variation in speed of ethanol metabolism and yields a variable concentration of acetaldehyde following alcohol consumption; and the aldehyde dehydrogenase (ALDH) gene family, which mediates acetaldehyde clearance (Edenberg 2007; Li et al. 2011, 2012a, 2012b). Genes in the latter family, primarily ALDH2, are associated with the flushing reaction seen in some East Asian populations (Thomasson et al. 1993). These variants have substantial public health importance beyond their relationship to flushing and AD, as acetaldehyde exposure is also a key risk factor for gastrointestinal tract neoplasms (Mikko 2012) and the flushing response itself is a indicator of esophageal cancer risk (Brooks et al. 2009). While these two gene families have been the focus of many studies, there remains significant unexplained genetic variation in AD.
Genome-wide association studies (GWAS) have been successful at identifying risk genes for complex traits, but largely unsuccessful in identifying major risk loci. One contributing factor is the reliance on diagnosis – a dichotomous phenotype – rather than continuous phenotypes, which have greater statistical power and may be better correlated with the underlying genetic risk. Furthermore, GWAS have been conducted almost exclusively in samples of European ancestry, which risks missing variants at very low frequency in European populations. We address these two issues in the present study by considering additional phenotypes related to AD risk – flushing response and the maximum number of standardized drinks consumed in a 24-hour period – in a Chinese population underrepresented in GWAS. Flushing response (and the associated negative physical symptoms that occur in the presence of high acetaldehyde concentrations) is an intermediate phenotype that appears to mediate the volume of alcohol an individual can consume comfortably. Because this phenotype is most common in East Asian populations, occurring in nearly 40% of individuals in the present study but less than 10% of Europeans (Whitfield and Martin 1996), its potential influence is enhanced by this sample selection, while unlikely to play a major role in populations of European or African biogeographic ancestry. “Maximum drinks” is a continuous measure that is highly correlated with AD (Dick et al. 2006; Grant et al. 2009; Kendler et al. 2010; Dick et al. 2011). Its inclusion increases power by giving meaningful values for individuals without AD and a useful range among those with the disorder.
We present here a GWAS of these three traits in a relatively isolated Han Chinese population from Northern Hunan. Due to the combination of physical isolation and low geographic mobility, a large number of related individuals are found in a small region. Such isolated populations may facilitate considerably the identification of susceptibility alleles for complex traits for at least three main reasons: greater linkage disequilibrium (LD) facilitating locus detection even with less-dense GWAS arrays, greater genetic homogeneity resulting from founder effects and/or population bottlenecks, and reduced environmental heterogeneity resulting from a greater degree of shared geographic and cultural factors. This is particularly relevant for studies of AD, where consistency of exposure across the sample is an important factor (Gulcher et al. 2001; Ober et al. 1998; Peltonen et al. 2000). We addressed an important deviation from consistency of exposure between males and females by focusing the analysis on men. The primary limitation of this overall approach is that risk variants (and perhaps genes) underlying disease susceptibility in a specific population or family may not be the same as those contributing to vulnerability in other populations. However, this is also an argument in favor of including more non-European populations in GWAS to understand more fully the genetic risk factors for AD.
Materials and Methods
Sample Recruitment
From an initial proband diagnosed with AD, we identified members of a set of extended pedigrees in which AD segregates living in a relatively isolated region of Northern Hunan Province, China. The study was approved by ethics committees at Hunan Normal University and the Yale University School of Medicine and written informed consent was obtained from each participant. Members of the identified set of pedigrees were interviewed locally by trained interviewers with clinical experience (XYW, TQL, and WH) using the Chinese version of the Diagnostic Interview for Genetic Studies (DIGS 2.0; Berney et al. 2002), to assess AD and related psychiatric phenotypes based on Diagnostic and Statistical Manual of Mental Disorders version IV (DSM-IV) criteria (American Psychiatric Association 2000). The DIGS was developed to ascertain psychiatric diagnoses including substance use disorders, and has been used for genetics studies of schizophrenia (Hwu et al. 2005; Tang et al. 2007) and heroin dependence (Glatt et al. 2008) in Chinese samples.
Because the DIGS does not query maximum drinks or flushing, we added two questions for the purposes of this study: “What is the largest number of alcoholic drinks you have ever consumed in a day?” and “Does your face flush after drinking a little alcohol?” (approximate back-translations from Chinese). This wording is similar, but not identical to that used to query maximum drinks in the Semi-Structured Assessment for the Genetics of Alcoholism (SSAGA) and Semi-Structured Assessment for Drug Dependence and Alcoholism (SSADDA) instruments also used in studies of alcoholism and drug dependence (Gelernter et al. 2005; Pierucci-Lagha et al. 2005; Bucholz et al. 1994). The most common form of alcohol consumed by people in this district is fortified rice wine, which is approximately 30% ethanol by volume. Drinks were calculated as equivalents of one shot of hard liquor (including fortified rice wine), one glass of wine, or one bottle of beer; however, many responses were given in the local unit “liang,” which was converted to 1.32 standard units based on volume. Demographic and phenotypic distributions of males and females in the full sample can be seen in Table 1.
Table 1. Distribution of demographic and phenotype information.
All sampled individuals are included in the counts, including those subsequently excluded from analysis due to sex or abstention from alcohol. Flush Rate and AD Rate are calculated based on of individuals who have consumed alcohol at least once.
| Male | Female | Total | |
|---|---|---|---|
| Participants | 352 | 243 | 595 |
| Age (Mean±std) | 52.0±14.7 | 55.3±15.1 | 53.3±14.9 |
| Lifetime Abstain Number | 25 | 57 | 82 |
| Abstention Rate | 7.1% | 23.4% | 13.7% |
| Flush Response Count | 124 | 74 | 198 |
| Flush Rate (%) | 37.6% | 39.7% | 38.4% |
| AD Affecteds | 117 | 5 | 122 |
| AD Rate (%) | 33.2% | 2.1% | 20.1 % |
| Max Drinks (Mean±std) | 17.3±15.3 | 7.3±5.7 | 15.3±14.5 |
Genotyping
Genomic DNA was extracted from 15 ml of peripheral blood using standard protocols in all but a small number of cases where DNA was collected from saliva samples using Oragene DNA isolation kits (DNA Genotek, Ottawa, Ontario, Canada). All samples were genotyped on the Illumina Cyto12 array version 2-1 at the Yale Center for Genome Analysis, and called in GenomeStudio software V2011.1 using genotyping module version 1.8.4 yielding 299,140 single nucleotide polymorphisms (SNPs). From the original 600 participants, 569 samples were retained with call rates of at least 97% and SNPs were removed from analysis if not successfully genotyped in at least 85% of remaining individuals. A total of 247,725 SNPs were included in the final GWA. One percent of the most highly polymorphic SNPs were used to confirm reported pedigree structure in PREST (Sun et al. 2002), resulting in 116 pedigrees ranging in size from 2 to 27 individuals with an additional 100 individuals unrelated to anyone else in the sample. Mendelian errors, detected on the basis of unshared alleles with parents and likely resulting from miscalls in the genotyping, were detected using SimWalk2 (Sobel & Lange 1996, Sobel et al. 2001, Sobel et al. 2002). Across all loci, an average of 39.4 genotypes were identified and changed to no calls so that no Mendelian errors remained in the pedigree. This represents an approximate miscall rate of 0.013%.
Two additional SNPs not present on the GWAS microarray were genotyped via TaqMan assay: rs1229984 in ADH1B and rs671 in ALDH2. Both SNPs are functional variants encoding alcohol-metabolizing enzymes known to contribute to AD risk in Asian populations. Locations are mapped to NCBI Build 36 throughout.
Genome-Wide Association
Statistical analyses were performed at Texas Biomedical Research Institute using SOLAR (Blangero & Almasy 1998), except where noted. Genome-wide analyses in SOLAR use measured genotype association, which applies a likelihood ratio test to an additive model of allelic effect while including a covariance matrix of pairwise relatedness to control for kinship. Maximum drinks was inverse normalized to a mean of zero and a standard deviation of 3 prior to analysis. As a continuous trait, maximum drinks (N = 272 males, h2 = 0.49, p = 0.002) is expected to have greater statistical power than the categorical AD trait (Almasy & Blangero 2001), with 80% power to detect variants explaining at least 13.3% of the variance. The case-control AD analysis of 102 male cases and 212 male controls (h2 = 0.46, p = 0.018) spread across 81 pedigrees has 80% power to detect variants with a genotype relative risk of 2.5. The analysis of flushing response (108 male cases, 190 male controls h2 = 0.47, p = 0.038) has 80% power to detect variants with a genotype relative risk of 2.4. Age was included as a covariate for all analyses.
Because of the substantial influence of the ALDH2 locus, genome-wide association analysis (GWA) was rerun for flushing response with rs671 genotype included as a covariate to increase power to detect other previously unknown risk variants. In addition to the GWA analysis, SNPs previously associated (genome-wide p < 5×10⁻⁷) with AD, maximum drinks or other drinking behavior in European-derived populations (Treutlein et al. 2006; Treutlein & Cichon, 2009; Heath et al. 2011; Schumann et al. 2011) and/or East Asian populations (Wang et al. 2008; Takeuchi et al. 2011; Wang et al. 2012; Chen et al. 2012) were examined for association in this sample.
Results
Because the pedigrees were ascertained based on AD probands, the participant pool is significantly enriched for AD (Table 1), with both males and females showing greater levels of AD than a randomly ascertained sample in which approximately 6.6% of males and 0.1% of females would be expected to be alcohol dependent (Hao et al. 2004; Cochrane et al. 2013).
Although males generally exhibit higher levels of AD, the difference in both mean and variance of maximum drinks between the sexes and the presence of only five affected women in the sample led us to consider only males in the primary analyses. Of the 127 women queried, 41% reported never having consumed a single drink, contributing to a variance in maximum drinks among females of 32.4, compared to 122.8 among males. Distribution of maximum drinks by sex can be seen in Supplemental Figure 1. The magnitude of the sex-based differences in AD, maximum drinks, and lifetime abstention rates – despite high levels of alcohol consumption by some male family members – suggests that cultural factors may differentially influence drinking behavior by sex. The similarity in flushing rate (36.9% among males and 37.3% among females), a phenotype mediated entirely by biological factors, supports an environmental (i.e. cultural) explanation for the substantially lower rate and magnitude of drinking by women. Additionally, the heritability of maximum drinks and AD in males are 0.49 and 0.46, respectively, but non-significant in females, further reinforcing that, in this population, the proportion of variance in drinking behaviors explained by additive genetic variance is greater in males than in females.
Genome-Wide Association
AD, flushing response, and maximum drinks all show multiple significant associations in males in the region of chromosome 12 containing aldehyde dehydrogenase gene, ALDH2. At genome-wide significance threshold α = 5×10⁻⁸, two SNPs were associated with AD with minimum p = 4.73×10⁻⁸, eight SNPs are associated with maximum drinks with minimum p = 1.54×10⁻¹⁶, and 12 SNPs are associated with flushing response with minimum p = 4.75×10⁻²⁶. In all cases, the strongest association in the region was for rs671, a SNP causing a glutamate to lysine substitution in ALDH2. Figure 1 shows Manhattan plots of the association results for each of the phenotypes. There is evidence of slight over-dispersion in the chi-square statistics for each phenotype (λ = 1.03-1.04, see Supplemental Figure 2 for q-q plots) and Table 2 lists both the raw p-values and those adjusted for genomic inflation by multiplying the raw value by λ. Results for the top 1000 associations for each trait can be found in Supplemental Table 1. With the inclusion of the rs671 genotype as a covariate, there were no significant associations with any other loci, consistent with ALDH2 mediating a substantial proportion of the variation in Chinese males for all of these phenotypes. rs671 explains 7.9% of the variation in AD (17.2% of the genetic variation), 22.9% (47.0%) in maximum drinks, and 29.2% (62.0%) in flushing response in this sample. However, since these estimates were calculated in the discovery sample, they are likely to be inflated due to the so-called “winner’s curse” (Göring et al. 2001). Although known functional mutation rs671 was found to be significantly associated with all phenotypes under consideration, rs1229984 in ADH1B was not significantly associated (p > 0.1) with any phenotype.
Figure 1. Manhattan plots of GWA results.
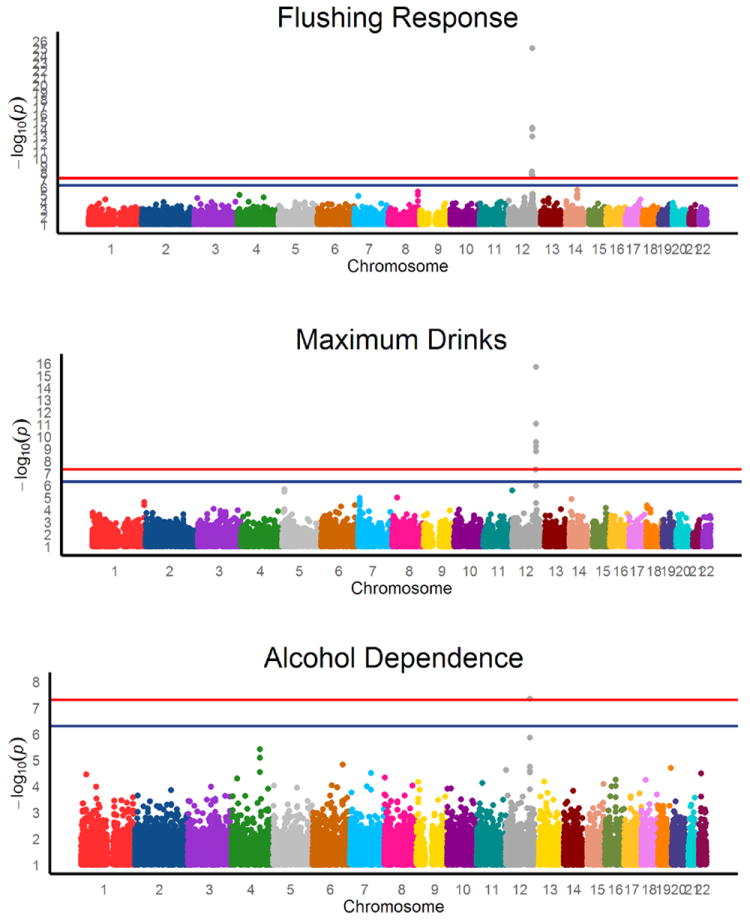
Horizontal lines represent the genome-wide significant (p < 5e-8) and suggestive (p < 5e-7) association thresholds and are held constant across the differing y-axes.
Table 2. Significant Genome-Wide Associations.
P-values are listed both raw and corrected for genomic inflation.
| rsID | Chr | Position | Trait | p-value | Corrected p | β |
|---|---|---|---|---|---|---|
| rs16940688 | 12 | 108844704 | Flush Response | 5.90×10⁻⁹ | 6.14×10⁻⁹ | -1.06 |
| Max Drinks | 4.83×10⁻⁸ | 5.02×10⁻⁸ | -0.64 | |||
| rs925368 | 12 | 108875362 | Flush Response | 1.49×10⁻⁸ | 1.55×10⁻⁸ | -1.03 |
| Max Drinks | 5.31×10⁻⁸ | 5.52×10⁻⁸ | -0.64 | |||
| rs2238149 | 12 | 109796312 | Flush Response | 1.95×10⁻⁸ | 2.02×10⁻⁸ | -0.77 |
| rs11065750 | 12 | 109815399 | Flush Response | 9.68×10⁻¹⁵ | 1.01×10⁻¹⁴ | -1.06 |
| Max Drinks | 2.96×10⁻¹⁰ | 3.08×10⁻¹⁰ | -0.53 | |||
| rs1858881 | 12 | 109818500 | Flush Response | 7.48×10⁻¹⁵ | 7.77×10⁻¹⁵ | -1.06 |
| Max Drinks | 1.67×10⁻⁹ | 1.74×10⁻⁹ | -0.51 | |||
| rs10774610 | 12 | 109824626 | Flush Response | 7.48×10⁻¹⁵ | 7.77×10⁻¹⁵ | -1.06 |
| Max Drinks | 1.67×10⁻⁹ | 1.74×10⁻⁹ | -0.51 | |||
| rs1034603 | 12 | 110133727 | Flush Response | 2.87×10⁻⁸ | 2.99×10⁻⁸ | 0.66 |
| rs7971185 | 12 | 110144982 | Flush Response | 2.09×10⁻⁸ | 2.17×10⁻⁸ | 0.68 |
| rs6490029 | 12 | 110182840 | Flush Response | 9.83×10⁻¹⁴ | 1.02×10⁻¹³ | -0.94 |
| Max Drinks | 6.84×10⁻¹⁰ | 7.11×10⁻¹⁰ | -0.49 | |||
| rs4766566 | 12 | 110191260 | Flush Response | 7.21×10⁻¹⁵ | 7.50×10⁻¹⁵ | -1.00 |
| Max Drinks | 8.75×10⁻¹² | 9.10×10⁻¹² | -0.55 | |||
| rs3782886 | 12 | 110594872 | Alcohol Dependence | 4.55×10⁻⁸ | 4.74×10⁻⁸ | 0.89 |
| Flush Response | 9.31×10⁻²⁶ | 9.68×10⁻²⁶ | -1.60 | |||
| Max Drinks | 1.95×10⁻¹⁶ | 2.02×10⁻¹⁶ | -0.73 | |||
| rs671 | 12 | 110726149 | Alcohol Dependence | 4.55×10⁻⁸ | 4.73 ×10⁻⁸ | 0.88 |
| Flush Response | 4.62×10⁻²⁶ | 4.75×10⁻²⁶ | -1.81 | |||
| Max Drinks | 1.48 ×10⁻¹⁶ | 1.54×10⁻¹⁶ | 0.16 |
The clustering of significant hits around ALDH2 across these three related phenotypes suggests that a man who flushes is less likely to consume large quantities of alcohol in a limited timeframe and, thus, would be at reduced risk of AD. Indeed, for males without a flushing response (N = 190) the average maximum drinks score is 17.0 compared to 12.0 in males with a flushing response (N = 108, t-test for zero difference in mean p = 2.57×10⁻⁵, Figure 2) and 43.8% of males who do not flush are classified as AD, compared to 18.5% of males who do (χ2 = 22.2, d.f. = 3, p < 0.0001).
Figure 2. Distribution of maximum drinks in 24 hours by flushing status.
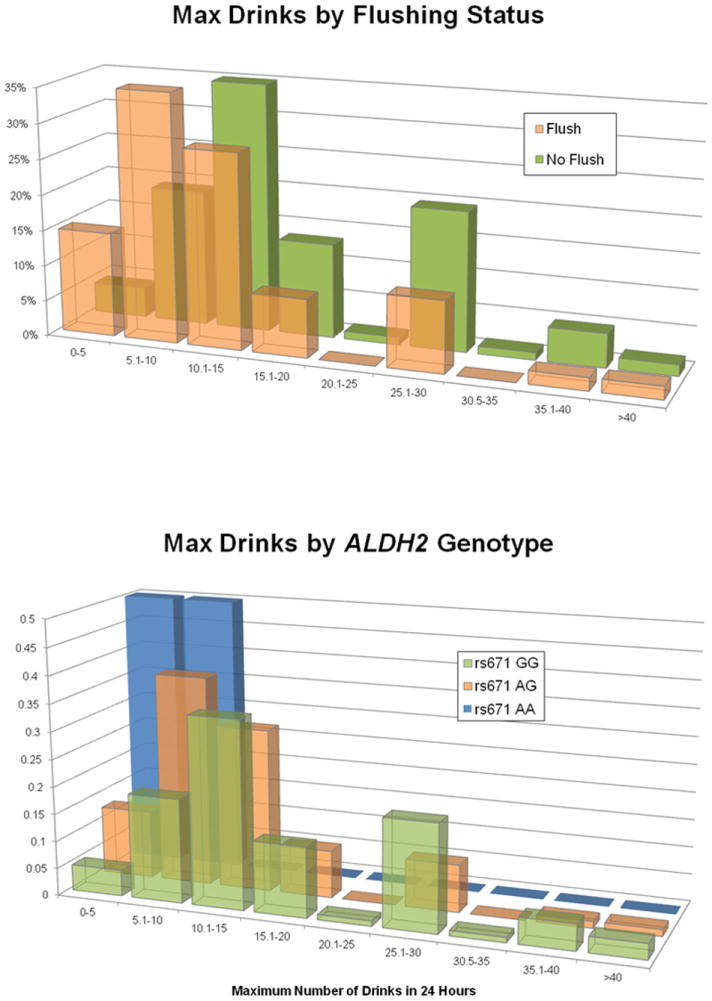
Individuals who self-report flushing following consumption of alcohol and those who do not comprise overlapping distributions of maximum drinks with significantly different means. Percentage of total represents the proportion of individuals within the flushing status (yes/no) who report a given maximum drinks value.
As an endophenotype, maximum drinks is expected to show both a phenotypic and a genetic correlation – the proportion of additive genetic effect shared between the phenotypes – with AD. In this sample, the genetic correlation between AD and maximum drinks (ρg) is 0.36 (std. error = 0.29), with age included as a covariate as calculated in SOLAR. This correlation is similar to that seen between maximum drinks and flushing (ρG = -0.39, std. error = 0.29, with age included as a covariate). The genetic correlation between AD and flushing is significantly larger than the correlation between maximum drinks and either of these phenotypes (ρG = -0.68, std. error = 0.33, with age included as a covariate). When rs671 genotype is included as a covariate, ρG values become non-significantly different from zero for each pair of phenotypes, indicating that the majority of the genetic correlation detected within the power constraints of this sample is due to the effect of ALDH2.
Because 115 of 186 females who had consumed at least one alcoholic beverage in their lives reported never having been drunk and were not queried about maximum drinks, there is insufficient data to consider a genome-wide association for this trait or AD in females. For these 186 females who have consumed alcohol, flushing response was reported and rs671 is considered as a candidate locus and significantly associated with flushing response in females (p = 1.25×10⁻¹¹).
Candidate SNP Analysis
Although this is only the second genome-wide association study of AD and related traits in China, several SNPs associated with AD and AD-related traits have been identified by GWAS in European and Japanese populations. SNPs related to AD, maximum or average alcohol consumption, and/or frequency of consumption were selected through the NHGRI Catalog of Published Genome-Wide Association Studies (Hindorff et al. 2009) and considered for AD, maximum drinks, and flushing response in the present sample of males. Two previous case-control GWAS of alcohol consumption (“drinkers” vs. “non-drinkers”) have been performed in Chinese or Japanese populations, each identifying an additional SNP associated with drinking behavior within 1MB of ALDH2 - rs10774610 in CCDC63 (Takeuchi et al. 2011) and rs11066280 near C12orf51 (Yang et al. 2013). In both papers, the authors note a lack of independence between these SNPs and rs671.
Only rs10774610 was present in our sample and itis associated with AD (p = 1.8×10⁻⁵), maximum drinks (p = 1.7×10⁻⁹), and flushing response (p = 7.5×10⁻¹⁵). When the ALDH2 SNP, rs671, is included as a covariate in the measured genotype association model, the association between rs10774610 and maximum drinks is nominally significant (p = 0.014) as is the association with flushing (p = 0.035).
Discussion
Although the link between ALDH2 and flushing response is well established (Li et al. 2012b), this is the first GWAS of a quantitative alcohol-related trait in a Chinese sample, and the associations at rs671 and surrounding SNPs in ALDH2 are extraordinarily strong for both flushing (p = 4.75×10⁻²⁶) and maximum drinks (p = 1.5×10⁻¹⁶). In our sample, the association is so strong and the region of LD surrounding the gene sufficiently broad that this SNP explains the associations we observed with two of the three SNPs previously reported in case-control GWAS in Japanese and Chinese populations.
A functional locus in ALDH2, rs671, explains a significant proportion of the genetic and phenotypic variation in this Chinese male sample. The role of this variant in the inability to metabolize ethanol fully, leading to nausea and other adverse consequences in addition to the appearance of facial flushing, has been well established and suggests a mechanism of action by which the frequency and volume of alcohol consumption is reduced. Due to overall low consumption of alcohol – which might be considered “environmental censoring” of phenotypic data – we are unable to draw conclusions about AD risk in the females in our sample. As this is a family-based sample ascertained on the basis of AD probands and these families are drawn from a relatively isolated region of China, it should be noted thatthe variation explained may not be generalizable to other populations in China and certainly will not be applicable to other populations where rs671 shows significantly different allele frequencies.
Despite the strong relationship between flushing and reduced alcohol consumption, we note that 20% of AD men in the sample show aldehyde deficiency, which poses health risks in individuals who consume alcohol. Studies by Yokoyama and colleagues demonstrate an elevated risk of esophageal cancer among alcohol dehydrogenase deficient individuals (rs671 GG) who frequently consume alcohol (Yokoyama et al. 1997, 2005; Brooks et al. 2009). AD, like other substance dependence traits, is a complex phenotype mediated by a number of environmental and genetic factors, some of which are likely to be population specific.
There are limitations to this study that should be considered – there are relatively few AD individuals available for case-control analysis and, for continuous traits, the study is underpowered to identify variants explaining less than 13% of the variance – but nevertheless we identified genome-wide significant associations for both traits. This study highlights the importance of conducting large-scale genetic studies in non-Western/non-European populations to assess population-specific risk. Variants that contribute to AD in populations of European ancestry may not be present in East Asian populations and vice versa, as is the case with rs671 in the ALDH2 gene, which is rare outside of East Asia (Li et al. 2012b).
Furthermore, substance dependence traits (and more generally, a subset of behavioral traits) are particularly susceptible to cultural influences which should be considered in selecting the appropriate analyses. Cultural expectations of drinking behavior vary by sex. Patterns of alcohol consumption in China are influenced by a history of medicinal alcohol use and drinking to enhance social and business bonds that encourages more alcohol consumption by males. Previous studies have found that Chinese men consume up to 13 times as much alcohol as Chinese women. (Cochrane et al. 2003) In this sample, the relatively low rates of AD among women in these AD-enriched families can be understood in the context of a high rate of lifelong abstention from alcohol. Abstention is problematic for analyses of genetic risk factors for alcoholism as it can indicate environmental effects (such as cultural influences), a lack of desire for alcohol (suggesting low genetic risk), or a reaction to specific experiences such as observing the negative effects of alcoholism on relatives (suggesting a high level of genetic risk). As a result, the inclusion of both male and female subjects in the analyses confounds the results; male-only analyses have lower power, but show stronger associations. Including sex as a covariate is insufficient to address the differences between the sexes due to the large discrepancy in both variance and mean of maximum drinks and the small number of women represented among AD cases.
Because culturally-mediated behaviors can significantly influence the distribution of phenotype, they are best understood through collaboration between local investigators who have the cultural and clinical experience to collect valid data and researchers with phenotype-specific and analytical expertise. The collection of samples among non-urban families enriched for AD dependence would not have been possible without this fruitful collaboration, and expands our understanding of the impact of genetic variation in China beyond the major urban centers where most previous genetic samples have been collected.
Supplementary Material
Maximum drinks are only included from those individuals with reported, not inferred, maximum drinks values. Male N = 258, Female N = 71.
Acknowledgments
Ming Tsuang generously assisted with DIGS training in Changsha, and also made the Chinese version of the DIGS II available to us. The authors would like to thank Li-jun Tan, Quan-Wei Liu, Fang Yin, Qing-Xi Wang, Chi Wang and Yong Zeng at Hunan Normal University and Wei Hao, Ya-Hui Xu, Gang Meng, Bin Jiao, Tao Luo, Jue-Lu Wang and Ming-Hui Chen at Central South University for their recruitment works.
Funding Statement: This work was supported by NIAAA grants R21 AA015973, P50 AA12870, and K24 AA013736 and NIDA grant R01 DA12849. The SOLAR statistical genetics computer package is supported by NIMH grant MH059490 and the supercomputing facilities used for this work at the AT&T Genetics Computing Center were supported in part by a gift from the SBC Foundation.
Footnotes
Conflict of Interest: Dr. Kranzler has been a paid consultant or advisory board member for Alkermes, Lilly, Lundbeck, Pfizer, and Roche and has received honoraria from the Alcohol Clinical Trials Initiative (ACTIVE) of the American Society of Clinical Psychopharmacology, which is supported by Lilly, Lundbeck, Abbott, and Pfizer.
References
- Almasy L, Blangero J. Multipoint quantitative-trait linkage analysis in general pedigrees. Am J Hum Genet. 1998;1995:1198–1211. doi: 10.1086/301844. [DOI] [PMC free article] [PubMed] [Google Scholar]
- Almasy L, Blangero J. Endophenotypes as quantitative risk factors for psychiatric disease: rationale and study design. Am J Med Genet. 2001;105:42–44. [PubMed] [Google Scholar]
- American Psychiatric Association. Diagnostic and Statistical Manual of Mental Disorders, Fourth Edition Revision DSM-IV-R. American Psychiatric Press; Washington, DC: 2000. [Google Scholar]
- Berney A, Preisig M, Matthey M-L, Ferrero F, Fenton BT. Diagnostic interview for genetic studies DIGS: inter-rater and test-retest reliability of alcohol and drug diagnoses. Drug Alcohol Depend. 2002;65:149–158. doi: 10.1016/s0376-8716(01)00156-9. [DOI] [PubMed] [Google Scholar]
- Brooks PJ, Enoch M-A, Goldman D, Li T-K, Yokoyama A. The alcohol flushing response: an unrecognized risk factor for esophageal cancer from alcohol consumption. PLoS Med. 2009;6:e1000050. doi: 10.1371/journal.pmed.1000050. [DOI] [PMC free article] [PubMed] [Google Scholar]
- Bucholz KK, Cadoret R, Cloninger CR, Dinwiddie SH, Hesselbrock VM, Nurnberger JI, Jr, Reich T, Schmidt I, Schuckit MA. A new, semi-structured psychiatric interview for use in genetic linkage studies: a report on the reliability of the SSAGA. J Stud Alcohol. 1994;55:149–58. doi: 10.15288/jsa.1994.55.149. [DOI] [PubMed] [Google Scholar]
- Chen XD, Xiong DH, Yang TL, Pei YF, Guo YF, Li J, Yang F, Pan F, Tan LJ, Yan H, Liu XG, Lei SF, Li X, Ning LL, Zhu XZ, Levy S, Kranzler HR, Farrer LA, Gelernter J, Recker RR, Deng HW. ANKRD7 and CYTL1 are novel risk genes for alcohol drinking behavior. Chin Med J. 2012;125:1127–1134. [PMC free article] [PubMed] [Google Scholar]
- Cochrane J, Chen H, Conigrave KM, Hao W. Alcohol use in China. Alcohol Alcohol. 2003;38:537–542. doi: 10.1093/alcalc/agg111. [DOI] [PubMed] [Google Scholar]
- Dick DM, Jones K, Saccone N, Hinrichs A, Wang JC, Goate A, Bierut L, Almasy L, Schuckit M, Hesselbrock V, Tischfield J, Foroud T, Edenberg H, Porjesz B, Begleiter H. Endophenotypes successfully lead to gene identification: results from the collaborative study on the genetics of alcoholism. Behav Genetics. 2006;36:112–126. doi: 10.1007/s10519-005-9001-3. [DOI] [PubMed] [Google Scholar]
- Dick DM, Meyers JL, Rose RJ, Kaprio J, Kendler KS. Measures of Current Alcohol Consumption and Problems: Two Independent Twin Studies Suggest a Complex Genetic Architecture. Alcohol Clin Exp Res. 2011;35:2152–2161. doi: 10.1111/j.1530-0277.2011.01564.x. [DOI] [PMC free article] [PubMed] [Google Scholar]
- Edenberg HJ. The genetics of alcohol metabolism: role of alcohol dehydrogenase and aldehyde dehydrogenase variants. Alcohol Res Health. 2007;30:5–13. [PMC free article] [PubMed] [Google Scholar]
- Gelernter J, Panhuysen C, Weiss R, Brady K, Hesselbrock V, Rounsaville B, Poling J, Wilcox M, Farrer L, Kranzler HR. Genomewide linkage scan for cocaine dependence and related traits: significant linkages for a cocaine-related trait and cocaine-induced paranoia. Am J Med Genet Part B. 2005;136B:45–52. doi: 10.1002/ajmg.b.30189. [DOI] [PubMed] [Google Scholar]
- Glatt S, Lasky-Su J, Zhu S. Genome-wide linkage analysis of heroin dependence in Han Chinese: Results from Wave Two of a multi-stage study. Drug Alcohol Depend. 2008;98:30–34. doi: 10.1016/j.drugalcdep.2008.04.011. [DOI] [PMC free article] [PubMed] [Google Scholar]
- Göring HHH, Terwilliger JD, Blangero J. Large upward bias in estimation of locus-specific effects from genomewide scans. Am J Hum Genet. 2001;69:1357–1389. doi: 10.1086/324471. [DOI] [PMC free article] [PubMed] [Google Scholar]
- Grant JD, Agrawal A, Bucholz KK, Madden PAF, Pergadia ML, Nelson EC, Lynskey MT, Todd RD, Todorov AA, Hansell NK, Whitfield JB, Martin NG, Heath AC. Alcohol Consumption Indices of Genetic Risk for Alcohol Dependence. Biol Psych. 2009;66:795–800. doi: 10.1016/j.biopsych.2009.05.018. [DOI] [PMC free article] [PubMed] [Google Scholar]
- Gulcher JR, Kong A, Stefansson K. The role of linkage studies for common diseases. Curr Opin Genet Dev. 2001;11:264–267. doi: 10.1016/s0959-437x(00)00188-x. [DOI] [PubMed] [Google Scholar]
- Hao W, Su Z, Liu B, Zhang K, Yang H, Chen S, Biao M, Cui C. Drinking and drinking patterns and health status in the general population of five areas of China. Alcohol and Alcohol. 2004;39:43–52. doi: 10.1093/alcalc/agh018. [DOI] [PubMed] [Google Scholar]
- Heath AC, Whitfield JB, Martin NG, Pergadia ML, Goate AM, Lind PA, Mcevoy BP, Schrage AJ, Julia D, Chou Y-L, Zhu R, Henders AK, Medland SE, Scott D, Nelson EC, Agrawal A, Nyholt DR, Bucholz KK, Madden PAF, Montgomery GW. A quantitative-trait genome-wide association study of alcoholism risk in the community: findings and implications. Biol Psychiatry. 2011;70:513–518. doi: 10.1016/j.biopsych.2011.02.028. [DOI] [PMC free article] [PubMed] [Google Scholar]
- Hindorff L, MacArthur J, Morales J, Junkins H, Hall P, Klemm A, Manolio T. Potential etiologic and functional implications of genome-wide association loci for human diseases and traits. Proc Natl Acad Sci USA. 2009;106:9362–9367. doi: 10.1073/pnas.0903103106. [DOI] [PMC free article] [PubMed] [Google Scholar]
- Hwu H-G, Faraone SV, Liu C-M, Chen WJ, Liu S-K, Shieh M-H, Hwang T-J, Tsuang M-M, OuYang W-C, Chen C-Y, Chen C-C, Lin J-J, Chou FH-C, Chueh C-M, Liu W-M, Hall M-H, Tsuang MT. Taiwan schizophrenia linkage study: the field study. Am J Med Genet Part B. 2005;134B:30–36. doi: 10.1002/ajmg.b.30139. [DOI] [PubMed] [Google Scholar]
- Kendler KS, Myers J, Dick D, Prescott CA. The Relationship Between Genetic Influences on Alcohol Dependence and on Patterns of Alcohol Consumption. Alcohol Clin Exp Res. 2010;34:1058–1065. doi: 10.1111/j.1530-0277.2010.01181.x. [DOI] [PMC free article] [PubMed] [Google Scholar]
- Li D, Zhao H, Gelernter J. Strong association of the alcohol dehydrogenase 1B gene ADH1B with alcohol dependence and alcohol-induced medical diseases. Bio Psychiatry. 2011;70:504–512. doi: 10.1016/j.biopsych.2011.02.024. [DOI] [PMC free article] [PubMed] [Google Scholar]
- Li D, Zhao H, Gelernter J. Further clarification of the contribution of the ADH1C gene to vulnerability of alcoholism and selected liver diseases. Hum Genet. 2012a;131:1361–1374. doi: 10.1007/s00439-012-1163-5. [DOI] [PMC free article] [PubMed] [Google Scholar]
- Li D, Zhao H, Gelernter J. Strong protective effect of the aldehyde dehydrogenase gene ALDH2 504lys * 2 allele against alcoholism and alcohol-induced medical diseases in Asians. Hum Genet. 2012b;131:1–13. doi: 10.1007/s00439-011-1116-4. [DOI] [PMC free article] [PubMed] [Google Scholar]
- Mikko S. Interactions of alcohol and tobacco in gastrointestinal cancer. J Gastroenterol Hepatol. 2012;(Suppl 2):135–139. doi: 10.1111/j.1440-1746.2012.07017.x. [DOI] [PubMed] [Google Scholar]
- Ober C, Cox NJ, Abney M, Di Rienzo A, Lander ES, Changyaleket B, Gidley H, Kurtz B, Lee J, Nance M, Pettersson A, Prescott J, Richardson A, Schlenker E, Summerhill E, Willadsen S, Parry R. Genome-wide search for asthma susceptibility loci in a founder population. Hum Mol Genet. 1998;7:1393–1398. doi: 10.1093/hmg/7.9.1393. [DOI] [PubMed] [Google Scholar]
- Peltonen L, Palotie A, Lange K. Use of population isolates for mapping complex traits. Nat Rev Genet. 2000;1:182–190. doi: 10.1038/35042049. [DOI] [PubMed] [Google Scholar]
- Pierucci-Lagha A, Gelernter J, Feinn R, Cubells JF, Pearson D, Pollastri A, Farrer L, Kranzler HR. Diagnostic reliability of the Semi-structured Assessment for Drug Dependence and Alcoholism SSADDA. Drug Alcohol Depend. 2005;80:303–312. doi: 10.1016/j.drugalcdep.2005.04.005. [DOI] [PubMed] [Google Scholar]
- Rose JE, Behm FM, Drgon T, Johnson C, Uhl GR. Personalized smoking cessation: interactions between nicotine dose, dependence and quit-success genotype score. Mol Med. 2010;16:247–253. doi: 10.2119/molmed.2009.00159. [DOI] [PMC free article] [PubMed] [Google Scholar]
- Sun L, Wilder K, McPeek MS. Enhanced pedigree error detection. Hum Hered. 2002;542:99–110. doi: 10.1159/000067666. [DOI] [PubMed] [Google Scholar]
- Schumann G, Coin LJ, Lourdusamy A, Charoen P, Berger KH, Stacey D, Desrivières S, Aliev F, Khan A, Amin N, Aulchenko YS, Bakalkin G, Bakker SJ, Balkau B, Beulens JW, Bilbao A, de Boer R, Beury D, Bots ML, Breetvelt EJ, Cauchi S, Cavalcanti-Proença C, Chambers JC, Clarke T-K, Dahmen N, de Geus EJ, Dick D, Ducci F, Easton A, Edenberg HJ, Esko T, Esk T, Fernández-Medarde A, Foroud T, Freimer NB, Girault J-A, Grobbee DE, Guarrera S, Gudbjartsson DF, Hartikainen A-L, Heath AC, Hesselbrock V, Hofman A, Hottenga J-J, Isohanni MK, Kaprio J, Khaw K-T, Kuehnel B, Laitinen J, Lobbens S, Luan J, Mangino M, Maroteaux M, Matullo G, McCarthy MI, Mueller C, Navis G, Numans ME, Núñez A, Nyholt DR, Onland-Moret CN, Oostra B, O’Reilly PF, Palkovits M, Penninx BW, Polidoro S, Pouta A, Prokopenko I, Ricceri F, Santos E, Smit J, Soranzo N, Song K, Sovio U, Stumvoll M, Surakk I, Thorgeirsson TE, Thorsteinsdottir U, Troakes C, Tyrfingsson T, Tönjes A, Uiterwaal CS, Uitterlinden AG, van der Harst P, van der Schouw YT, Staehlin O, Vogelzangs N, Vollenweider P, Waeber G, Wareham NJ, Waterworth DM, Whitfield JB, Wichmann EH, Willemsen G, Witteman JC, Yuan X, Zhai G, Zhao JH, Zhang W, Martin NG, Metspalu A, Doering A, Scott J, Spector TD, Loos RJ, Boomsma DI, Mooser V, Peltonen L, Stefansson K, van Duijn CM, Vineis P, Sommer WH, Kooner JS, Spanagel RJ, Heberlein U, Jarvelin M-R, Elliott P. Genome-wide association and genetic functional studies identify autism susceptibility candidate 2 gene AUTS2 in the regulation of alcohol consumption. Proc Natl Acad Sci USA. 2011;108:7119–7124. doi: 10.1073/pnas.1017288108. [DOI] [PMC free article] [PubMed] [Google Scholar]
- Sobel E, Lange K. Descent graphs in pedigree analysis: applications to haplotyping, location scores, and marker sharing statistics. Am J Hum Gen. 1996;58:1323–1337. [PMC free article] [PubMed] [Google Scholar]
- Sobel E, Sengul H, Weeks DE. Multipoint estimation of identity-by-descent probabilities at arbitrary positions among marker loci on general pedigrees. Hum Heredity. 2001;52:121–131. doi: 10.1159/000053366. [DOI] [PubMed] [Google Scholar]
- Sobel E, Papp JC, Lange K. Detection and integration of genotyping errors in statistical genetics. Am J Hum Gen. 2002;70:496–508. doi: 10.1086/338920. [DOI] [PMC free article] [PubMed] [Google Scholar]
- Takeuchi F, Isono M, Nabika T, Katsuya T, Sugiyama T, Yamaguchi S, Kobayashi S, Ogihara T, Yamori Y, Fujioka A, Kato N. Confirmation of ALDH2 as a Major Locus of Drinking Behavior and of Its Variants Regulating Multiple Metabolic Phenotypes in a Japanese Population. Circ J. 2011;75:911–918. doi: 10.1253/circj.cj-10-0774. [DOI] [PubMed] [Google Scholar]
- Tang J, Chen X, Zhao J, Xu X, Liu T, Xu L. A linkage study of N-Methyl-D-Aspartater receptor NRI subunit gene and schizophrenia. Chin J Nerv Mental Disord. 2007;33:73–76. [Google Scholar]
- Thomasson HR, Crabb DW, Edenberg HJ, Li T-K. Alcohol and aldehyde dehydrogenase polymorphisms and alcoholism. Behav Genet. 1993;23:131–136. doi: 10.1007/BF01067417. [DOI] [PubMed] [Google Scholar]
- Treutlein J, Cichon S. Genome-wide association study of alcohol dependence. Arch Gen Psychiatry. 2009;66:773–784. doi: 10.1001/archgenpsychiatry.2009.83. [DOI] [PMC free article] [PubMed] [Google Scholar]
- Treutlein J, Kissling C, Frank J, Wiemann S, Dong L, Depner M, Saam C, Lascorz J, Soyka M, Preuss UW, Rujescu D, Skowronek MH, Rietschel M, Spanagel R, Heinz A, Laucht M, Mann K, Schumann G. Genetic association of the human corticotropin releasing hormone receptor 1 CRHR1 with binge drinking and alcohol intake patterns in two independent samples. Mol Psychiatry. 2006;11:594–602. doi: 10.1038/sj.mp.4001813. [DOI] [PubMed] [Google Scholar]
- Wang JC, Grucza R, Cruchaga C, Hinrichs AL, Bertelsen S, Budde JP, Fox L, Goldstein E, Reyes O, Saccone N. Genetic variation in the CHRNA5 gene affects mRNA levels and is associated with risk for alcohol dependence. Mol Psychiatry. 2008;14:501–510. doi: 10.1038/mp.2008.42. [DOI] [PMC free article] [PubMed] [Google Scholar]
- Wang JC, Foroud T, Hinrichs AL, Le NX, Bertelsen S, Budde JP, Harari O, Koller DL, Wetherill L, Agrawal A, Almasy L, Brooks AI, Bucholz K, Dick D, Hesselbrock V, Johnson EO, Kang S, Kapoor M, Kramer J, Kuperman S, Madden PA, Manz N, Martin NG, McClintick JN, Montgomery GW, Nurnberger JI, Jr, Rangaswamy M, Rice J, Schuckit M, Tischfield JA, Whitfield JB, Xuei X, Porjesz B, Heath AC, Edenberg HJ, Bierut LJ, Goate AM. A genome-wide association study of alcohol-dependence symptom counts in extended pedigrees identifies C15orf53. Mol Psychiatry. 2012 doi: 10.1038/mp.2012.143. Epub ahead of print. [DOI] [PMC free article] [PubMed] [Google Scholar]
- Whitfield JB, Martin NG. Alcohol reactions in subjects of European descent: effects on alcohol use and on physical and psychomotor responses to alcohol. Alcohol Clin Exp Res. 1996;20:81–86. doi: 10.1111/j.1530-0277.1996.tb01048.x. [DOI] [PubMed] [Google Scholar]
- Yang X, Lu X, Wang L, Chen S, Li J, Cao J, Chen J, Hao Y, Li Y, Zhao L, Li H, Liu D, Wang L, Lu F, Shen C, Yu L, Wu X, Zhao Q, Ji X, Guo D, Peng X, Huang J, Gu D. Common variants at 12q24 are associated with drinking behavior in Han Chinese. Am J Clin Nutr. 2013;97:545–51. doi: 10.3945/ajcn.112.046482. [DOI] [PubMed] [Google Scholar]
- Yokoyama A, Muramatsu T, Ohmori T, Kumagai Y, Higuchi S, Ishii H. Reliability of a flushing questionnaire and the ethanol patch test in screening for inactive aldehyde dehydrogenase-2 and alcohol-related cancer risk. Cancer Epidemiol Biomarkers Prev. 1997;6:1105–1107. [PubMed] [Google Scholar]
- Yokoyama A, Yokoyama T, Kumagai Y, Kato H, Igaki H, Tsujinaka T, Muto M, Omori T, Yokoyama M, Watanabe H. Mean Corpuscular Volume, Alcohol Flushing, and the Predicted Risk of Squamous Cell Carcinoma of the Esophagus in Cancer-Free Japanese Men. Alcohol Clin Exp Res. 2005;29:1877–1883. doi: 10.1097/01.alc.0000183168.98680.aa. [DOI] [PubMed] [Google Scholar]
Associated Data
This section collects any data citations, data availability statements, or supplementary materials included in this article.
Supplementary Materials
Maximum drinks are only included from those individuals with reported, not inferred, maximum drinks values. Male N = 258, Female N = 71.