

Abstract
The Function of the retina and effects of drugs on it can be assessed by recording transretinal voltage across isolated retina that is perfused with physiological medium. However, building ex vivo ERG apparatus requires substantial amount of time, resources and expertise. Here we adapted a commercial in vivo ERG system for transretinal ERG recordings from rod and cone photoreceptors and compared rod and cone signalling between ex vivo and in vivo environments. We found that the rod and cone a- and b-waves recorded with the transretinal ERG adapter and a standard in vivo ERG system are comparable to those obtained from live anesthetized animals. However, ex vivo responses are somewhat slower and their oscillatory potentials are suppressed as compared to those recorded in vivo. We found that rod amplification constant (A) was comparable between ex vivo and in vivo conditions, ∼10 - 30 s-2 depending on the choice of response normalization. We estimate that the A in cones is between 3 and 6 s-2 in ex vivo conditions and by assuming equal A in vivo we arrive to light funnelling factor of 3 for cones in the mouse retina. The ex vivo ERG adapter provides a simple and affordable alternative to designing a custom-built transretinal recordings setup for the study of photoreceptors. Our results provide a roadmap to the rigorous quantitative analysis of rod and cone responses made possible with such a system.
Keywords: electroretinogram, transretinal ERG, a-wave, b-wave, photoreceptor, rod, cone
1. Introduction
Photoreceptors in the retina transform incoming photons into an electrical signal. Rod photoreceptors mediate night vision while cone photoreceptors enable us to see fine details and colors in daylight. Many retinal diseases that lead to blindness are caused by photoreceptor dysfunction. With the advancement of molecular tools over the last decades, genetically modified animals have become widely used to study the physiology and pathology of the retina in an effort to understand how photoreceptor function is affected in visual disorders and for the development of therapeutic treatments for degenerative and blinding diseases (Boye, et al., 2013, Dalke & Graw, 2005, Peachey & Ball, 2003). Electroretinography (ERG) is an established technique used to measure light-induced electrical activity of the retina (Armington & Bloom, 1974). ERG can be measured in vivo from humans or anesthetized animals and commercial in vivo systems are routinely used in many laboratories and clinical settings. The in vivo ERG response to a flash of light consists of an initial negative a-wave followed by positive b-wave that can be roughly related to the activity of photoreceptors and ON bipolar cells, respectively (Green & Kapousta-Bruneau, 1999a, Gurevich & Slaughter, 1993, Penn & Hagins, 1969, Robson & Frishman, 1995, Stockton & Slaughter, 1989). However, the initial a-wave is quickly overlapped with the b-wave preventing accurate studies of photoreceptor function. This is especially problematic in photopic ERG recordings, where the a-wave produced by the small percentage of cone photoreceptors is detectable only with very bright test flashes. Furthermore, mechanical movement of the animal during recordings (caused by breathing and heart beat) complicates the quantitative analysis of the in vivo ERG data.
Ex vivo ERG is another well-established method which measures the light-induced voltage change across the retina isolated from the eye and pigment epithelium. Ex vivo signal can be recorded across the whole retina (transretinal ERG, Donner, et al., 1988, Frank & Dowling, 1968, Granit, 1933, Nymark, et al., 2005) or across different retinal layers with microelectrodes (Arden, 1976, Green & Kapousta-Bruneau, 1999b, Penn & Hagins, 1969). In optimal perfusion conditions, the scotopic a- and b-waves of transretinal ERG are comparable to the corresponding in vivo waves (Green & Kapousta-Bruneau, 1999b, Heikkinen, et al., 2012). However, it is not clear how well cone signalling is preserved under ex vivo conditions. Recently, transretinal ERG has proved to be a very powerful tool to study mouse rod and cone phototransduction and the visual cycle (Brockway, et al., 2005, Heikkinen, et al., 2008, Heikkinen et al., 2012, Kolesnikov, et al., 2011, Sakurai, et al., 2011, Wang, et al., 2009). This method provides easy means to isolate the photoreceptor signal component by using chemical agents to block synaptic transmission. It also significantly improves the signal-to-noise ratio (SNR) compared to in vivo ERG because of the lack of mechanical movement of the specimen. Overall, transretinal ERG facilitates quantitative studies of photoreceptors while still in their natural environment. In addition, it represents an easy way to test the effect of various drugs on photoreceptor function and retinal physiology. However, ex vivo ERG commercial equipment has not been available until now and construction of a custom-built setup is not trivial. Here we demonstrate that transretinal ERG recordings can be obtained with a commercial ex vivo ERG adapter (Ocuscience.us) in combination with a standard in vivo ERG system such as the one made by LKC (originally designed for human studies but also widely used for rodents) or the one from Ocuscience (made specifically for small animals). The adapter is a cost-effective way for studying mammalian rod and cone photoreceptor function and allows several hours of stable recordings simultaneously from two isolated retinas with very good SNR and minimal rundown. To establish the method and demonstrate the type of physiological analysis possible with it, we compared the kinetics and sensitivity of rods and cones between in vivo recordings (using an LKC ERG system) and ex vivo recordings (using the LKC system with the ex vivo ERG adapter). Consistent with previous studies, we found that rod sensitivity and the magnitude of phototransduction amplification are preserved in the isolated retina. Quantitative analysis of rod and cone ERG a-waves showed that mouse rods have higher molecular amplification constant compared to cones. In addition, comparison of phototransduction amplification between in vivo and ex vivo conditions yielded an estimate of ∼ 3 for the cone light funnelling factor in vivo. Finally, we compared rod and cone synaptic transmission between in vivo and ex vivo conditions. Analysis of rod and cone b-waves revealed that their amplitude and kinetics were largely preserved ex vivo. However, we found that in contrast to in vivo recordings, the rod b-wave amplitude increased supralinearly with increasing flash energy in ex vivo conditions.
2. Materials and methods
2.1 Animals
All rod ERG recordings were obtained from wild-type (WT) C57Bl/6 mice, and all cone ERG recordings were done from rod transducin α knock-out (Gnat1-/-) mice whose rods do not produce light responses (Calvert, et al., 2000). Animals were kept in 12/12 hours dark/light cycle and dark-adapted 6–12 hours before the experiment. All experimental protocols were in accordance with the Guide for the Care and Use of Laboratory Animals and were approved by the institutional animal care and use committee at Washington University and adhered to the EU Directive 2010/63/EU for animal experiments.
2.2 Ex Vivo Adapter Design
The ex vivo ERG adapter illustrated in Supplementary Figure S1 is built around the commercial in vivo ERG system from LKC Technologies. The main components of the adapter are 1) the specimen holder, 2) the perfusion system, and 3) the heat exchanger. Light stimulation and data collection are performed by using LKC LED ganzfeld stimulator, universal biomedical amplifier (UBA4200), drivers, and EM for Windows 9.4.0 software.
2.2.1 Specimen holder
The specimen holder design is based on a previously published type of closed perfusion chamber (Nymark, et al., 2006, Figure 1 and Supplementary Figure S2). This closed design is optimal since it minimizes the risk of perfusion solution spills on the expensive light-reflective coating of the ganzfeld sphere. In addition, the chamber is simple to use and does not require additional stands or micromanipulators for electrode positioning. To further improve the ease of use and the efficiency of data collection, the chamber is machined from two separate pieces of polycarbonate (top and bottom parts) with threaded female connectors for custom-built electrode mounts, designed to host pellet electrodes with gold-plated 2 mm pin connectors (RC2, World Precision Instrument (WPI)). A polished transparent 0.5 mm thick polycarbonate window over the retinas allows efficient light stimulation. The double-specimen holder design enables simultaneous recordings from two isolated retinas.
Figure 1. Double-retina specimen holder.
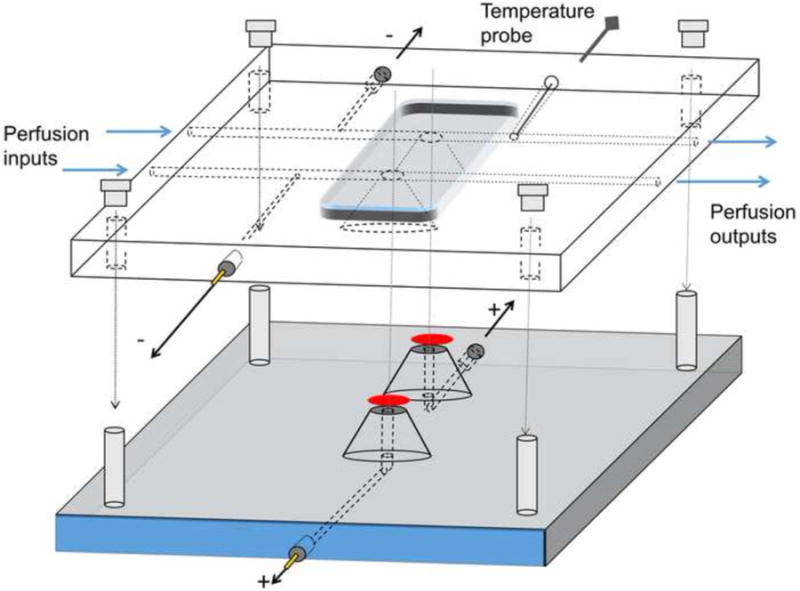
The bottom part has two domes topped with filter paper supporting the retinas (red ovals). Electrode channels filled with physiological solution allow electrical contact to the ganglion cell side of the retinas. Two pellet electrodes with custom-build housings (see text) are thread-connected. The top part has individual perfusion channels for each retina. Electrical connection to photoreceptor side of the retinas is achieved through narrow channels that are connected to the perfusion channels. Similar electrodes as in the bottom part are thread-connectable. After placing the dissected retinas on the domes, the top part is clamped tightly to the bottom part with permanent screws in the bottom part and nuts on the top. O-rings (not shown in the Figure) around the domes prevent perfusion solution leaks.
The bottom part of the specimen holder contains two domes with Ø3 mm flat top surfaces on which round filter papers (HABG01300, Millipore) are attached. This filter paper is recommended to use because it is grey/black, and thus should not reflect significant amounts of light, facilitating the conversion of light energy into pigment isomerizations (see 2.5). Two 1 mm diameter channels filled with physiological solution provide the connection between the proximal side of each retina and pellet electrodes that are connected to the amplifier's positive pole (see Figure 1). The domes are surrounded by O-ring seals to prevent leakage of the perfusion solution which would potentially increase the noise, shunting, and mixing the signals between the two retinas. Retinas (red ovals in Figure 1) are placed photoreceptor side up on the filter paper on top of the domes. The top chamber piece, with grooves matching the domes, is clamped tightly onto the bottom piece with screws and wing nuts. The top piece includes two separate parallel channels to perfuse the two retinas at their photoreceptor side. Thin Ø0.63 mm channels connected to the perfusion channels provide the electrical interface between the distal sides of the retinas and electrodes that are connected to the amplifier's negative pole (ERG signal reference). In addition, the top part houses the adapter for the mouse rectal temperature probe (503524, WPI) that monitors the temperature very near the retina, just downstream of it.
2.2.2 Perfusion System
The perfusion solution is fed by gravity from a bottle warmed to 37 °C in a water bath (e.g. 180 Series Water Bath, Thermo Scientific) placed on the top of the LKC LED ganzfeld stimulator. For safety, the water bath was filled with metallic beads instead of water (Lab Armor Bath Beads, Fisher Scientific) that surrounded the perfusion bottle to maintain steady and even temperature of the perfusion solution. The perfusion solution is bubbled in the bottle with 95% O2/5% CO2 gas mixture and guided through the flow-rate valve (2C8891, Baxter) and heat exchanger (see Supplementary Figure S1) to the perfusion channels of the specimen holder and eventually to the waste bin placed just outside the ganzfeld sphere. The electromagnetic noise introduced through the perfusion system is reduced by a Faraday cage that is attached on the top of the LKC ganzfeld stimulator around the water bath and by shielding the perfusion tubing with aluminium foil. The Faraday cage and tubing shield are electrically connected to the amplifier's ground with a grounding cable.
2.2.3 Temperature control
The temperature of the retina is controlled by using the temperature controller (ATC1000, WPI), mouse heating pad (502195, WPI), and mouse rectal temperature probe (503524, WPI) provided with the in vivo ERG system, combined with a custom-built brass heat exchanger. The rectal probe is mounted permanently to the top part of the specimen holder close to the retina, and is connected to ATC1000 temperature controller with the temperature set to 37 °C. The specimen holder is placed on the heating pad. Warming of the retina is further facilitated by circulating the perfusion solution tubing through the brass heat exchanger that is also mounted on the mouse heating pad (see Supplementary Figure S1).
2.3 Ex vivo ERG Recordings
Dark-adapted animals were sacrificed by CO2 inhalation, the eyes were enucleated and bisected along the equator, and the retinas without retinal pigment epithelium (RPE) were detached in Ames solution under infrared (IR) light with IR converters fit to the dissecting microscope. Both retinas of the mouse were mounted on the domes of the specimen holder as described above and the specimen holder was transferred to the LKC system under dim red light. Ames medium (A1420, Sigma-Aldrich) was used as the perfusion solution, with 50 μM BaCl2 added to remove the strong negative glial PIII component. DL-AP4 (50 μM) was used to isolate the photoreceptor component. Photoreceptors were stimulated with LKC system's green (530 nm) LED light which was calibrated as described below. All chemicals except DL-AP4 (Tocris Bioscience) were purchased from Sigma-Aldrich. For all recordings, the responses were low-pass filtered at 300 Hz (8-pole Bessel filter built in the LKC amplifier) and data was acquired at 1000 Hz.
2.4 In Vivo ERG Recordings
Dark-adapted mice were anesthetized by intraperitoneal injection of ketamine (80 mg/kg) and xylazine (15 mg/kg) cocktail. Pupils were dilated with 1% atropine sulfate. During testing, a heating pad controlled by a rectal temperature probe maintained mouse body temperature at 37 °C. Full-field ERGs were recorded using a UTAS BigShot apparatus (LKC Technologies) and mouse corneal electrodes (STelesSR, LKC Technologies). The reference electrode needle was inserted under the skin at the skull. Test flashes of calibrated green (530 nm) LED light were applied in darkness. For all recordings, the filtering and acquisition parameters were identical to ex vivo recordings.
2.5 Light Calibration
The photopic luminous energy ([E] = Cd s m-2) of green (530 nm) flashes produced by the LKC stimulator from -35 to 10 dB (the nominal flash energies set from the software) was measured with calibrated integrating flexOptometer™ (Gamma Scientific / UDT Instruments). For dimmer flashes E was calculated from the measured reference point at -35 dB using the dB scale of the LKC stimulus unit. In order to quantify the amplification and sensitivity of the mouse rod and cone phototransduction (see 2.6) the luminous energy in Cd s m-2 had to be converted into flash energy Q expressed in photons per unit area. Green 530 nm light flashes from the LKC LED ganzfeld stimulator produced up to (our own calibration) 1.5 log (Cd s m-2). In addition, very bright broadband spectrum Xenon flash tube, producing up to nominal 25 dB of white light, was used to find the maximal a- and b-wave amplitudes at the end of in vivo experiments. For our green light stimuli, the photon flux Q can be expressed (see Wyszecki, 1982) as:
| (1) |
where the factor k converts photopic lumens to scotopic lumens and 1.5 × 10¹⁵ (in units of photons s-1 lumen-1) converts scotopic lumens into photon flux. The value for k at 530 nm is 2.34, based on the comparison of the standard CIE photopic and scotopic luminosity functions at 530 nm.
The comparison of in vivo and ex vivo data was facilitated by the use of the same LKC system when recording either from live mouse or isolated retina. On the other hand, light was delivered at wide angle and scattered in our polycarbonate specimen holder affecting the amount of light ultimately absorbed by visual pigments in the photoreceptor outer segments. We measured the effect of stimulation geometry by covering the specimen holder with aluminum foil that had a Ø3 mm aperture above the retina which decreased the linear range response by 1.7-fold. In our standard electrophysiology rig (Sundermeier, et al., 2014) where a narrow-angle beam was used, the same aluminum sheet did not affect the rod sensitivity. We also compared the sensitivity of rods under identical perfusion conditions between our electrophysiology rig and ex vivo adapter system. After correction for the scattered light, the calculated sensitivity of WT rods was comparable (within 15%) between the two setups. In order to compare the cellular and molecular properties of the retinas between in vivo and ex vivo conditions, we estimated how the optics of the mouse eye affected the photon flux at the level of the photoreceptor outer segments. For this, the following expression was used (Lyubarsky, et al., 2004, Lyubarsky, et al., 1999)
| (2) |
where Φ is the number of photopigment isomerizations in rods or cones, Q(λ) is defined in Eqn. (1), τ(λ) is the light transmission of the pre-photoreceptor media of the eye (0.7 for green light), Spupil is the area of a fully dilated pupil (3.2 mm2 for adult mouse eye), Sretina is the total area of the retina (18 mm2), and f is the light funneling factor by photoreceptor inner segments (∼1.3 for rods and 7 for cones, Lyubarsky et al., 2004, Lyubarsky et al., 1999). In transretinal recordings, light was applied from the photoreceptor side so f = 1. On the other hand, in this stimulation geometry the amount of light reaching the cone outer segments was affected by the rod shadowing effect (Heikkinen et al., 2008). For cone ex vivo recordings this was corrected by setting kshadow to 0.7 (while for in vivo recordings it was set to 1) in the Equation (2) (Heikkinen et al., 2008, Sakurai et al., 2011). The light collecting area (ac) converts the number of photons hitting the outer segments of rods or cones into the number of pigment isomerizations and it is identical for in vivo and ex vivo recordings. We adopted ac of 0.57 and 0.07 μm2 at 530 nm for rods and cones, respectively (Govardovskii, et al., 2000, Lyubarsky et al., 2004, Lyubarsky et al., 1999, Sakurai et al., 2011). The parameters that are different between in vivo and ex vivo in the Equation (2) are τ(λ), Spupil, Sretina, f and kshadow. For in vivo recordings the term τ(λ) × (Spupil/Sretina) × f × kshadow is 0.16 for rods and 0.87 for cones whereas in ex vivo case this term equals to 1 for rods and 0.75 for cones. This means that rod outer segments receive about ten times more photons with equal stimuli in ex vivo compared to in vivo recording geometry (including the correction factor of 1.7 for the scattered light, see above) while cone outer segments should receive more photons in vivo (2-fold more if scattered light is included). When calculating this term for cones in vivo, we adapted a funneling factor of 7 which is based on the assumption that all of the light “collected” by cone inner segments is funneled to the outer segment (see Lyubarsky, et al., 2002). The validity of this assumption will be discussed below. Finally, we introduce here a general light collection area αc(λ) that combines all the terms needed to convert photon flux into pigment isomerizations in rods or cones in both in vivo and ex vivo conditions.
2.6 Data Analysis
A Hill-type function
| (3) |
was fitted to ERG a- and b-wave normalized amplitudes (r/rmax) to find the flash strength that produces a half-maximal response (E½). In the presence of DL-AP4 the maximum rod response was measured at the plateau level after the initial fast negative peak present in bright flash responses.
The gain of phototransduction activation reactions was quantified by determining the amplification constant A as described by Lamb & Pugh, 1992 (LP model). For cone amplification constant the effect of membrane time constant was factored in as described by Smith & Lamb, 1997. Amplification constant (A) was fitted individually to each trace of the flash response family and average value reported for each mouse. However, as amplification constant is known to decrease at bright flash energies, values from bright flash responses were excluded from the analysis. The short delay in LP function was kept between 2 and 3 ms and the membrane time constant of cones was assumed to be 5 ms. Fittings were performed with Origin 9.0.0 (64-bit, SR2, OriginLab) and other analysis was done with Origin and EMWin 9.4.0 (LKC Technolgies). For statistical analysis two-tailed student t-test was used.
3. Results
3.1 Comparison of Ex Vivo and In Vivo ERG Flash Responses from Rods and Cones
Physiological recordings from isolated retina offer some advantages compared to in vivo experiments (see Introduction and Discussion). However, it is not clear how the photoreceptor responses recorded in ex vivo conditions correspond to those in vivo. Here we compared rod- and cone-driven responses recorded from anesthetized mice with those from isolated mouse retinas obtained with the ex vivo adapter. We suppressed the strong negative glial slow PIII component by barium as described in 2.3, because it caused a transient decrease of the ex vivo b-wave amplitude within a certain flash range (see supplemental Figure S3).Green and Kapousta-Bruneau observed a similar effect of barium increasing the b-wave amplitudes of rat ERG responses (Green & Kapousta-Bruneau, 1999a). Response families to a wide range of light strengths from representative experiments are illustrated in Figure 2A-D for both rods (black) and cones (red), for in vivo (A, B) and ex vivo (C, D) conditions. As recently shown by others (Green & Kapousta-Bruneau, 1999b, Heikkinen et al., 2012), we found that rod a- and b-wave amplitudes were not significantly different between in vivo and ex vivo recordings (Table 1). However, the kinetics of rod responses appeared slower and the oscillatory potentials were attenuated in ex vivo compared to in vivo responses. The inset in Fig. 2C plots in vivo and ex vivo responses to flashes estimated to produce identical number of R* exemplifying about 30% longer tp for both a-wave and b-wave in the isolated retina as compared to the live animal.
Figure 2. Comparison of rod and cone flash responses in ex vivo and in vivo conditions.
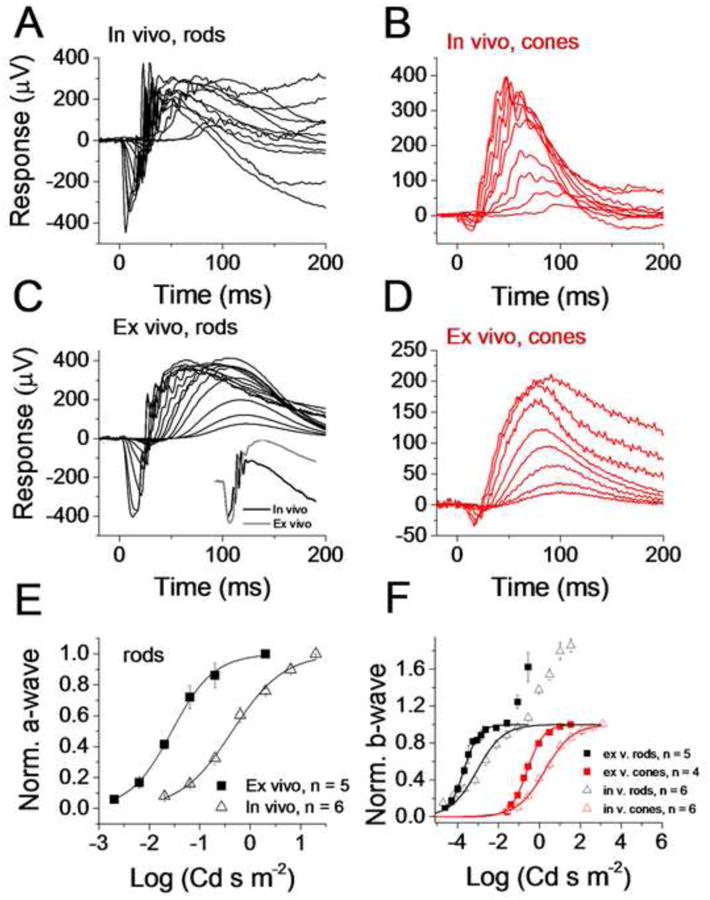
In vivo response families to short flashes of light recorded from WT rods (A) and Gnat1-/- cones (B). For rods, the flash strengths are estimated to be between 0.06 and 115,000 R* per rod. Ex vivo response families to short flashes of light recorded from WT rods (C) and Gnat1-/- cones (D) from retinas perfused with Ames medium. For rods, the flash strengths are estimated to be between 0.16 and 10,000 R* per rod. To compare rod response kinetics, the inset in panel C plots responses to flashes estimated to produce identical 10,000 R* per rod in in vivo (black trace) and ex vivo (grey trace) conditions. (E) Normalized a-wave amplitudes plotted as a function of flash strength from mouse rods in in vivo (triangles) and ex vivo (squares) recordings. The responses have been normalized by the a-wave amplitudes of responses to flash energies of 0.3 and 1.3 log(Cd s m-2) in ex vivo and in vivo conditions, respectively. Smooth lines are best-fitting functions of Eqn. (2) with E1/2 = -1.6 log(Cd s m-2) and n = 1 (ex vivo) and E1/2 = -0.4 log(Cd s m-2) and n = 0.9 (in vivo). (F) Normalized b-wave amplitudes plotted as a function of flash strength from in vivo recordings for rods (black triangles) and cones (red triangles). Same data extracted from ex vivo recordings is shown for rods (black squares) and cones (red squares). Smooth curves are the best-fit Hill-type functions (Eqn. (2)) with the following parameter values: E1/2 = -3.1 log(Cd s m-2), n = 0.68 (rods, in vivo), E1/2 = -3.7 log(Cd s m-2), n = 1.2 (rods, ex vivo), E1/2 = 0.3 log(Cd s m-2), n = 0.65 (cones, in vivo) and E1/2 = -0.6 log(Cd s m-2), n = 1.07 (cones, ex vivo).
Table 1. Rod and cone response parameters in vivo and ex vivo.
All sensitivity parameters (E1/2) are referenced to luminous energy at the cornea (in vivo) or at the retina (ex vivo). See text for conversion to photoismerizations in rods or cones in both conditions. The effect of scattered light in ex vivo recordings is factored in only for the amplification constant (bottom row). The a-wave amplitudes are the maximum amplitudes of the a-wave to bright flash measured at peak or at plateau after the peak during APB exposure. The b-wave amplitude is the difference of a-wave and b-wave peak amplitudes measured from a response to a bright flash. The amplification constant A (s-2) is given for rods and Af (μm2 s-2) is used for cones (see Methods). All values are means ± SEM. Statistically significant differences between in vivo and ex vivo recordings are indicated by * (p < 0.05). Statistical analysis was not performed for cone sensitivities or amplification constants. For rod sensitivities the statistical analysis has been performed after correcting for different light path geometries as described in Methods.
| Parameter | In Vivo Rods (n = 6) | Ex Vivo Rods (n = 5) | Ex Vivo rods, APB (n = 3) | In Vivo Cones (n = 6) | Ex Vivo Cones (n = 4) | Ex Vivo Cones, APB (n = 5) |
|---|---|---|---|---|---|---|
| a-wave amplitude (μV) | 420 ± 45 | 550 ± 80 | 350 ± 37 | 25 ± 2 | 39 ± 6 | 92 ± 3 |
| b-wave amplitude (μV) | 660 ± 80 | 920 ± 190 | - | 405 ± 20* | 200 ± 33* | - |
| E½, a-wave(log[Cd s m-2]) | -0.35 ± 0.1 | -1.4 ± 0.09 | -2.8 ± 0.03 | - | -1.0 ± 0.03 | |
| E½, b-wave(log[Cd s m-2]) | -3.0 ± 0.07* | -3.7 ± 0.06* | - | 0.1 ± 0.08 | -0.7 ± 0.05 | - |
| A or Af (s-2 or μm2 s-2) | 6.8 ± 0.8* | 12 ± 1* | 29 ± 2 | 0.19 ± 0.01 | 0.42 ± 0.02 | 0.2 ± 0.01 |
To compare cone function between in vivo and ex vivo conditions, we used Gnat1-/- mice whose rods are morphologically intact but do not respond to light. This simplifies the isolation of small cone responses that would be otherwise masked by large rod responses. However, it is also possible to isolate cone responses in WT mouse by using rod saturating pre-flash or background light (Heikkinen et al., 2008, Jaissle, et al., 2001, Nikonov, et al., 2006). Our cone recordings demonstrate a remarkable resemblance with respect to a- and b-wave amplitudes between ex vivo and in vivo conditions as well as comparable but somewhat slower kinetics ex vivo (Figs. 2B and D, Table 1). Although the maximum ex vivo cone b-wave amplitudes were smaller on average (p < 0.05), in our best preparations they were similar to those recorded in vivo (Table 1). As in the rod recordings, photopic oscillatory potentials were attenuated or absent in ex vivo recordings.
The comparison of rod and cone sensitivity between in vivo and ex vivo recordings is hampered by the different optical light path geometries in these two conditions. Figure 2E shows rod a-wave amplitudes as a function of stimulus strength produced by the same LED ganzfeld in in vivo (triangles) and ex vivo (squares) situations. To facilitate comparison of rod physiology, we normalized the responses to their amplitudes prior to a secondary increase due to cone contribution and possibly other ERG components (see 3.2). It is clear that much dimmer stimuli were needed to elicit a threshold or to saturate the rod a-waves ex vivo (see also Table 1). However, based on Eqn. (2) with its previously published parameter values, we estimated that rod outer segments ex vivo receive about one log-unit more light compared to in vivo experiments in our recording geometries (see 2.5). After correcting for the different light path geometry, the half-saturating flash energies reported in Table 1 were similar between ex vivo and in vivo recordings.
Figure 2F shows population-averaged b-wave amplitudes as a function of flash strength for rods (black symbols) and cones (red symbols), for in vivo (open symbols) and ex vivo (filled symbols) recordings. The rod data was normalized to the first plateau before b-wave amplitudes started to increase further at brighter light intensities, possibly due to cone contribution (see also 4.2). Again, the saturation of b-waves was reached with dimmer light flashes in ex vivo as compared to in vivo conditions. However, this difference vanished at the threshold for rods. Indeed, taking into account the differences in light path geometry, in vivo b-waves were more sensitive across the whole stimuli range. The cone b-wave amplitude data also showed a leftward shift in isolated retina recordings compared to in vivo conditions. This is surprising as cone outer segments should receive more photons in in vivo conditions (see 2.5). The discrepancy might be at least partially explained by the overestimation of the cone funneling factor in vivo, as discussed below. Interestingly, the b-wave intensity-response relations were steeper ex vivo compared to those in vivo for both rods and cones. We quantified this by fitting Eqn. (3) to the data from individual experiments by assuming that the Hill coefficient n is similar across experiments. The n increased from 0.6 in vivo to 1.2 ex vivo for rods and from 0.7 to 1.1 for cones.
3.2 Isolation of Rod and Cone Photoreceptor Responses Ex Vivo and In Vivo with Synaptic Blockers
Transretinal ERG has recently proven its power in studying photoreceptor function in the mouse retina. One of the reasons is that synaptic blockers can easily be applied in the perfusion to isolate the photoreceptor component. It is also possible to inject these blockers intravitreally but that requires expertise and special equipment. The injections also can have potentially harmful effects such as cornea damage and retina detachment. Another approach that would help to dissect the photoreceptor response in vivo is to use mutant mice with defects in synaptic transmission, such as nob mice (Pardue, et al., 1998). However, this would require deriving any mutant mouse of interest in the nob background, adding time and expense to this approach. Figures 3A and 3B show flash response families recorded in isolated retinas from rods and cones, respectively, isolated with 50 μM DL-AP4 (APB) and 50 μM BaCl2 in the perfusion. For comparison, we also performed a limited number of in vivo recordings where we intravitreally injected one eye with ∼1 μl of 26.7 mM DL-AP4 in PBS (∼1.3 mM vitreal concentration) and the other eye with PBS only (compare solid and dashed traces in Figures 3C and 3D). DL-AP4 effectively removed the positive b-wave component both in vivo and ex vivo although sometimes a small overshoot persisted in both rod and cone (indicated by red arrow in Figure 3D) responses. Comparison of the rod responses recorded from PBS- and APB-injected eyes to identical flash strengths revealed that the leading edge of responses remained unaffected by APB treatment (Fig. 3C). The leading edge kinetics, and thus the amplification of rod phototransduction, was also not affected by APB in ex vivo recordings (see also Fig. 4). In response to bright flashes a fast transient negative component persisted in rod responses that could not be explained by cone contribution. Implications of this transient peak (“nose”) typically observed in rod and sometimes in cone responses are discussed in more detail below. Low SNR did not allow us to accurately compare the leading edges of cone responses under similar conditions (Figure 3D).
Figure 3. Comparison of rod and cone a-waves isolated with DL-AP4 in ex vivo and in vivo conditions.
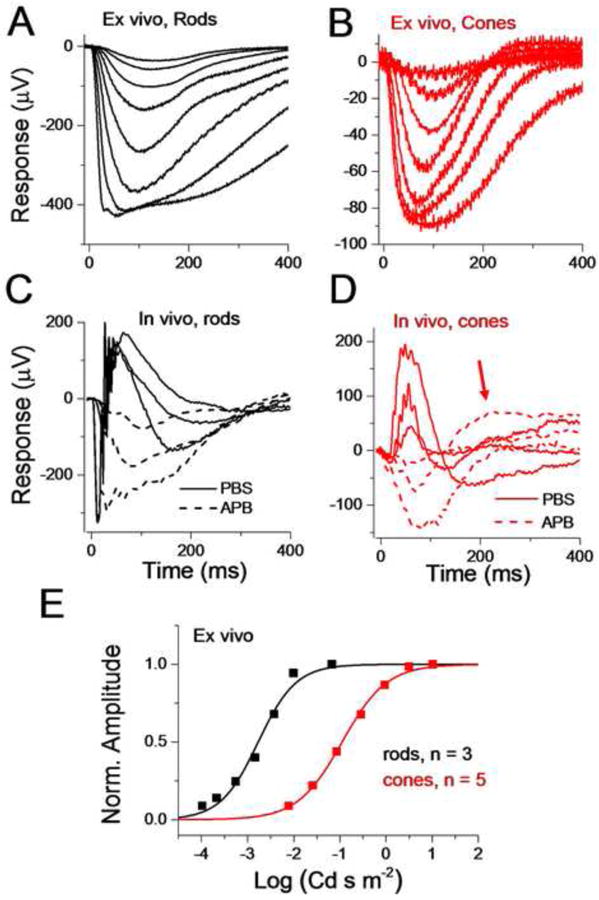
Rod (A) and cone (B) response families recorded from isolated retina perfused with Ames solution supplemented with DL-AP4 and BaCl2. Data is shown as mean ± SEM. Flash energies ranged from -4.0 to -1.2 log(Cd s m-2) for rods and from -2.1 to +1.0 log(Cd s m-2) for cones. (C) In vivo ERG responses recorded from PBS-injected (solid lines) and APB-injected (dashed lines) eyes to identical flash strengths. (D) Similar experiment as in C but performed with Gnat1-/- mouse. The red arrow indicates an overshoot that was sometimes seen even after APB-injections. (E) Normalized response amplitudes at tp plotted as a function of flash strengths that were used in experiments similar to those shown in A and B for rods and cones, respectively. Fitting with the Eqn. (2) yielded E1/2 = -2.8 log(Cd s m-2) and n = 1 for the rod data and E1/2 = -1.0 log(Cd s m-2) and n = 0.9 for the cone data.
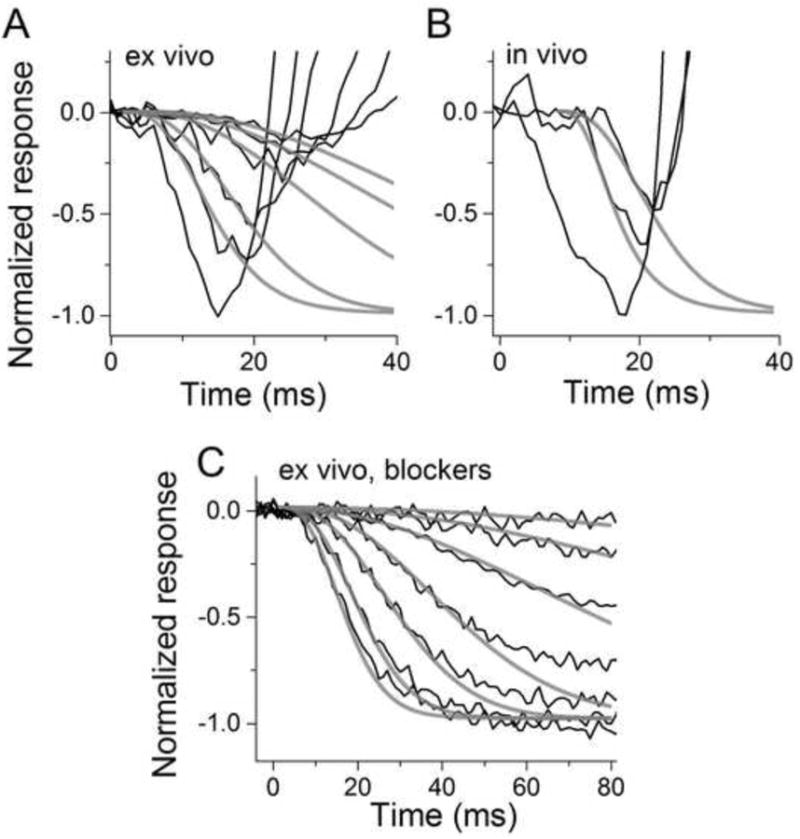
Figure 4. Determination of the rod amplification constant in ex vivo and in vivo conditions.
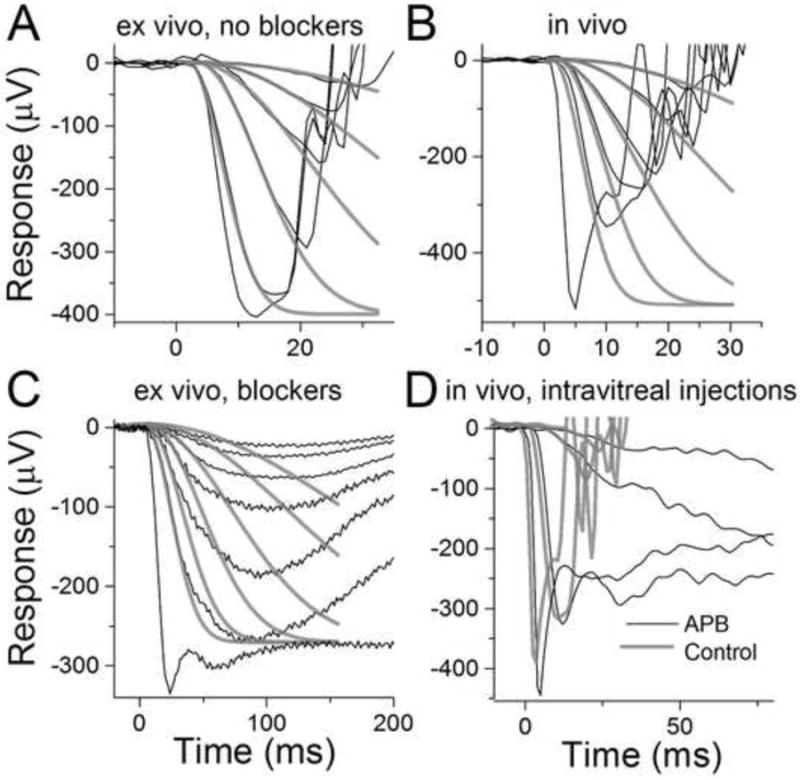
(A) Responses to flashes ranging from -2.6 to 0 log(Cd s m-2) of green light recorded from isolated retina. Grey traces show individual fits of the LP model with td = 2 – 3 ms and A = 11 ± 0.4 s -2 (mean for the 4 dimmest flashes). The rmax has been set to the amplitude of the response to the brightest flash. The A started to decline with flashes exceeding about -0.5 log(Cd s m-2) and was 5.0 s-2 in this retina for the second brightest flash (E = -0.5 log(Cd s m-2)). (B) Responses to flashes of green light ranging from -1.0 to 1.0 log(Cd s m-2) and with bright white xenon flash (20 dB) recorded from WT mouse in vivo. Grey traces show the best-fitting LP model functions with td = 2-3 ms and A = 6.0 ± 0.2 s -2 (mean for the 4 dimmest flashes). The rmax was set to the amplitude of the bright 20 dB flash response. The A started to decline with flashes exceeding about 0.5 log(Cd s m-2) and was 4.6 s-2 for this mouse with E = 1.0 log(Cd s m-2). (C) Responses to flashes from -3.7 to -1.0 log(Cd s m-2) of green light recorded from isolated retina exposed to 50 μM DL-AP4. Fittings of the LP model to the four dimmest flash responses gave A = 32 ± 2 s-2 (mean for the six individual fits) when rmax was set to plateau level after the initial peak. (D) Dark-adapted flash responses recorded simultaneously after intravitreal injection of PBS (grey, left eye) and DL-AP4 in PBS (black, right eye) in WT mouse eyes.
The overall kinetics and sensitivity of our pharmacologically isolated transretinal responses were similar to those obtained from single cells (Calvert et al., 2000, Nikonov et al., 2006, Tsang, et al., 1998). However, some subtle differences are evident. For instance, the average time-to-peak was ca. 120 ms for WT rods and ca. 80 ms for cones from Gnat1-/- mice, both somewhat faster compared to those in single-cell recordings. On the other hand, in vivo dim flash responses isolated with APB were even faster than ex vivo responses peaking at about 90 ms and 60 ms for rods and cones, respectively. This suggests a general trend of deceleration of physiological processes when the integrity of the system is reduced from the in vivo environment to isolated retina and further to single cells. Figure 3E shows the ex vivo population-averaged normalized intensity-response data for rods and cones. Half-saturating flash intensities were -2.8 and -1.0 log (Cd s m-2) for rods and cones, respectively. By converting these values to average number of pigment photoisomerizations (see 2.5) per rod (R*) or cone (C*) we estimate that rods needed 17 R* and cones 112 C* to produce a half-saturating response.
3.3 Comparison of Rod and Cone Signal Amplification between In Vivo and Ex Vivo Conditions
The kinetics of the early rising phase of the ERG signal has been used to derive the molecular gain of rod and cone activation reactions in both ex vivo and in vivo situations. For rods, this amplification constant seems to be invariant across different experimental conditions, from single-cell recordings to in vivo recordings (Breton, et al., 1994, Heikkinen et al., 2008, Lyubarsky et al., 2004, Nikonov, et al., 2005). Figures 4A and 4B show fittings of the model introduced by Lamb and Pugh (LP model, Lamb & Pugh, 1992) to responses recorded from WT mice in vivo and ex vivo, respectively. On average, we found that the amplification constant (A) was 6.8 ± 1 and 12 ± 1 s-2 as extracted from in vivo and ex vivo recordings, respectively. These amplification values are comparable to previously published results from mouse rods obtained with in vivo, ex vivo, or single cell recordings (Heikkinen et al., 2008, Lyubarsky et al., 2004, Nikonov et al., 2005).
Although the analysis of ERG data yields consistent values for A, it still remains unclear if its absolute value represents the true molecular gain of phototransduction activation reactions. Indeed, our analysis yielded somewhat different values for A from in vivo and ex vivo recordings. One complication for this analysis is the choice of maximal a-wave amplitude because it is largely masked by the b-wave. Thus, choosing for instance a 2 times larger rmax would yield 2-fold smaller A. We attempted to determine the proper choice of rmax by comparing the values of A obtained from transretinal recordings with or without APB in the perfusion as well as from in vivo ERG recordings from eyes that where injected with APB-free or APB-containing PBS. Figure 4D illustrates in vivo responses to bright flashes from a control eye (gray) and APB-injected eye (black). Although the b-wave is removed by APB, it is evident that a substantial early transient peak still remains. In all four experiments performed, the peak amplitude of bright flash response in control and APB-injected eyes matched quite well. This observation suggests that following bright flashes it is not the b-wave that masks the peak of the negative-going a-wave. Analysis of the kinetics of the positive-going part of the cat ERG signal has led to the same conclusion (Kang Derwent & Linsenmeier, 2001). This finding might have important implications on the choice of the response normalization when determining the amplification constant. If the plateau level after the peak describes better the saturation level of outer segment current, then the normalization to the nose amplitude would yield substantial underestimation of the amplification constant. Since injections themselves caused desensitization and somewhat reduced amplification in our hands, we analysed the amplification constant from responses recorded from isolated retina in presense of APB which did not affect the leading edge kinetics in ex vivo conditions (this was found by comparing traces from Figures 2C and 3A). Figure 4C illustrates fitting of the LP model with rmax set to the plateau level after the initial peak present in bright flash responses. Average results from 4 retinas yielded over 2-fold increase of rod amplification constant determined in this way compared to the analysis performed as in Figure 4A (see Table 1). The a-wave appeared to saturate at much lower intensities ex vivo than in vivo where the early peak seems to be more pronounced and probably leads to a substantial overestimation of the rmax that would describe the proper rod photoresponse saturation (see Robson & Frishman, 2014). The fact that in this study we normalized to the a-wave amplitude at very bright flash in vivo (as is customary, see Figure 4B) probably explains why we observed a smaller rod amplification constant in vivo as compared to that determined from ex vivo responses.
Determination of cone phototransduction amplification in vivo (and ex vivo) is complicated by several factors. The cone a-wave amplitude is very small, the b-wave intrusion (and phototransduction inactivation) come into play at very early times, and calibration of pigment isomerization is approximate at best. In addition, the extent of light funneling, which cannot be quantified accurately, might affect the estimated value of A for cones by several fold. Recent results from single-cell recordings and ex vivo recordings have suggested that the gain of mouse cone phototransduction activation reactions is quite similar to that in rods (Heikkinen et al., 2008, Lyubarsky et al., 2002, Nikonov et al., 2006). In addition in vivo recordings have also suggested that A is similar in rods and cones (Smith & Lamb, 1997). However, the value of cone amplification in vivo is highly dependent on the estimation of the funneling factor (Lyubarsky et al., 1999, Schnapf, et al., 1990, Smith & Lamb, 1997). To address this issue, we compared the cone amplification from ex vivo and in vivo ERG flash responses of Gnat1-/- mice. Figure 5A shows a response family recorded from isolated retina to flashes exceeding -2 log(Cd s m-2). In this range a small a-wave is evident even without using any blockers in the perfusion. The LP model convolved with the function to account for the rather large membrane time constant of cones were used as described in 2.6. The average amplification parameter referenced to the light energy measured at the cornea in vivo or at the retina ex vivo, Af (Af = αc * A μm2 s-2), was 0.4 μm2 s-2 when determined ex vivo in Ames medium and 0.2 μm2 s-2 as derived from in vivo recordings (see Figures 5A, 5B, and Table 1). Interestingly, we found that Af determined ex vivo in the presence of DL-AP4 and BaCl2 (Figure 5C) was over two times smaller compared to that derived from responses recorded in the absence of blockers (Figure 5A). This may be due to the choice of normalization of the responses. For in vivo and ex vivo recordings, in the absence of synaptic blockers we set the maximal cone amplitude to the peak of a very bright flash response. It is, however, possible that the b-wave interferes at early times and the actual maximal response of the cone photoreceptors would be larger than that observable in the ERG recordings without synaptic blockers. This hypothesis is supported by the doubling of the cone a-wave amplitude in the presence of blockers in ex vivo recordings (see Table 1). Our limited number of in vivo experiments with intravitreal injections of APB also indicated clearly that the maximal cone photoreceptor response (fast PIII) amplitude might be significantly larger than that determined at the peak of a bright flash response in the absence of blockers (see Figure 3D). The conversion of Af into A is simple ex vivo where the funneling of cone inner segments is absent. Using a cone collection area of 0.07 μm 2, we estimate that the cone amplification constant in our ex vivo conditions is 6 s-2 and 2.8 s-2 when determined in the absence or presence of APB, respectively. Assuming a funneling factor of 7 (Lyubarsky et al., 1999) yields A = 1.4 s-2 when extracted from in vivo recordings with Gnat1-/- mice.
Figure 5. Determination of the cone amplification constant under different conditions from Gnat1-/- mice.
Ex vivo: (A) The black traces show the recorded flash responses to stimulus energies from -1.0 to 1.5 log(Cd s m-2) of green light. Grey traces are LP model functions with td = 2 ms and Af = 0.77 ± 0.06 μm2 s-2 (mean of the best-fitting value for each trace ± SEM). A convolution to account for the membrane time constant τ = 5 ms was used when the flash energy was between -0.5 and 0.5 log(Cd s m-2) but not for the two dimmest flashes. In vivo: (B) Convoluted version (τ = 5 ms) of the LP activation model with Af = 0.2 μm2 s-2 (no correction for eye optics, see text) gave the best fit to these representative responses. Flash energies were 1.0 and 1.5 log(Cd s m-2) for green light, and 20 dB for xenon flash. Ex vivo with blockers: (C) Black traces show dark-adapted cone responses recorded from a retina perfused with Ames medium containing DL-AP4 and BaCl2. Green light flash energies ranged from -2.1 to 1.0 log(Cd s m-2). Grey traces show the best-fitting LP activation model functions where convolution has been used for the four brightest flashes. The average best-fitting Af for the five dimmest flashes was 0.28 ± 0.02 μm2 s-2. Above 0 log (Cd s m-2) Af started to decrease, and was found to be 0.2 and 0.12 μm2 s-2 for 0.5 and 1.0 log (Cd s m-2), respectively, for this retina.
4. Discussion
4.1 Advantages and Potential Applications for the Ex Vivo ERG Adapter
The ex vivo ERG adapter (Figures 1, S1 and S2) was designed to be used as easily as possible together with any commercial in vivo ERG apparatus. It makes use of all electronics, software, and the light stimulation of the commercial system, to minimize the cost of the ex vivo system. These features should facilitate the implementation of this useful technique by more laboratories. Our results on C57Bl/6 and Gnat1-/- mice demonstrate that our ex vivo system can be used to assess retinal function by monitoring both ERG a- and b-waves for time periods exceeding several hours. We also find that the general characteristics of a- and b-waves are well preserved in isolated retina preparations. The transretinal ERG recordings have many advantages over standard in vivo recordings. First, isolation of the retina leads to removal of most of the physiological noise caused by breathing or cardiac activity of the animal. Second, the ex vivo recordings are more stable than those performed in vivo because they require neither prolonged anesthesia nor repetitive lubrication of the eyes for proper electrode contact. In addition, the ex vivo ERG technique provides an easy and efficient way to test the effects of broad spectrum of drugs on photoreceptors, synaptic transmission, and overall retinal function. Further, the use of the adapter is not restricted to mouse retina but is applicable to other species including amphibians, fish, primates and other mammals. The system also makes possible recordings from freshly dissected human retina. Finally, this method also allows easy manipulation of the temperature to study its effects on physiological processes within the retina. In this study, we demonstrate an effective way to isolate mouse rod and cone photoresponses pharmacologically to dissect photoreceptor function in the retina. Thus, this method should facilitate and advance the research of retinal physiology, understanding visual disorders, and developing treatments for blinding diseases.
4.2 Correspondence of the Ex Vivo Environment to Physiological In Vivo Conditions
In our present study we used the same light stimulation and data acquisition system for in vivo and ex vivo ERG recordings to facilitate the comparison between the two conditions. To validate the proper functionality of our easy-to-use ex vivo adapter, we compared mouse rod and cone responses from in vivo and ex vivo recordings. We chose commercially available bicarbonate buffered Ames perfusion medium as it has been shown to support all retinal cells for extended periods. Both retinas were used for simultaneous recordings immediately after their isolation, by using a double-retina specimen holder. Consistent with previous studies (Green & Kapousta-Bruneau, 1999b, Heikkinen et al., 2012), both rod and cone ERG a- and b-waves had amplitudes and kinetics comparable to those determined from in vivo recordings (Figure 2). However, the kinetics assessed by the tp of either the a-wave or b-wave tended to be slightly slower ex vivo where oscillatory potentials were often attenuated or absent as well (Figure 2C). Our ex vivo responses remained still faster when compared to single cell recordings suggesting a general trend of response slowdown by isolation process of the retina and cells. It is possible that isolation of the retina from RPE damages rod and cone outer segments and/or that the conditions for the isolated retina are sub-optimal. Indeed, as illustrated in the supplementary Fig. S3, barium used to remove slow PIII component, appeared to affect the sensitivity of rod signaling pathway. However, it is hard to distinguish whether the effects of barium are due to removing the slow PIII or due to altered rod signaling. In our hands, the intravitreal injections of barium (1 μL of 27 mM BaCl2 in PBS) completely abolished in vivo ERG responses leaving us unable to compare them to those recorded from isolated retina.
A striking difference between the in vivo and ex vivo ERG signals became evident after blocking metabotropic glutamategic synaptic transmission with DL-AP4. In ex vivo signals this treatment revealed a very large slow negative glial PIII component, especially in response to bright flashes (data not shown in this paper but see the inset of Figure 3 in Heikkinen et al., 2012). In all of the data shown here (except in Supplementary Figure S3), the glial component was removed by exogenous application of BaCl2. However, in vivo flash responses lacked this component even when only DL-AP4 (and not BaCl2) was injected intravitreally (Figures 3C and 4D). There can be at least two factors contributing to this difference. First, the isolation process of the retina from the rest of the eye and pigment epithelium might alter some ERG response components. Second, it is possible that perfusing only the photoreceptor side of the retina is not optimal for maintaining inner retina function.
The determination of sensitivity of individual cells or pathways in the retina is complicated by a number of factors. The in vivo ERG is a non-invasive method to probe retinal function but several overlapping signal components hamper the analysis of individual processes. In addition, it is not straightforward to calculate the amount of photons that are eventually absorbed by photoreceptor outer segments in the intact eye. On the other hand, it is unclear whether the sensitivity of photoreceptors is preserved during the isolation of the retina. In this study, we addressed this question by comparing the sensitivities of rod and cone ERG a- and b-waves from in vivo and ex vivo experiments in the mouse retina. For rods, the calculation of rhodopsin isomerizations is more straightforward in both conditions (Heikkinen et al., 2008, Lyubarsky et al., 2004). In accordance with previously published results, we found that the rod a-wave sensitivity as well as phototransduction amplification were preserved ex vivo. However, the rod b-wave sensitivity, especially near its threshold, was reduced in ex vivo as compared to in vivo recordings. In addition, the operating range determined from b-wave responses seemed to be suppressed in our ex vivo recordings (Figure 2F). One possible explanation for this difference might be a glial component opposing the increase of the b-wave in brighter light and thus expanding the apparent range of b-wave amplitudes in vivo where we did not use barium to remove the glial component. However, as shown in Supplementary Figure S3 removal of BaCl2 from the perfusion ex vivo did not affect significantly the slope of the b-wave amplitudes plotted against flash strength in the range thought to represent rod signaling (the data points before the first plateau in Figure S3). In addition, it seems that the glial component is not that prominent for in vivo recordings based on the lack of a slow negative wave in the bright flash responses recorded from APB-injected eyes of anesthetized animals (Figure 3C). The half-saturating b-wave both in our in vivo and ex vivo conditions is about 1 R* per rod (Figure 2F and Table 1) which is consistent with direct recordings from mouse rod bipolar cells (Sampath & Rieke, 2004). Interestingly, our ex vivo data showed much steeper increase of b-wave amplitudes as a function of flash energy when compared to in vivo data (Figure 2F). The reason for this difference is unclear but it is possible that the slower b-wave recovery phase (compare e.g. cone b-waves between Figures 2B and 2D) in ex vivo compared to in vivo conditions contributes to this phenomenon.
One additional complication to the quantitative analysis of the rod ERG signals both in vivo and ex vivo is the fast negative peak (“nose” component) observed in pharmacologically isolated a-wave (Arden, 1976, Robson & Frishman, 2014, Vinberg, et al., 2009). This component becomes larger upon increasing flash intensity even after rod photocurrent is saturated, as evident by the plateau level after the peak (Figures 3C and 4C). It is possible that the biphasic nature of dark-adapted a- or b-waves when plotted as a function of flash strength (see Figure 2F) might not represent simply rod and cone responses but also the rod-originating peak component as suggested recently (Robson & Frishman, 2014). As discussed below, the resulting overestimation of rmax would also lead to underestimation of the rod amplification constant, A.
The comparison of cone sensitivity and their synaptic transmission between in vivo and ex vivo environments is complicated by the conversion of the luminous energy into cone pigment isomerizations. It has been suggested that cone inner segments and Müller cells act as light guides to increase the amount of photons reaching the cone outer segments in vivo (Agte, et al., 2011, Franze, et al., 2007, Labin & Ribak, 2010, Lyubarsky et al., 1999, Schnapf et al., 1990). However, the extent of the guiding effect has not been directly measured. In our ex vivo recording geometry, light comes from the photoreceptor side and is exempt from this effect. Based on the geometry of mouse cone photoreceptors, the light funneling by cone inner segments could increase the photon capture by a factor of 7 (Lyubarsky et al., 1999). An additional complication arises from the rod shadowing effect in our ex vivo recording geometry where light is partially absorbed by rhodopsin molecules in rods before reaching the cone outer segments. By taking into account previously suggested magnitudes of light guiding in vivo and light shadowing by rods ex vivo (decrease photon capture of cones by 1.4 –fold ex vivo), we conclude that cone outer segments should actually receive more photons in vivo than ex vivo under identical stimulation conditions such as the 530 nm LED ganzfeld used in this study. This means that, differently from rods, where identical stimuli are sensed brighter ex vivo compared to in vivo, cones in the isolated retina should be more sensitive to identical light stimulation in in vivo conditions. As cone amplification constant of phototransduction is expected to be preserved most consistently across different recording conditions, we estimate that identical A in both in vivo and ex vivo conditions requires a funneling factor of 2.7.
4.3 Comparison of Molecular Amplification of Rod and Cone Phototransduction Activation Reactions between In Vivo and Ex Vivo Conditions
The nose peak also affects the normalization choice for the rod amplification constant analysis both in vivo and ex vivo, when synaptic blockers are not used. Our results suggest that the maximum response amplitude might contain a substantial contribution from the nose component. When this parameter is set as the peak of the a-wave at the nose level, the determination of rod amplification constant ex vivo yields ∼2-fold lower A-values as compared to those obtained by normalization to the plateau level of the photoresponse. In our conditions, this generates a corrected amplification constant of about 29 s-2 for rods (see Table 1). Thus, it is possible that the real molecular amplification constant of rods in vivo (or ex vivo) is over two times larger than previously thought (see Fig. 4C, 4D, and Table 1).
Cones are less sensitive and operate under brighter light compared to rods. Correspondingly, it would be logical for cones to have a lower gain of phototransduction. Indeed, it has been shown that cones in eastern chipmunk have significantly lower amplification of phototransduction as compared to their rods (Zhang, et al., 2003). However, other studies suggested that the amplification constants of mouse and human rods and cones are comparable (Heikkinen et al., 2008, Nikonov et al., 2006, Smith & Lamb, 1997). As discussed above, several factors complicate the determination of the cone amplification constant. Here, we used Gnat1-/- mice whose rods do not respond to light to facilitate the extraction of a truly dark-adapted cone responses in both in vivo and ex vivo settings. Nikonov et al., 2006 showed by single-cell recordings that cones of Gnat1-/- mice have close to normal cone amplification constant (AWT,cone = 3 s-2, AGnat1-/-, cone = 2 s-2). Hence, our amplification constant values should be comparable to those of WT cones under the same experimental conditions. Our results indicate that the amplification constant of Gnat1-/- mouse cones is between 1.4 s-2 (f = 7) and 10 s-2 (f = 1) in vivo and ca. 6 s-2 to 3 s-2 in ex vivo conditions (in the presence of APB) when the collection area of the cone outer segment was assumed to be 0.07 μm2. Overall, our results suggest that the molecular amplification in mouse cones might be indeed lower compared to that in rods. A potential complication could be that part of the negative dim-flash a-wave in Gnat1-/- ERG recordings might be generated by off-bipolar cells rather than by cone photoreceptors. However, our present results as well as a previous study (Lyubarsky et al., 2002) demonstrate that cone amplification constants determined from ERG and single cell recordings (Nikonov et al., 2006) are comparable, indicating that the leading edge of the a-wave describes well the activation of the cone phototransduction in Gnat1-/- mice.
Supplementary Material
Supplementary Figure S1. General sketch of the ex vivo adapter. Double-retina (retinas shown as red circles) specimen holder (green) is on the heating pad where the mouse would be placed for in vivo recordings. A brass heat exchanger (brown) on the same heating pad heats the perfusion solution fed by gravity from the top of the LKC stimulator unit. The perfusion solution bottle is placed in the water bath filled with metallic beads. A flow rate valve is used to adjust the perfusion rate to about 3 mL/min. Specimen holder's electrodes (see Fig. 2) are connected to the LKC unit's amplifier channels 1 and 2. The Faraday cage is electrically connected to the ground pin of the amplifier.
Supplementary Figure S2. Drawings of double-retina specimen holder. Top view (A) and side view (B) of the top part of the specimen holder. Top view (C) and side view (D) of the bottom part of the specimen holder.
Figure S3: Effect of Ba2+ on b-wave responses in ex vivo experiment. Light responses to flashes ranging from 0.26 to 4,700 R* per rod recorded from the same retina before (A) and after (B) application of barium. (C) The b-wave response amplitudes are plotted before (red) and after (black) application of 100 μM BaCl2 as a function of flash strength in R* per rod. Eqn. (3) is fitted to the data points with E1/2 = 2.0 R* and n = 1.3 (100 μM Ba2+) and E1/2 = 3.6 R* and n = 1.5 (no barium). The insets show the raw responses in the absence (red) and presence (black) of barium.
Commercial in vivo ERG system can be used for transretinal rod and cone recordings
Rod and cone ERG a- and b-waves are comparable in ex vivo and in vivo recordings
Flash responses are slower and the oscillatory potentials are attenuated ex vivo
The estimated amplification constant is >2-fold larger in mouse rods than in cones
Light funneling in vivo might account for ∼3-fold increased photon capture in cones
Acknowledgments
We thank Dr. Ari Koskelainen and Dr. Hanna Heikkinen (Aalto University) for valuable comments on the manuscript. This work was supported by NIH grants EY019312 and EY021126 (VJK), EY002687 to the Department of Ophthalmology and Visual Sciences at Washington University, and by Research to Prevent Blindness.
Abbreviations
- ERG
electroretinography
- Gnat1
rod G protein transducin
- SNR
signal-to-noise ratio
- LED
light-emitting diode
- DL-AP4 or APB
DL-2-Amino-4-phosphonobutyric acid
- PBS
phosphate-buffered saline
Footnotes
Disclosures: Washington University in St. Louis has a license agreement with Xenotec, Inc. and may receive a royalty from the sale of the ex vivo adapter.
Publisher's Disclaimer: This is a PDF file of an unedited manuscript that has been accepted for publication. As a service to our customers we are providing this early version of the manuscript. The manuscript will undergo copyediting, typesetting, and review of the resulting proof before it is published in its final citable form. Please note that during the production process errors may be discovered which could affect the content, and all legal disclaimers that apply to the journal pertain.
References
- Agte S, Junek S, Matthias S, Ulbricht E, Erdmann I, Wurm A, Schild D, Kas JA, Reichenbach A. Muller glial cell-provided cellular light guidance through the vital guinea-pig retina. Biophys J. 2011;101(11):2611–2619. doi: 10.1016/j.bpj.2011.09.062. [DOI] [PMC free article] [PubMed] [Google Scholar]
- Arden GB. Voltage gradients across the receptor layer of the isolated rat retina. J Physiol. 1976;256(2):333–360 331. doi: 10.1113/jphysiol.1976.sp011328. [DOI] [PMC free article] [PubMed] [Google Scholar]
- Armington JC, Bloom MB. Relations between the amplitudes of spontaneous saccades and visual responses. J Opt Soc Am. 1974;64(9):1263–1271. doi: 10.1364/josa.64.001263. [DOI] [PubMed] [Google Scholar]
- Boye SE, Boye SL, Lewin AS, Hauswirth WW. A comprehensive review of retinal gene therapy. Mol Ther. 2013;21(3):509–519. doi: 10.1038/mt.2012.280. [DOI] [PMC free article] [PubMed] [Google Scholar]
- Breton ME, Schueller AW, Lamb TD, Pugh EN., Jr Analysis of ERG a-wave amplification and kinetics in terms of the G-protein cascade of phototransduction. Invest Ophthalmol Vis Sci. 1994;35(1):295–309. [PubMed] [Google Scholar]
- Brockway LM, Benos DJ, Keyser KT, Kraft TW. Blockade of amiloride-sensitive sodium channels alters multiple components of the mammalian electroretinogram. Vis Neurosci. 2005;22(2):143–151. doi: 10.1017/S0952523805222034. [DOI] [PubMed] [Google Scholar]
- Calvert PD, Krasnoperova NV, Lyubarsky AL, Isayama T, Nicolo M, Kosaras B, Wong G, Gannon KS, Margolskee RF, Sidman RL, Pugh EN, Jr, Makino CL, Lem J. Phototransduction in transgenic mice after targeted deletion of the rod transducin alpha -subunit. Proc Natl Acad Sci U S A. 2000;97(25):13913–13918. doi: 10.1073/pnas.250478897. [DOI] [PMC free article] [PubMed] [Google Scholar]
- Dalke C, Graw J. Mouse mutants as models for congenital retinal disorders. Exp Eye Res. 2005;81(5):503–512. doi: 10.1016/j.exer.2005.06.004. [DOI] [PubMed] [Google Scholar]
- Donner K, Hemila S, Koskelainen A. Temperature-dependence of rod photoresponses from the aspartate-treated retina of the frog (Rana temporaria) Acta Physiol Scand. 1988;134(4):535–541. doi: 10.1111/j.1748-1716.1998.tb08528.x. [DOI] [PubMed] [Google Scholar]
- Frank RN, Dowling JE. Rhodopsin photoproducts: effects on electroretinogram sensitivity in isolated perfused rat retina. Science. 1968;161(3840):487–489. doi: 10.1126/science.161.3840.487. [DOI] [PubMed] [Google Scholar]
- Franze K, Grosche J, Skatchkov SN, Schinkinger S, Foja C, Schild D, Uckermann O, Travis K, Reichenbach A, Guck J. Muller cells are living optical fibers in the vertebrate retina. Proc Natl Acad Sci U S A. 2007;104(20):8287–8292. doi: 10.1073/pnas.0611180104. [DOI] [PMC free article] [PubMed] [Google Scholar]
- Govardovskii VI, Fyhrquist N, Reuter T, Kuzmin DG, Donner K. In search of the visual pigment template. Vis Neurosci. 2000;17(4):509–528. doi: 10.1017/s0952523800174036. [DOI] [PubMed] [Google Scholar]
- Granit R. The components of the retinal action potential in mammals and their relation to the discharge in the optic nerve. J Physiol. 1933;77(3):207–239. doi: 10.1113/jphysiol.1933.sp002964. [DOI] [PMC free article] [PubMed] [Google Scholar]
- Green DG, Kapousta-Bruneau NV. A dissection of the electroretinogram from the isolated rat retina with microelectrodes and drugs. Vis Neurosci. 1999a;16(4):727–741. doi: 10.1017/s0952523899164125. [DOI] [PubMed] [Google Scholar]
- Green DG, Kapousta-Bruneau NV. Electrophysiological properties of a new isolated rat retina preparation. Vision Res. 1999b;39(13):2165–2177. doi: 10.1016/s0042-6989(98)00318-6. [DOI] [PubMed] [Google Scholar]
- Gurevich L, Slaughter MM. Comparison of the waveforms of the ON bipolar neuron and the b-wave of the electroretinogram. Vision Res. 1993;33(17):2431–2435. doi: 10.1016/0042-6989(93)90122-d. [DOI] [PubMed] [Google Scholar]
- Heikkinen H, Nymark S, Koskelainen A. Mouse cone photoresponses obtained with electroretinogram from the isolated retina. Vision Res. 2008;48(2):264–272. doi: 10.1016/j.visres.2007.11.005. [DOI] [PubMed] [Google Scholar]
- Heikkinen H, Vinberg F, Pitkanen M, Kommonen B, Koskelainen A. Flash responses of mouse rod photoreceptors in the isolated retina and corneal electroretinogram: comparison of gain and kinetics. Invest Ophthalmol Vis Sci. 2012;53(9):5653–5664. doi: 10.1167/iovs.12-9678. [DOI] [PubMed] [Google Scholar]
- Jaissle GB, May CA, Reinhard J, Kohler K, Fauser S, Lutjen-Drecoll E, Zrenner E, Seeliger MW. Evaluation of the rhodopsin knockout mouse as a model of pure cone function. Invest Ophthalmol Vis Sci. 2001;42(2):506–513. [PubMed] [Google Scholar]
- Kang Derwent JJ, Linsenmeier RA. Intraretinal analysis of the a-wave of the electroretinogram (ERG) in dark-adapted intact cat retina. Vis Neurosci. 2001;18(3):353–363. doi: 10.1017/s0952523801183021. [DOI] [PubMed] [Google Scholar]
- Kolesnikov AV, Tang PH, Parker RO, Crouch RK, Kefalov VJ. The mammalian cone visual cycle promotes rapid M/L-cone pigment regeneration independently of the interphotoreceptor retinoid-binding protein. J Neurosci. 2011;31(21):7900–7909. doi: 10.1523/JNEUROSCI.0438-11.2011. [DOI] [PMC free article] [PubMed] [Google Scholar]
- Labin AM, Ribak EN. Retinal glial cells enhance human vision acuity. Phys Rev Lett. 2010;104(15):158102. doi: 10.1103/PhysRevLett.104.158102. [DOI] [PubMed] [Google Scholar]
- Lamb TD, Pugh EN., Jr A quantitative account of the activation steps involved in phototransduction in amphibian photoreceptors. J Physiol. 1992;449:719–758. doi: 10.1113/jphysiol.1992.sp019111. [DOI] [PMC free article] [PubMed] [Google Scholar]
- Lyubarsky AL, Daniele LL, Pugh EN., Jr From candelas to photoisomerizations in the mouse eye by rhodopsin bleaching in situ and the light-rearing dependence of the major components of the mouse ERG. Vision Res. 2004;44(28):3235–3251. doi: 10.1016/j.visres.2004.09.019. [DOI] [PubMed] [Google Scholar]
- Lyubarsky AL, Falsini B, Pennesi ME, Valentini P, Pugh EN., Jr UV- and midwave-sensitive cone-driven retinal responses of the mouse: a possible phenotype for coexpression of cone photopigments. J Neurosci. 1999;19(1):442–455. doi: 10.1523/JNEUROSCI.19-01-00442.1999. [DOI] [PMC free article] [PubMed] [Google Scholar]
- Lyubarsky AL, Lem J, Chen J, Falsini B, Iannaccone A, Pugh EN., Jr Functionally rodless mice: transgenic models for the investigation of cone function in retinal disease and therapy. Vision Res. 2002;42(4):401–415. doi: 10.1016/s0042-6989(01)00214-0. [DOI] [PubMed] [Google Scholar]
- Nikonov SS, Daniele LL, Zhu X, Craft CM, Swaroop A, Pugh EN., Jr Photoreceptors of Nrl -/- mice coexpress functional S- and M-cone opsins having distinct inactivation mechanisms. J Gen Physiol. 2005;125(3):287–304. doi: 10.1085/jgp.200409208. [DOI] [PMC free article] [PubMed] [Google Scholar]
- Nikonov SS, Kholodenko R, Lem J, Pugh EN., Jr Physiological features of the S- and M-cone photoreceptors of wild-type mice from single-cell recordings. J Gen Physiol. 2006;127(4):359–374. doi: 10.1085/jgp.200609490. [DOI] [PMC free article] [PubMed] [Google Scholar]
- Nymark S, Haldin C, Tenhu H, Koskelainen A. A new method for measuring free drug concentration: retinal tissue as a biosensor. Invest Ophthalmol Vis Sci. 2006;47(6):2583–2588. doi: 10.1167/iovs.05-1116. [DOI] [PubMed] [Google Scholar]
- Nymark S, Heikkinen H, Haldin C, Donner K, Koskelainen A. Light responses and light adaptation in rat retinal rods at different temperatures. J Physiol. 2005;567(Pt 3):923–938. doi: 10.1113/jphysiol.2005.090662. [DOI] [PMC free article] [PubMed] [Google Scholar]
- Pardue MT, McCall MA, LaVail MM, Gregg RG, Peachey NS. A naturally occurring mouse model of X-linked congenital stationary night blindness. Invest Ophthalmol Vis Sci. 1998;39(12):2443–2449. [PubMed] [Google Scholar]
- Peachey NS, Ball SL. Electrophysiological analysis of visual function in mutant mice. Doc Ophthalmol. 2003;107(1):13–36. doi: 10.1023/a:1024448314608. [DOI] [PubMed] [Google Scholar]
- Penn RD, Hagins WA. Signal transmission along retinal rods and the origin of the electroretinographic a-wave. Nature. 1969;223(5202):201–204. doi: 10.1038/223201a0. [DOI] [PubMed] [Google Scholar]
- Robson JG, Frishman LJ. Response linearity and kinetics of the cat retina: the bipolar cell component of the dark-adapted electroretinogram. Vis Neurosci. 1995;12(5):837–850. doi: 10.1017/s0952523800009408. [DOI] [PubMed] [Google Scholar]
- Robson JG, Frishman LJ. The rod-driven a-wave of the dark-adapted mammalian electroretinogram. Prog Retin Eye Res. 2014;39C:1–22. doi: 10.1016/j.preteyeres.2013.12.003. [DOI] [PMC free article] [PubMed] [Google Scholar]
- Sakurai K, Chen J, Kefalov VJ. Role of guanylyl cyclase modulation in mouse cone phototransduction. J Neurosci. 2011;31(22):7991–8000. doi: 10.1523/JNEUROSCI.6650-10.2011. [DOI] [PMC free article] [PubMed] [Google Scholar]
- Sampath AP, Rieke F. Selective transmission of single photon responses by saturation at the rod-to-rod bipolar synapse. Neuron. 2004;41(3):431–443. doi: 10.1016/s0896-6273(04)00005-4. [DOI] [PubMed] [Google Scholar]
- Schnapf JL, Nunn BJ, Meister M, Baylor DA. Visual transduction in cones of the monkey Macaca fascicularis. J Physiol. 1990;427:681–713. doi: 10.1113/jphysiol.1990.sp018193. [DOI] [PMC free article] [PubMed] [Google Scholar]
- Smith NP, Lamb TD. The a-wave of the human electroretinogram recorded with a minimally invasive technique. Vision Res. 1997;37(21):2943–2952. doi: 10.1016/s0042-6989(97)00094-1. [DOI] [PubMed] [Google Scholar]
- Stockton RA, Slaughter MM. B-wave of the electroretinogram. A reflection of ON bipolar cell activity. J Gen Physiol. 1989;93(1):101–122. doi: 10.1085/jgp.93.1.101. [DOI] [PMC free article] [PubMed] [Google Scholar]
- Sundermeier TR, Vinberg F, Mustafi D, Bai X, Kefalov VJ, Palczewski K. R9AP Overexpression Alters Phototransduction Kinetics in iCre75 Mice. Invest Ophthalmol Vis Sci. 2014;55(3):1339–1347. doi: 10.1167/iovs.13-13564. [DOI] [PMC free article] [PubMed] [Google Scholar]
- Tsang SH, Burns ME, Calvert PD, Gouras P, Baylor DA, Goff SP, Arshavsky VY. Role for the target enzyme in deactivation of photoreceptor G protein in vivo. Science. 1998;282(5386):117–121. doi: 10.1126/science.282.5386.117. [DOI] [PubMed] [Google Scholar]
- Vinberg FJ, Strandman S, Koskelainen A. Origin of the fast negative ERG component from isolated aspartate-treated mouse retina. J Vis. 2009;9(12):9 1–17. doi: 10.1167/9.12.9. [DOI] [PubMed] [Google Scholar]
- Wang JS, Estevez ME, Cornwall MC, Kefalov VJ. Intra-retinal visual cycle required for rapid and complete cone dark adaptation. Nat Neurosci. 2009;12(3):295–302. doi: 10.1038/nn.2258. [DOI] [PMC free article] [PubMed] [Google Scholar]
- Wyszecki G, S WS. Color science. Wiley; New York: 1982. [Google Scholar]
- Zhang X, Wensel TG, Kraft TW. GTPase regulators and photoresponses in cones of the eastern chipmunk. J Neurosci. 2003;23(4):1287–1297. doi: 10.1523/JNEUROSCI.23-04-01287.2003. [DOI] [PMC free article] [PubMed] [Google Scholar]
Associated Data
This section collects any data citations, data availability statements, or supplementary materials included in this article.
Supplementary Materials
Supplementary Figure S1. General sketch of the ex vivo adapter. Double-retina (retinas shown as red circles) specimen holder (green) is on the heating pad where the mouse would be placed for in vivo recordings. A brass heat exchanger (brown) on the same heating pad heats the perfusion solution fed by gravity from the top of the LKC stimulator unit. The perfusion solution bottle is placed in the water bath filled with metallic beads. A flow rate valve is used to adjust the perfusion rate to about 3 mL/min. Specimen holder's electrodes (see Fig. 2) are connected to the LKC unit's amplifier channels 1 and 2. The Faraday cage is electrically connected to the ground pin of the amplifier.
Supplementary Figure S2. Drawings of double-retina specimen holder. Top view (A) and side view (B) of the top part of the specimen holder. Top view (C) and side view (D) of the bottom part of the specimen holder.
Figure S3: Effect of Ba2+ on b-wave responses in ex vivo experiment. Light responses to flashes ranging from 0.26 to 4,700 R* per rod recorded from the same retina before (A) and after (B) application of barium. (C) The b-wave response amplitudes are plotted before (red) and after (black) application of 100 μM BaCl2 as a function of flash strength in R* per rod. Eqn. (3) is fitted to the data points with E1/2 = 2.0 R* and n = 1.3 (100 μM Ba2+) and E1/2 = 3.6 R* and n = 1.5 (no barium). The insets show the raw responses in the absence (red) and presence (black) of barium.