

Abstract
Ischemia/reperfusion (IR) injury has been associated with several retinal pathologies, and a few genes/gene products have been linked to IR injury. However, the big picture of temporal changes, regarding the affected gene networks, pathways, and processes remains to be determined. The purpose of the present study was to investigate initial, intermediate, and later stages to characterize the etiology of IR injury in terms of the pathways affected over time. Analyses indicated that at the initial stage, 0-hour reperfusion following the ischemic period, the ischemia-associated genes were related to changes in metabolism. In contrast, at the 24-hour time point, the signature events in reperfusion injury include enhanced inflammatory and immune responses as well as cell death indicating that this would be a critical period for the development of any interventional therapeutic strategies. Genes in the signal transduction pathways, particularly transmitter receptors, are downregulated at this time. Activation of the complement system pathway clearly plays an important role in the later stages of reperfusion injury. Together, these results demonstrate that the etiology of injury related to IR is characterized by the appearance of specific patterns of gene expression at any given time point during retinal IR injury. These results indicate that evaluation of treatment strategies with respect to time is very critical.
Keywords: retina, ischemia/reperfusion (IR) injury, microarray, gene expression
Introduction
Ischemic injury in the retina may be associated with several retinal pathologies such as ischemic optic neuropathy, diabetic retinopathy, retinopathy of prematurity, and glaucoma.1–6 Ischemic conditions cause hypoxia or even anoxia and trigger a loss of retinal cellular functions. As a consequence, there are varieties of changes in retinal function metabolism and morphology that lead to impaired vision.7–10 Due to the lack of effective treatment, studies in this area are carried out to provide substantial insides into the mechanisms involved in retinal ischemic damage.
It is somewhat paradoxical that reperfusion of the retinal tissue can also cause severe tissue injury including cell death and tissue necrosis. The reperfusion injury is thought to be a consequence from the introduction of oxidative stresses and the endogenous generation of free radicals.11
It is now known that ischemia/reperfusion (IR)-related injury in the retina results in death of the retinal ganglion cells and other inner retinal neurons, often resulting in blindness of the affected eye.12–14 These changes are reportedly linked with induction and/or repression of certain specific genes. The signal transduction mechanisms and cellular processes underlying retinal damage induced by IR are not completely understood and remain a very important area for scientific inquiry.
It is to be hoped that a more complete characterization at the molecular level will highlight the important genes, gene networks, signaling cascades, and cellular processes that should be targeted for interventional therapies. Some studies have used microarrays to investigate animal models of glaucoma,15–26 while others have investigated the altered expressions of a few selected genes in response to ischemia.27–29 However, there is very little information in the literature related to differences that may exist between the gene responses evident in initial, intermediate, and prolonged reperfusion times following an acute ischemic insult. Differentially expressed genes observed after ischemia at different reperfusion times in animal models, as shown in this study, could be quite relevant to the treatment of ischemic disorders in the human condition.
For this purpose, we investigated patterns of gene expression in rat retinas after 0 hour, 24 hours, and 7 days of reperfusion, subsequent to a 60-minute period of ischemia. Results were further validated with the aid of quantitative real-time PCR, immunocytochemistry of fixed tissue sections, and Western blots.
Methods
Animals
Long Evan’s hooded male rats (Harlan, Indianapolis, IN) weighing 250–300 g were used. All animals were housed on a 12-hour light–dark cycle with food and water ad libitum. The treatment and care of all animals used in this study were approved by the University of Louisville Institutional Animal Care and Use Committee and were performed in accordance with the Association for Research in Vision and Ophthalmology Statement for the Use and Care of Animals in Ophthalmic and Vision Research.
Statistical analysis
A total of 36 animals were used for the microarray study. Sham control and IR-injured animal groups contained 18 rats per group. Each of the sham and IR injury-related groups were divided into three subgroups of six animals based on the three time points used for this study (0 hour, 24 hours, and 7 days). The same samples that were used in the microarray study were also used for the real-time PCR. For the Western blots, a total of 18 rats were used. The animals were divided in two groups (sham control and IR-injured animal groups), with nine animals per group. Each group was further divided into three subgroups of three animals for the 0-hour, 24-hour, and 7-day time points.
IR injury
To induce ischemia, rats were first anesthetized with sodium pentobarbital (50 mg/kg, i.p.). Tetracaine hydrochloride (0.5%) and Tropicamide (1% ophthalmic drops) were administered to provide local anesthesia and mydriasis, respectively. For induction of high intra-ocular pressure (IOP), the anterior chamber of one eye was cannulated with a 30-gauge needle attached to an elevated 1 L sterile saline reservoir. High IOP of 110 mmHg was maintained for 60 minutes. Following the removal of the needle, reperfusion proceeded for one of the three time points including initial, intermediate, and late stage time points, which were 0 hour, 24 hours, and 7 days, respectively. At these respective time points, the animals were euthanized and tissues were collected. The same procedures were administered to rats receiving sham surgeries except that high IOP was not induced. The IOP was measured in mm Hg at 15, 30, and 60 minutes using a TonoLab tonometer device (Colonial Medical Supply, Franconia, NH). Retinas were dissected from each eye, flash frozen in liquid nitrogen, and stored at −80 °C for subsequent use.
RNA isolation and analysis of quality
Whole retinas were isolated from animals at the three perfusion time points of 0 hour, 24 hours, and 7 days. Retinas were then homogenized in lysis/binding buffer (Ambion Inc., Austin, TX, US) using a motorized rotor-stator homogenizer. Total RNA was isolated from each retina using mirVana™ miRNA Isolation Kit (Ambion, Inc, Austin, TX). The quality of the RNA was checked with the aid of the spectrophotometer (NanoDrop Technologies, Wilmington, DE). The RNA integrity numbers for all samples were greater than 8.
Preparation of cyanine 3-CTP labeled cRNA targets
Total RNA (200 ng) was used to generate fluorescently labeled cRNA with the aid of Low RNA Input Linear Amplification kit with one-color (Agilent, Cedar Creek, TX). Briefly, this kit uses T7 promoter primer to synthesize cDNA and T7 RNA polymerase to synthesize cRNA, which simultaneously amplifies the target material and incorporates cyanine 3-labeled CTP. The labeled cRNA was purified by using the RNeasy Mini Elute kit (Qiagen, Valencia, CA). The yield and incorporation efficiencies were measured with a spectrophotometer (NanoDrop Technologies, Wilmington, DE). The yield of labeled cRNA per animal was greater than 1.65 ug, and the specific activity was greater than 9.0 pmol Cy3 per ug cRNA.
Hybridization
1.65 ug of each labeled cRNA sample per animal was fragmented at 60 °C for 30 minutes (Agilent Gene Expression Hybridization kit) and then hybridized to the oligonucleotide arrays (Agilent, Whole Rat Genome 4x44K, 60-mer oligonucleotides; G4131F) at 65 °C for 17 hours. After hybridization, the microarray slides were washed with Agilent gene expression wash buffers: buffer 1 at room temperature for 1 minute and buffer 2 at 37 °C for 1 minute.
Microarray scanning
The slides were scanned with the aid of an Agilent microarray scanner (G2565BA) with a setting for one-color using the green channel and 5 um resolution. The one-color microarray images (.tif) were extracted with the aid of Feature Extraction software (v 9.5.1, Agilent).
Microarray data analysis
The raw data files (.txt) were imported into GeneSpring (GX 11.1) and the data were normalized and analyzed. GeneSpring generates an average value from the six animal/samples for each gene. Data were transformed to bring any negative values or values less than 0.01 to 0.01 and then log2-transformed. Normalization was performed using a per-chip 75 percentile method that normalizes each chip on its 75 percentile, allowing comparison among chips. Then a per-gene on median normalization was performed, which normalized the expression of every gene on its median among the samples.
The differentially expressed genes of significance were evaluated with the aid of Volcano Plots (P value versus fold change). Unpaired t-test comparison of the experimental and control groups was then derived from the Volcano Plots. Differentially expressed genes with P values less than or equal to 0.05 and fold changes greater than or equal to 2 were determined. The P values were obtained with the Bonferroni correction test which provides for a high stringency test with few false positives.
Ingenuity pathway analysis
Pathway Analysis software (IPA 6.0; Ingenuity Systems, Mountain View, CA, USA) was used to identify functional groups and canonical pathways for those genes that were differentially expressed at the three reperfusion time points.
Gene ontology analyses
Gene ontology (GO) category enrichment analysis of the differentially expressed genes was evaluated with the aid of Partek software (Partek Inc, St Louis, MO), based on their respective molecular function, biological process, or cellular component. GO term-enriched genes chosen for further analyses included: immune/inflammatory response, cell death/apoptosis, stimulus response, and glutamate receptor activity/pathway.
Real-time PCR
To validate and confirm the expression levels of selected genes, real-time PCR was performed.
RNA (50 ng) was subjected to DNase treatment and used further for cDNA synthesis using Taqman reverse transcription reagents (Applied Biosystems, Foster, CA). TaqMan quantitative real-time polymerase chain reaction (RT-PCR) was performed using the following primers: VHL (Rn00583795_m1), Rac2 (Rn01504461_g1), NF-kappa B (Rn01413849_g1), Caspase3 (Rn00563902_m1), C1q (Rn00693288_m1), C3 (Rn00566466_m1), GRM5 (Rn00566628_m1), and GNG7 (Rn00577133_m1) from Applied Biosystems. Each RT-PCR reaction contained a final concentration of 10 ng of cDNA, 900 nM of primers, 250 nM of probes, and TaqMan Universal PCR Master Mix (Applied Biosystems, Foster City, California, United States) and ran for 40 cycles. Data were collected and analyzed with sequence detection software (7000 Sequence Detection System, ABI Prism).
Real-time data analysis
Relative expression levels of the target genes were analyzed according to the 2−ΔΔCt method30 and by normalizing against 18S expression. We are aware that reference genes can be problematic when used for normalization in different conditions because expression levels in that particular condition may differ from their general expression level. In our pilot experiments, we used 18S, Glyceraldehyde-3-Phosphate Dehydrogenase (GAPDH), and β-actin as reference genes and validated 18S as a more stable control in our ischemic model. Therefore, we have chosen 18S as a control in the microarray study and the RT-PCR experiments. Ct values were expressed as fold change. Experiments were performed in duplicate for each gene using six independent biological replicates. Ct values were compared with a one-way analysis of variance (ANOVA) and with Tukey’s post-hoc test.
Immunocytochemistry
Six rats (three in a sham control group and three in an IR 7 day-related group) were euthanized with sodium pentobarbital (100 mg/kg, i.p.) and transcardially perfused. Initial perfusion was done with calcium-free Tyrodes solution and was followed by perfusion with 4% paraformaldehyde (PFA) in 0.1M phosphate (PB), pH 7.4. Eyes were enucleated and post-fixed overnight in 4% PFA at 4 °C. To ensure cryoprotection, eyes were embedded in 30% sucrose diluted in PBS and incubated for 3–5 days. Vertical sections of retina (14 μm) were collected using cryostat and subsequently stored at −80 °C. Prior immunostaining, tissue sections were thawed and rehydrated in Tris-buffered saline (TBS), pH 7.2. Slides were then blocked in 10% normal donkey serum (NDS, Jackson Immuno) diluted with 0.05% Triton X-100 in TBS (Tx-TBS) for 1 hour at room temperature. Sections were then incubated with primary antibodies (Anti-C3 [11H9] and Anti-C1q [JL-1] antibodies from Abcam, Cambridge, MA, US) overnight at 4 °C. Following several rinses in TBS, sections were incubated for 1 hour at room temperature with species-specific secondary antibodies (1:200 dilutions in 5% NDS Tx-TBS). The secondary antibodies were conjugated to fluorescein isothiocyanate or Cy3 (Jackson Immuno). After several washes with TBS, the slides were mounted with anti-fade mounting medium (Vector Laboratories, Burlingame, CA) and viewed with the aid of a confocal microscope.
Western blots
Frozen retinas (36) from 18 rats were sonicated three times for 0.5 second each, in ice cold Radioimmunoprecipitation assay (RIPA) buffer (50 mM Tris–HCl, 150 mM NaCl, 1% NP-40, 0.5% sodium deoxycholate, 0.1% SDS, pH 8.0, Sigma) along with a cocktail of protease and phosphatase inhibitors (1:100, Sigma). Samples were centrifuged at 14,000 rpm at 4 °C for 30 minutes. The supernatant was collected and protein concentration was measured with the aid of a BCA kit (Pierce Biotechnology Inc., Rockford, IL). Thirty micrograms of total protein were separated on sodium dodecyl (lauryl) sulfate-polyacrylamide gel electrophoresis (SDS-PAGE) gels, transferred to polyvinylidene difluoride (PVDF) membranes (Milipore, Billerica, MA), and blocked in 5% fat-free dry milk in TBS plus 0.1% Tween-20 (TBST) (Sigma) for 1 hour at room temperature. Primary antibodies (Anti-C3 [11H9], Abcam; Anti-Rac2 (PA1-9091), Pierce Antibodies; Anti-Casp3 C8487, Sigma; GNG7, sc-26773, Santa Cruz; GRM5, AB5675, EMD Millipore) were diluted in 5% bovine serum albumin (BSA)/TBST and blots were incubated overnight at 4 °C. Membranes were washed repeatedly in TBST and incubated in species-specific secondary antibodies (1:10,000 dilution in 5% BSA/TBST, Jackson Immuno, West Grove, PA) for 1 hour at room temperature. Secondary antibodies were raised in donkey and conjugated to horseradish peroxidase. After several washes in TBST, membranes were visualized using an ECL visualization kit (Pierce Biotechnology Inc.) and exposed on radiographic film. Relative molecular weights of bands were determined by comparison with protein standards and compared to reported molecular weights of known proteins of interest. Integrated density values were obtained for each band using Alpha Imager (Alpha Innotech, San Leandro, CA). Data were compared using one-way ANOVA.
Results
Microarray gene expression profiles
From a total of 44,000 probes on the Agilent oligonucleotide arrays, 53, 1527, and 1576 probes were differentially expressed in the IR-injured retinas relative to the sham controls at 0-hour, 24-hour, and 7-day retinas, respectively. These numbers were obtained after applying a filter of two-fold change cut-off value together with a P value less than or equal to 0.05. Our microarray data have been deposited into the Gene Expression Omnibus where it is now available for the public use (GSE43671).
A comparison of all three time points showed a general lack of overlap in the differentially expressed genes among them (Fig. 1A). For example, only three genes with altered expression values were shared between the IR 0-hour and IR 24-hour time points. Similarly, only one gene was shared between the IR 0-hour and IR 7-day time points. The most significant overlap of 258 genes was obtained between the IR 24-hour and IR 7-day reperfusion periods. Although there were some overlapping genes, the data indicated significant differences between the initial, intermediate, and late stages of IR injury.
Figure 1.

Venn diagrams showing: (A) the total numbers of differentially expressed genes in each of the 3 time points: 0 h (red), 24 h (green) and 7 days (blue) post IR and the common genes among the time points; (B) only up-regulated genes in each of the 3 time points, 0 h (red), 24 h (green) and 7 days (blue) post IR and the common genes among them; (C) only down-regulated genes in each of the 3 time points, 0 h (red), 24 h (green) and 7 days (blue) post IR, and the common genes among them.
Abbreviations: IR, ischemia-reperfusion; SC, scham control; FC, fold change.
Further, we assessed the numbers of upregulated and downregulated genes for each of the examined time points. For example, at the IR 0-hour time point, 41 of the differentially expressed genes were upregulated, while 12 genes were downregulated, compared to the sham control animals. The IR 24-hour time point exhibited 639 upregulated and 888 downregulated genes. In contrast to this, at the IR 7 days, there was significant increase in the number of upregulated genes (1467) and a significant decrease in the number of downregulated genes (109). Additionally, there was an overlap in only a few of these genes among the three time points (Fig. 1B and 1C).
We next evaluated the microarray probes for gene annotation and functional linkage with the aid of pathway analysis software (IPA). At the initial IR 0-hour time point, the range of expression values for ischemia-associated genes lies between a 13-fold increase and a 3.3-fold decrease (Suppl. Table 1). Among the 53 genes with altered expression in the IR 0-hour retinas, 35 probe-IDs were mapped with the aid of IPA analysis, and of these, only 26 (24 upregulated and 2 downregulated) genes were eligible for annotation and functional pathway analysis. The pathway analysis revealed that, three of the most significant canonical pathways (P value less than 0.022). were related to synthesis and degradation of ketone bodies, folate biosynthesis, and acute phase response signaling, though these pathways do not include the most differentially expressed genes at 0-hour post-IR (Suppl. Table 1).
At the intermediate IR 24-hour time point, expression analysis provided 1129 probe-IDs. From these, 311 upregulated and 468 downregulated genes were eligible for annotation and functional pathway analysis. The upregulated genes were related to inflammatory responses, cell growth and proliferation, cell-to-cell signaling and interaction, cell death, and immunological diseases (P value less than 0.022). The most highly upregulated genes were Atf3 (~22-fold increase after 24 hours, ~6-fold increased after 7 days), Hmox1 (~22-fold increased after 24 hours, ~11-fold increased after 7 days), nestin (~21-fold increased after 24 hours, ~4-fold increased after 7 days), Clcf1 (~19-fold increased after 24 hours, ~5-fold increased after 7 days), Ccnd1 (~14-fold increased after 24 hours, ~2-fold increased after 7 days). At this time point, the most significantly downregulated genes were involved in glutamate receptor signaling (Grm5, Gnb1, Grin2a, Homer2, Grm3, Gria1, Dlg4, Gria4, Gng7, and Gria3), protein kinase A signaling (Myh10, Tgfbr1, Nfatc3, Gnb5, Pde1A, Pde4D, etc.), and synaptic long-term depression (Gucyia3, Itpr2, Grm3, Gria1, Pla2r1, Itpr1, Grm5, Gnat1, Ppp2r3a, Pla2g5, Gnap1, Prkce, Ryr1, Prkd1, Prkca, and Gria3).
At the late stage, IR 7 days, 830 probe-IDs were mapped to yield a total of 495 upregulated and 48 downregulated genes that were eligible for annotation and functional pathway analysis. The upregulated genes were related to inflammatory responses, immunological diseases, and cell-to-cell signaling and interactions (P value less than 0.022). The most highly upregulated genes are Edn2 (~7-fold increased after 24 hours, ~47-fold increased after 7 days), Rsad2 (~3-fold increased after 24 hours, ~45-fold increased after 7 days), Oas1 (~2-fold increased after 24 hours, ~40-fold increased after 7 days), Isg15 (~4-fold increased after 24 hours, ~39-fold increased after 7 days), and Bcl3 (~7-fold increased after 24 hours, ~25-fold increased after 7 days). The most significant canonical pathways involving the upregulated genes were related to antigen presentation pathways (B2m, Psmb9, Hla-dma, Hla-drb1, Psmb8, CD74, Tap1, Tap2, Tapbp, and Hla-c), the complement system (c1r, Serping1, C3, C1s, C4a, C1qc, C1qa, C1qb, CFH, and C2), and interferon signaling (Oas1, Ifitm1, Iif35, Stat2, Irg9, Stat1, and Tap1). The most significant pathways involving the downregulated genes were related to G Protein Signaling (Plcb1 and Gng7), the phototransduction pathway (Arr3 and Pde6c), and glutamate receptor signaling (Slc17a6 and Gng7).
Supplementary tables 1–3 provide the top 30 genes (15 upregulated and 15 downregulated genes) for each of the three stages for IR-injury.
Hierarchical cluster analysis
In addition to the IPA analyses, cluster analysis was performed with the aid of Partek software (Partek Inc.,Louis, MO) to generate heat maps (Fig. 2A–2D) for the four previously identified major cellular processes, including: (1) immune/inflammatory responses, (2) cell death, (3) complement system, and (4) glutamate receptor activity.
Figure 2.


Hierarchical clustering of four gene-subsets in sham control and IR animal groups. The bright red color indicates up-regulation, the deep green color indicates down-regulation, and black portrays no change. (A). Hierarchical clustering of inflammatory/immune response genes. The heat map indicates that expressions of these genes are strongly increased after 24 h and 7 days reperfusion. (B). Hierarchical clustering of cell death/apoptosis differentially regulated genes. The heat map indicated that most of these genes are significantly up-regulated at 24 h and 7 days reperfusion. (C). Hierarchical clustering of complement system differentially regulated genes. The heat map demonstrates that the 11 related genes were strongly up-regulated compared to their sham control counterparts at the 7 days reperfusion time point. (D). Hierarchical clustering shows that 10 of 11 glutamate receptor and associated signaling related genes were down-regulated compared to their sham control counterparts at the 24 h reperfusion time point. The solute carrier gene denoted by Slc17a6, and which is significantly down regulated at IR-7 d, is an alias for the glutamate transporter VGLUT2.
There are 206 differentially regulated genes functionally clustered in the category of immune/inflammatory responses (Fig. 2A). From this latter figure, it is evident that immune and inflammatory responses are lacking in the sham controls and also in the initial 0-hour stages of the IR-injured retinas. In striking contrast, most of the genes in this group are upregulated at the intermediate 24-hour, and late 7-day stages of IR-injury. There is some variation in expression among genes within this cluster across these two latter stages of IR-injury.
A similar temporal pattern of expression is evident for those 271 differentially expressed genes linked with cell death/apoptosis processes (Fig. 2B). Again, few of these genes were upregulated in the sham control animals. The majority of this group of genes was highly expressed at IR 24 hours and 7 days and again there was some variable pattern of expression for particular genes across these two time points.
The cluster of genes associated with the complement system contained 10 genes, and most of these were upregulated at IR 7 days relative to the other stages of IR-injury, and relative to the sham control animals (Fig. 2C).
The cluster of genes associated with synaptic activity include members of the glutamate receptor family (Fig. 2D). This set includes 11 genes and their expression was dramatically decreased at the intermediate 24-hour stage of IR-injury.
Real-time PCR of genes selected from the microarray analysis
To validate and confirm the quality of the microarray data, we selected eight genes from several of the inferred pathways or functional groups and performed real-time PCR. These analyses were performed on the same RNA samples that were used for the microarray platform. All values from the RT-PCR of three ischemic rats were compared with the three sham controls. For the most part, we obtained excellent agreement between the data derived from real-time PCR and the microarray platform, such that the trend of expression changes in RT-PCRs was similar and in the same upregulated or downregulated direction as observed in microarray results (Fig. 3). For example, in the case of NF-kappa B, we found a more robust upregulation by real-time PCR, relative to the microarray values, which may be due to differences between the sensitivities of array-probes and PCR-primers. It is not uncommon for different techniques with different sensitivities to provide different absolute values.
Figure 3.

Comparative evaluation of microarray and real-time RT-PCR results for eight selected genes.
Notes: Values on the Y-axis represent the fold change relative to the sham control. Values on the X-axis represent the time course of reperfusion. Error bars indicate the standard error of the mean (n = 3).
Immunocytochemistry
Immunochemical analysis was used to detect the presence and localization of protein products for some of the genes which were identified as differentially expressed in the microarrays. For example, two genes that were upregulated in the IR 7-day time point were present in the retina (Fig. 4). C1q that encodes a major constituent of the complement system is evident. It associates with the proenzymes C1r and C1s to yield C1, the first component of the serum complement system. C3 is another component of the complement system and plays a central role in its activation. Immunocytochemical localization of C1q and C3 in the IR 7-day retina showed strongest labeling in the ganglion cell and nerve fiber layers when compared with eyes from the sham control group (Fig. 4).
Figure 4.
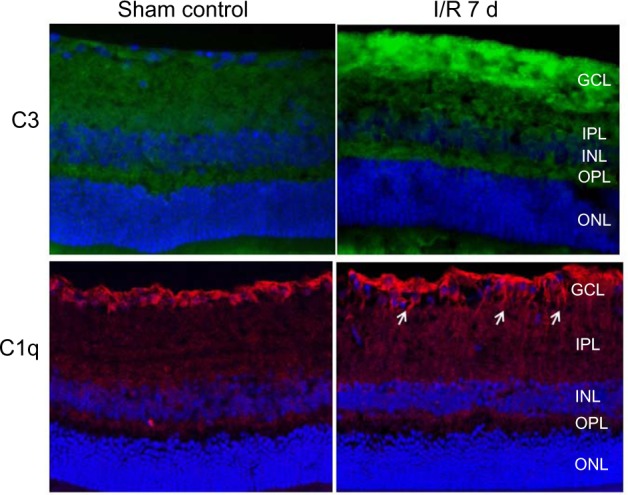
Immunocytochemical detection and localization of C3 (green) and C1q (red), in the late stage IR 7 d retina vs the sham control retina. DAPI (blue) labels the cell nuclei. Strong immunolabeling in the nerve fiber and ganglion cell layers of the IR-injured retina was obtained, when compared with the sham control animals.
Notes: Arrows point to fibers that expressed C1q protein.
Abbreviations: ONL, outer nuclear layer; OPL, outer plexiform layer; INL, Inner nuclear layer; IPL, inner plexiform layer; GCL, ganglion cell layer.
Western blots
We further investigated whether the increased or decreased transcript levels detected on the microarray platform correlated to increased or decreased levels of the corresponding protein. Five randomly selected proteins, C3, Rac2, Caspase 3, Gng7, and Grm5 were used for protein level analysis using Western blot. C3 and Rac2 protein accumulation was significantly increased in retina at 7-day reperfusion compared with sham control (Fig. 5). The Caspase 3 protein level was increased at 24 hours, but then decreased at the IR 7 days compared with IR 24-hour time point. Gng7 protein accumulation was decreased at IR 24-hour and 7-day reperfusion time points. Grm5 protein level demonstrated a decrease at IR 24-hour time point and no changes at IR 7 days. These results demonstrated that changes in the relative amounts of gene product were consistent with the observed expression changes of the transcripts for these particular genes.
Figure 5.
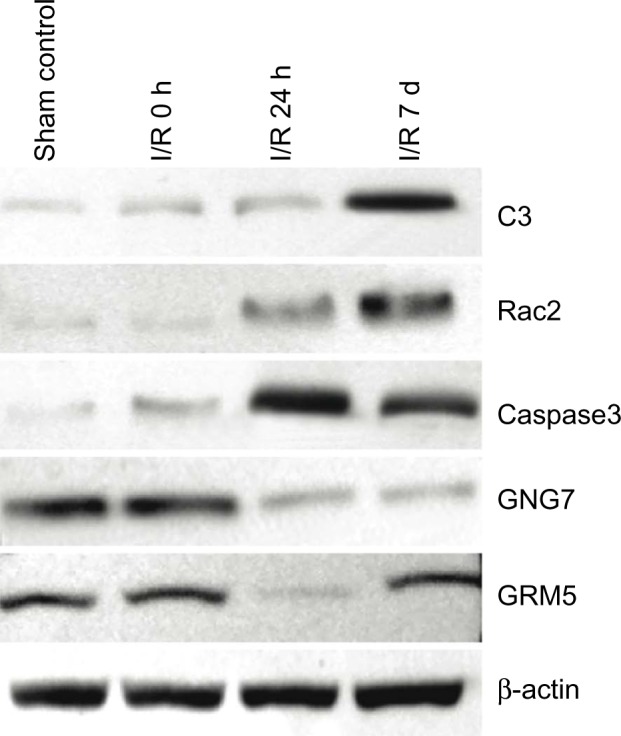
Western blot analysis of protein expression in sham control and IR 0 h, 24 h and 7 d retina. C3 and Rac2 proteins reached peak accumulation at IR 7 d. Activated-caspase3 protein was increased at IR 24 h, and then gradually decreased. GNG7 protein was detected in all retinal samples, but was decreased at IR 24 h and 7 d. GRM5 protein accumulation was decreased at IR 24, then return to normal levels at IR 7 d.
Discussion
In this comprehensive analysis of gene expression, we have shown that there are differences between the transcriptional responses to the initial, intermediate, and late stages of reperfusion after retinal ischemia.
The data indicated that there is minimal induction of altered gene expression in the initial reperfusion period after 1 hour of ischemia. This likely indicates that many if not most of the altered gene expression events detected at later stages of the reperfusion period are oxygen/energy-dependent changes. More than 1500 genes with altered expression were evident at the intermediate stage (24 hours) and late stage (7 days) after reperfusion. As many of these changes appear to be harmful to the retina, it seems that the reperfusion itself, rather than the ischemia is, paradoxically, damaging. Others have suggested that reperfusion results in oxidative stresses which may result in tissue damage.11 Our results are supportive of a molecular/cellular model in which different, but perhaps interdependent, phases of molecular/cellular activities operate in a sequential manner. It appears that ischemia initiates a cascading series of events, which may be prolonged, in part to cell death, and subsequent, continuing “plastic” responses to initial injury. A consequence of these changes is the gradual reduction in thickness of retina over time, leading to ultimately tissue remodeling at 7 days post-ischemia.31,32 Thus, consideration of post-injury time, at least over the duration of 1 week, may have important implications for treatment strategies.
Several of the altered genes seen here were notable because they have been highlighted by prior studies of retinal ischemia. These would include immediate early genes JunB and C/EBP, cell-cycle-related genes Cyclin D (Ccnd), stress responsive protein genes crystallin alpha B and crystallin beta-B2, cell-signaling protein genes P38 MAP kinase, interferon-related developmental regulator 1, nerve growth factor inducible factor, and others.27,29 However, in our study, we also found time-dependent changes in certain differentially expressed genes that only existed at specific time points in the IR period and have not been previously reported. We postulate that the altered expressions sets of specific genes and related pathways and cellular processes at different time points might contribute to a dynamic pathological manifestation of retinal IR injuries.
Responses to the ischemic period
GO category enrichment analysis at the ischemic period demonstrated significant enrichment in transporter activity, for genes such as Kcnj13 (2.9-fold increase), Slc16a8 (2.8-fold increase), Tf (2.6-fold increase), Slc26a7 (2.5-fold increase), suggesting a modified uptake of nutrients, ions, and signaling molecules. Thus, the retinal primary metabolism may experience a profound change in the ischemic period. There are two retinal specific genes upregulated in IR 0 hour and these are Rdh5 and Rgr. Rdh5, a specific-retina retinol dehydrogenases, functions in the visual cycle to catalyze the final step in the biosynthesis of 11-cis retinaldehyde.33 Rgr, a putative retinal G-protein coupled receptor, may be associated with autosomal recessive and autosomal-dominant retinitis pigmentosa.34 The prospective roles of these two retinal specific genes in retinal IR injuries have not been reported and their biological associations should be explored further.
During the ischemic period, we found that Ccdc92 and Vhl were significantly downregulated. Ccdc92 is involved in metabolic pathways for glutamate and nitrogen. Vhl is involved in the ubiquitination and degradation of hypoxia-inducible factor (HIF),35 a transcription factor that plays a central role in the regulation of oxygen sensitive gene expression. A decreased transcription of these two genes may play a protective effect against retinal IR. Thus, if there is less turnover of HIF, due to less Vhl, then neovascularization may be stimulated.36,37
Responses to the reperfusion periods
The expression of many immune/inflammatory as well as cell death/apoptosis-related genes appears to be indicators of significant biological processes occurring in the 24-hour reperfusion period. The induction of inflammatory/immune responses after reperfusion is believed to be a major contributor to functional deterioration after brain IR injury.38,39 The inflammatory processes increase the generation of reactive oxygen species (ROS), free radicals, and cytokines, which lead to cell death. In our study, the microarray analysis demonstrated the upregulation of a large number of inflammatory and immunological genes in response to IR at this time point. We observed that the gene expression levels of cytokine, chemokine, and other inflammation-related genes, such as Edn2, IL-18, NF-κB, Ccl2, Ccl6, Clcf1, Icam1, Jun, Jun-B, Ch25h, CD44, CD68, CD74, Irf7, were highly upregulated after reperfusion. These findings confirm and extend observations from other microarray studies in which different model systems of retinal IR-injury were used.40–42
NF-κB is a major regulator of the inflammatory response, and it is responsible for activation of a number of pro-inflammatory molecules, cytokines, and chemokines that lead to inflammation.43 The exact mechanism responsible for NF-κB activation during IR is not clear but the involvement of ROS has been implicated.44 A report from our laboratory demonstrated that NF-κB activation in the retina was downstream of glutamate-mediated signaling.45
Among the 271 genes associated with programed cell death, we identified not only genes that induce apoptosis but also anti-apoptosis genes. For example, the Ccnd1 gene was upregulated (13.5-fold), and aberrant expression of this gene has been reported to induce neuronal apoptosis by the G1 arrest mechanism.46 In addition, other well-known apoptosis-associated genes such as Caspase 3 were found upregulated, which is in agreement with previous study.31 However, Atf3 is markedly upregulated at 24-hour reperfusion with a 22-fold change. Atf3 gene is induced when other organs such as the liver, heart, and kidney are subjected to oxidative stresses caused by IR.47–49 Atf3 may play a protective role in renal IR injury and the mechanism of the protection may involve suppression of p53 and induction of p21.50
Hmox1 is also upregulated with 22-fold change at 24-hour reperfusion. Hmox1 is known to be upregulated in response to an ischemic insult and to play an important role in protection against oxidative stress.51,52 Therefore, while cells that show irreversible damage may undergo apoptosis or inflammation, the survival of other retinal cells is promoted by an increased expression of anti-apoptotic or anti-inflammatory genes. This phenomenon reached its peak at 24-hour reperfusion, a balanced expression of these pro- and anti-apoptosis genes may decide the fate of retinal neurons.
The complement system activation in response to central nervous system injury appears to have both beneficial and harmful consequences. It presumably limits the scope of local inflammatory responses by facilitating rapid removal of dying cells and cellular debris.53 Other reports showed that it can also contribute to the death of neurons under certain conditions.54–56 The IR injury responses shown here are accompanied by the synthesis and accumulation of components of the complement cascade. Previous data showed that C1q and C3 can be detected as early as 14 days following elevation of IOP in a rat model coincident with the development of optic nerve damage. We found that the complement genes were evidently already increased at IR 7 days. In addition to C1q and C3, a complement regulator protein, CFH, was also upregulated significantly at this time point. CFH is the main regulator of C3 activation.57 CFH prevents the assembly of the C3/C5-convertase of the alternative pathway by multiple mechanisms due to its affinity for C3b.58–61 The implications of this upregulated CFH are still not clear, but may be related to a neuroprotective effect.
Downregulated genes after ischemia
The genes that were downregulated in response to IR were associated with a variety of functions. The mechanisms of their association with retinal IR injury are still not straightforward.
For example, Crystalline alpha A (Cryaa) and Crybb2 were highly reduced with about 70-fold changes at IR 7 days. Chronic elevation of IOP in rats resulted in decreased level of Cryaa, Crybb2, and Cryab at 8 days after episcleral vein injection.16 Another microarray study on the glaucomatous DBA/2J mouse identified a loss of Cryaa, Cryba1, and Cryba2.24 Our data showed the same tendency of Cryaa, but the significance of these observations is not clear at present and needs further investigation.
There are controversial theories on the possible role of glutamate and glutamate receptor in neuronal cell death. It has been proposed glutamate excitotoxicity is a mechanism which contributes to retinal ganglion cell death which is fundamental to glaucoma.62 But Kwon et al. showed elevated vitreal glutamate levels were not found in a primate model of central retinal artery occlusion.63 This result implied that there is no role for glutamate and its receptors in glaucomatous neuronal death. In contrast, Nucci and his colleagues (2005) showed that acute elevation of IOP increases intraretinal levels of glutamate with consequent abnormal activation of N-Methyl-D-Aspartate receptor (NMDA) and non-NMDA subtypes of glutamate receptors. These authors found increased Nitric Oxide Synthase (NOS) activity and glutamate-mediated, Retinal Ganglion Cells (RGC) death.64
The glutamate receptor signaling pathway was the most significant downregulated pathway at 24-hour reperfusion. The results presented here showed that there were indeed some changes in the expression of the glutamate receptors, which indicated the glutamate receptors may be involved in development of, or response to IR injury.
Grin2a (glutamate receptor, ionotropic, N-methyl D-aspartate 2A) encodes the glutamatergic NMDAR2a receptor responsible for excitatory neurotransmission. Although the function of this receptor is unknown in the retina, the heteromeric subunit composition of the NMDA receptor is associated with variations in excitotoxicity.65 Brandoli et al. found that BDNF and FGF2 may protect cerebellar granule cells against excitotoxicity by altering the NMDA receptor and Ca signaling via a downregulation of NMDA receptor subunit expression, especially NMDAR2a.66 Vacotto et al. (2010) found that acute hypoxia increases the ratio NR2B/NR2A and facilitates the evolution toward apoptosis. In the present study, Grin2a demonstrated a decreased expression by an almost 10-fold change. The functional outcome of decreased Grin2a could reduce neurotransmission, may result in less excitotoxicity and less induction of downstream inflammatory processes.67
Grm5 belongs to group-I metabotropic glutamate receptors (Grms). A prior study has shown overexpression of metabotropic receptors protects neurons from apoptosis.68 The possibility that downregulation of Grm5 may lead to the death of retinal neurons after ischemia requires further exploration. We also observed the downregulation of Grm3 which belongs to group-II Grms. The transduction pathway of these receptors involves a negative coupling to adenylate cyclase and their activation causes a reduction of glutamate release and thereby of synaptic excitation.69
Taken together, the downregulation of those glutamate receptors may be a protective response by minimizing excitotoxicity in IR injury at this time point. Alternatively, these data may be indicative of the fact that cell death is already taking place in the cells that contain these genes.
During the IR injury in retina, it is somewhat surprising to observe a general paucity of genes with altered expressions that are common among the 0 hour, 24 hours, and 7 days of reperfusion time points. This observation alludes particularly to the differences between the ischemic (0 hour) and the reperfusion periods (24 hours and 7 days). Most genes are upregulated or downregulated only in one specific time interval, indicating that IR comprises different phases characterized by specific patterns of expression of distinct sets of genes. Thus, inflammatory and immune responses and cell death/apoptosis are the principal responses at the IR 24-hour time point. Glutamate receptor signaling is another pattern with significant downregulated genes at the IR 24-hour time point. In contrast, the complement system pathway is mainly activated at the IR 7-day time point. These results suggest that the etiology of injury related to IR is complicated by the appearance of altered patterns of gene expression at different time points of retinal IR injury. We suggest that ischemia initiates a cascade of events, which occur over a time scale of at least 1 week and which is consistent with the previously documented reduction in thickness of the retina over time. Manipulation of the expression of the differentially expressed genes reported in this study could be a strategy to prevent or treat IR-injury. Examples include blockage of pro-inflammatory chemokines and cytokines, downregulation of adhesion molecules, modulation of the innate immune system, or overexpression of protective genes. However, there is a need to carefully evaluate therapeutic strategies with respect to the different cellular processes that occur at different post-ischemic times.
Supplementary Data
Supplementary Tables 1–3. These tables 1 provide the top 30 genes (15 upregulated and 15 downregulated genes) for each of the three stages for IR-injury.
Footnotes
Author Contributions
Conceived and designed the experiments: MZ, WF, NGC. Analyzed the data: MZ, WF, KA, XL, YC, JDRM, NGC. Wrote the first draft of the manuscript: MZ, FW, KA, NGC. Contributed to the writing of the manuscript: MZ, FW, KA, NGC. Agree with manuscript results and conclusions: KA, MZ, WF, XL, YC, JDRM, NGC. Jointly developed the structure and arguments for the paper: MZ, WF, KA, XL, YC, JDRM, NGC. Made critical revisions and approved final version: KA, NGC. All authors reviewed and approved of the final manuscript.
ACADEMIC EDITOR: Joshua Cameron, Editor in Chief
FUNDING: This project was supported in part by grants from the National Eye Institute R01EY017594, the National Center for Research Resources (5P20RR016481–12), and the National Institute of General Medical Sciences (8 P20 GM103436–13) from the National Institutes of Health.
COMPETING INTERESTS: Authors disclose no potential conflicts of interest.
This paper was subject to independent, expert peer review by a minimum of two blind peer reviewers. All editorial decisions were made by the independent academic editor. All authors have provided signed confirmation of their compliance with ethical and legal obligations including (but not limited to) use of any copyrighted material, compliance with ICMJE authorship and competing interests disclosure guidelines and, where applicable, compliance with legal and ethical guidelines on human and animal research participants.
REFERENCE
- 1.Osborne NN, Ugarte M, Chao M, et al. Neuroprotection in relation to retinal ischemia and relevance to glaucoma. Surv Ophthalmol. 1999;43(suppl 1):S102–28. doi: 10.1016/s0039-6257(99)00044-2. [DOI] [PubMed] [Google Scholar]
- 2.Penn JS, Tolman BL, Henry MM. Oxygen-induced retinopathy in the rat: relationship of retinal nonperfusion to subsequent neovascularization. Invest Ophthalmol Vis Sci. 1994;35:3429–35. [PubMed] [Google Scholar]
- 3.Schmidt D, Bohringer D. Preserved vision despite distinct retinal edema in central retinal artery occlusion. Eur J Med Res. 2006;11:43–5. [PubMed] [Google Scholar]
- 4.Sun MH, Pang JH, Chen SL, et al. Retinal protection from acute glaucoma-induced ischemia-reperfusion injury through pharmacologic induction of heme oxygenase-1. Invest Ophthalmol Vis Sci. 2010;51:4798–808. doi: 10.1167/iovs.09-4086. [DOI] [PubMed] [Google Scholar]
- 5.Zhang Y, Cho CH, Atchaneeyasakul LO, McFarland T, Appukuttan B, Stout JT. Activation of the mitochondrial apoptotic pathway in a rat model of central retinal artery occlusion. Invest Ophthalmol Vis Sci. 2005;46:2133–9. doi: 10.1167/iovs.04-1235. [DOI] [PubMed] [Google Scholar]
- 6.Zheng L, Gong B, Hatala DA, Kern TS. Retinal ischemia and reperfusion causes capillary degeneration: similarities to diabetes. Invest Ophthalmol Vis Sci. 2007;48:361–7. doi: 10.1167/iovs.06-0510. [DOI] [PubMed] [Google Scholar]
- 7.Foulds WS, Johnson NF. Rabbit electroretinogram during recovery from induced ischaemia. Trans Ophthalmol Soc UK. 1974;94:383–93. [PubMed] [Google Scholar]
- 8.Osborne NN, Larsen AK. Antigens associated with specific retinal cells are affected by ischaemia caused by raised intraocular pressure: effect of glutamate antagonists. Neurochem Int. 1996;29:263–70. doi: 10.1016/0197-0186(96)00005-8. [DOI] [PubMed] [Google Scholar]
- 9.Safa R, Osborne NN. Retinas from albino rats are more susceptible to ischaemic damage than age-matched pigmented animals. Brain Res. 2000;862:36–42. doi: 10.1016/s0006-8993(00)02090-4. [DOI] [PubMed] [Google Scholar]
- 10.Selles-Navarro I, Villegas-Perez MP, Salvador-Silva M, Ruiz-Gomez JM, Vidal-Sanz M. Retinal ganglion cell death after different transient periods of pressure-induced ischemia and survival intervals. A quantitative in vivo study. Invest Ophthalmol Vis Sci. 1996;37:2002–14. [PubMed] [Google Scholar]
- 11.Osborne NN, Casson RJ, Wood JPM, Chidlow G, Graham M, Melena J. Retinal ischemia: mechanisms of damage and potential therapeutic strategies. Prog Retin Eye Res. 2004;23:91–147. doi: 10.1016/j.preteyeres.2003.12.001. [DOI] [PubMed] [Google Scholar]
- 12.Bek T. Inner retinal ischaemia: current understanding and needs for further investigations. Acta Ophthalmol. 2009;87:362–7. doi: 10.1111/j.1755-3768.2008.01429.x. [DOI] [PubMed] [Google Scholar]
- 13.Goldblum D, Mittag T. Prospects for relevant glaucoma models with retinal ganglion cell damage in the rodent eye. Vision Res. 2002;42:471–8. doi: 10.1016/s0042-6989(01)00194-8. [DOI] [PubMed] [Google Scholar]
- 14.Nakano N, Ikeda HO, Hangai M, et al. Longitudinal and simultaneous imaging of retinal ganglion cells and inner retinal layers in a mouse model of glaucoma induced by N-methyl-D-aspartate. Invest Ophthalmol Vis Sci. 2011;52:8754–62. doi: 10.1167/iovs.10-6654. [DOI] [PubMed] [Google Scholar]
- 15.Abcouwer SF, Lin CM, Wolpert EB, et al. Effects of ischemic preconditioning and bevacizumab on apoptosis and vascular permeability following retinal ischemia-reperfusion injury. Invest Ophthalmol Vis Sci. 2010;51:5920–33. doi: 10.1167/iovs.10-5264. [DOI] [PubMed] [Google Scholar]
- 16.Ahmed F, Brown KM, Stephan DA, Morrison JC, Johnson EC, Tomarev SI. Microarray analysis of changes in mRNA levels in the rat retina after experimental elevation of intraocular pressure. Invest Ophthalmol Vis Sci. 2004;45:1247–58. doi: 10.1167/iovs.03-1123. [DOI] [PubMed] [Google Scholar]
- 17.Chowdhury UR, Jea SY, Oh DJ, Rhee DJ, Fautsch MP. Expression profile of the matricellular protein osteopontin in primary open-angle glaucoma and the normal human eye. Invest Ophthalmol Vis Sci. 2011;52:6443–51. doi: 10.1167/iovs.11-7409. [DOI] [PMC free article] [PubMed] [Google Scholar]
- 18.Grozdanic SD, Lazic T, Kuehn MH, et al. Exogenous modulation of intrinsic optic nerve neuroprotective activity. Graefes Arch Clin Exp Ophthalmol. 2010;248:1105–16. doi: 10.1007/s00417-010-1336-7. [DOI] [PMC free article] [PubMed] [Google Scholar]
- 19.Miyahara T, Kikuchi T, Akimoto M, Kurokawa T, Shibuki H, Yoshimura N. Gene microarray analysis of experimental glaucomatous retina from cynomologous monkey. Invest Ophthalmol Vis Sci. 2003;44:4347–56. doi: 10.1167/iovs.02-1032. [DOI] [PubMed] [Google Scholar]
- 20.Nakajima Y, Shimazawa M, Mishima S, Hara H. Neuroprotective effects of Brazilian green propolis and its main constituents against oxygen-glucose deprivation stress, with a gene-expression analysis. Phytother Res. 2009;23:1431–8. doi: 10.1002/ptr.2797. [DOI] [PubMed] [Google Scholar]
- 21.Naskar R, Thanos S. Retinal gene profiling in a hereditary rodent model of elevated intraocular pressure. Mol Vis. 2006;12:1199–210. [PubMed] [Google Scholar]
- 22.Panagis L, Zhao X, Ge Y, Ren L, Mittag TW, Danias J. Gene expression changes in areas of focal loss of retinal ganglion cells in the retina of DBA/2J mice. Invest Ophthalmol Vis Sci. 2010;51:2024–34. doi: 10.1167/iovs.09-3560. [DOI] [PMC free article] [PubMed] [Google Scholar]
- 23.Panagis L, Zhao X, Ge Y, Ren L, Mittag TW, Danias J. Retinal gene expression changes related to IOP exposure and axonal loss in DBA/2J mice. Invest Ophthalmol Vis Sci. 2011;52:7807–16. doi: 10.1167/iovs.10-7063. [DOI] [PMC free article] [PubMed] [Google Scholar]
- 24.Steele MR, Inman DM, Calkins DJ, Horner PJ, Vetter ML. Microarray analysis of retinal gene expression in the DBA/2 J model of glaucoma. Invest Ophthalmol Vis Sci. 2006;47:977–85. doi: 10.1167/iovs.05-0865. [DOI] [PubMed] [Google Scholar]
- 25.Wang DY, Ray A, Rodgers K, et al. Global gene expression changes in rat retinal ganglion cells in experimental glaucoma. Invest Ophthalmol Vis Sci. 2010;51:4084–95. doi: 10.1167/iovs.09-4864. [DOI] [PMC free article] [PubMed] [Google Scholar]
- 26.Yang Z, Zack DJ. What has gene expression profiling taught us about glaucoma? Exp Eye Res. 2011;93:191–5. doi: 10.1016/j.exer.2010.10.001. [DOI] [PubMed] [Google Scholar]
- 27.Yoshimura N, Kikuchi T, Kuroiwa S, Gaun S. Differential temporal and spatial expression of immediate early genes in retinal neurons after ischemia-reperfusion injury. Invest Ophthalmol Vis Sci. 2003;44:2211–20. doi: 10.1167/iovs.02-0704. [DOI] [PubMed] [Google Scholar]
- 28.Kamphuis W, Dijk F, van Soest S, Bergen AA. Global gene expression profiling of ischemic preconditioning in the rat retina. Mol Vis. 2007;13:1020–30. [PMC free article] [PubMed] [Google Scholar]
- 29.Kamphuis W, Dijk F, Kraan W, Bergen AA. Transfer of lens-specific transcripts to retinal RNA samples may underlie observed changes in crystallin-gene transcript levels after ischemia. Mol Vis. 2007;13:220–8. [PMC free article] [PubMed] [Google Scholar]
- 30.Livak KJ, Schmittgen TD. Analysis of relative gene expression data using real-time quantitative PCR and the 2(-Delta Delta C(T)) Method. Methods. 2001;25:402–8. doi: 10.1006/meth.2001.1262. [DOI] [PubMed] [Google Scholar]
- 31.Singh M, Savitz SI, Hoque R, et al. Cell-specific caspase expression by different neuronal phenotypes in transient retinal ischemia. J Neurochem. 2001;77:466–75. doi: 10.1046/j.1471-4159.2001.00258.x. [DOI] [PubMed] [Google Scholar]
- 32.Kim BJ, Braun TA, Wordinger RJ, Clark AF. Progressive morphological changes and impaired retinal function associated with temporal regulation of gene expression after retinal ischemia/reperfusion injury in mice. Mol Neurodegener. 2013;8:21. doi: 10.1186/1750-1326-8-21. [DOI] [PMC free article] [PubMed] [Google Scholar]
- 33.Parker RO, Crouch RK. Retinol dehydrogenases (RDHs) in the visual cycle. Exp Eye Res. 2010;91:788–92. doi: 10.1016/j.exer.2010.08.013. [DOI] [PMC free article] [PubMed] [Google Scholar]
- 34.Morimura H, Saindelle-Ribeaudeau F, Berson EL, Dryja TP. Mutations in RGR, encoding a light-sensitive opsin homologue, in patients with retinitis pigmentosa. Nat Genet. 1999;23:393–4. doi: 10.1038/70496. [DOI] [PubMed] [Google Scholar]
- 35.Kwon SJ, Song JJ, Lee YJ. Signal pathway of hypoxia-inducible factor-1alpha phosphorylation and its interaction with von Hippel-Lindau tumor suppressor protein during ischemia in MiaPaCa-2 pancreatic cancer cells. Clin Cancer Res. 2005;11:7607–13. doi: 10.1158/1078-0432.CCR-05-0981. [DOI] [PubMed] [Google Scholar]
- 36.Ahluwalia A, Tarnawski AS. Critical role of hypoxia sensor-HIF-1alpha in VEGF gene activation. Implications for angiogenesis and tissue injury healing. Curr Med Chem. 2012;19:90–7. doi: 10.2174/092986712803413944. [DOI] [PubMed] [Google Scholar]
- 37.Lee SH, Che X, Jeong JH, et al. Runx2 protein stabilizes hypoxia-inducible factor-1alpha through competition with von Hippel-Lindau protein (pVHL) and stimulates angiogenesis in growth plate hypertrophic chondrocytes. J Biol Chem. 2012;287:14760–71. doi: 10.1074/jbc.M112.340232. [DOI] [PMC free article] [PubMed] [Google Scholar]
- 38.Danton GH, Dietrich WD. Inflammatory mechanisms after ischemia and stroke. J Neuropathol Exp Neurol. 2003;62:127–36. doi: 10.1093/jnen/62.2.127. [DOI] [PubMed] [Google Scholar]
- 39.Stoll G, Jander S, Schroeter M. Detrimental and beneficial effects of injury-induced inflammation and cytokine expression in the nervous system. Adv Exp Med Biol. 2002;513:87–113. doi: 10.1007/978-1-4615-0123-7_3. [DOI] [PubMed] [Google Scholar]
- 40.Kamphuis W, Dijk F, Bergen AAB. Ischemic preconditioning alters the pattern of gene expression changes in response to full retinal ischemia. Mol Vis. 2007;13:1892–901. [PubMed] [Google Scholar]
- 41.Kramer M, Dadon S, Hasanreisoglu M, et al. Proinflammatory cytokines in a mouse model of central retinal artery occlusion. Mol Vis. 2009;15:885–94. [PMC free article] [PubMed] [Google Scholar]
- 42.Prasad SS, Kojic L, Wen YH, et al. Retinal gene expression after central retinal artery ligation: effects of ischemia and reperfusion. Invest Ophthalmol Vis Sci. 2010;51:6207–19. doi: 10.1167/iovs.10-5632. [DOI] [PubMed] [Google Scholar]
- 43.Nichols TC. NF-kappaB and reperfusion injury. Drug News Perspect. 2004;17:99–104. doi: 10.1358/dnp.2004.17.2.829042. [DOI] [PubMed] [Google Scholar]
- 44.Lluis JM, Buricchi F, Chiarugi P, Morales A, Fernandez-Checa JC. Dual role of mitochondrial reactive oxygen species in hypoxia signaling: activation of nuclear factor-kappa B via c-SRC-and oxidant-dependent cell death. Cancer Res. 2007;67:7368–77. doi: 10.1158/0008-5472.CAN-07-0515. [DOI] [PubMed] [Google Scholar]
- 45.Fan W, Cooper NG. Glutamate-induced NFkappaB activation in the retina. Invest Ophthalmol Vis Sci. 2009;50:917–25. doi: 10.1167/iovs.08-2555. [DOI] [PMC free article] [PubMed] [Google Scholar]
- 46.Freeman RS, Estus S, Johnson EM. Analysis of cell cycle-related gene-expression in postmitotic neurons-selective induction of cyclin D1 during programmed cell-death. Neuron. 1994;12:343–55. doi: 10.1016/0896-6273(94)90276-3. [DOI] [PubMed] [Google Scholar]
- 47.Allen-Jennings AE, Hartman MG, Kociba GJ, Hai T. The roles of ATF3 in glucose homeostasis-a transgenic mouse model with liver dysfunction and defects in endocrine pancreas. J Biol Chem. 2001;276:29507–14. doi: 10.1074/jbc.M100986200. [DOI] [PubMed] [Google Scholar]
- 48.Okamoto Y, Chaves A, Chen JC, et al. Transgenic mice with cardiac-specific expression of activating transcription factor 3, a stress-inducible gene, have conduction abnormalities and contractile dysfunction. Am J Pathol. 2001;159:639–50. doi: 10.1016/S0002-9440(10)61735-X. [DOI] [PMC free article] [PubMed] [Google Scholar]
- 49.Yin TG, Sandhu G, Wolfgang CD, et al. Tissue-specific pattern of stress kinase activation in ischemic/reperfused heart and kidney. J Biol Chem. 1997;272:19943–50. doi: 10.1074/jbc.272.32.19943. [DOI] [PubMed] [Google Scholar]
- 50.Yoshida T, Sugiura H, Mitobe M, et al. ATF3 protects against renal ischemia-reperfusion injury. J Am Soc Nephrol. 2008;19:217–24. doi: 10.1681/ASN.2005111155. [DOI] [PMC free article] [PubMed] [Google Scholar]
- 51.Arai-Gaun S, Katai N, Kikuchi T, Kurokawa T, Ohta K, Yoshimura N. Heme oxygenase-1 induced in muller cells plays a protective role in retinal ischemia-reperfusion injury in rats. Invest Ophthalmol Vis Sci. 2004;45:4226–32. doi: 10.1167/iovs.04-0450. [DOI] [PubMed] [Google Scholar]
- 52.Peng PH, Ko ML, Chen CF, Juan SH. Haem oxygenase-1 gene transfer protects retinal ganglion cells from ischaemia/reperfusion injury. Clin Sci (Lond) 2008;115:335–42. doi: 10.1042/CS20070384. [DOI] [PubMed] [Google Scholar]
- 53.Gasque P, Neal JW, Singhrao SK, et al. Roles of the complement system in human neurodegenerative disorders: pro-inflammatory and tissue remodeling activities. Mol Neurobiol. 2002;25:1–17. doi: 10.1385/mn:25:1:001. [DOI] [PubMed] [Google Scholar]
- 54.Cowell RM, Plane JM, Silverstein FS. Complement activation contributes to hypoxic-ischemic brain injury in neonatal rats. J Neurosci. 2003;23:9459–68. doi: 10.1523/JNEUROSCI.23-28-09459.2003. [DOI] [PMC free article] [PubMed] [Google Scholar]
- 55.Mocco J, Mack WJ, Ducruet AF, et al. Complement component C3 mediates inflammatory injury following focal cerebral ischemia. Circ Res. 2006;99:209–17. doi: 10.1161/01.RES.0000232544.90675.42. [DOI] [PubMed] [Google Scholar]
- 56.Ten VS, Sosunov SA, Mazer SP, et al. C1q-deficiency is neuroprotective against hypoxic-ischemic brain injury in neonatal mice. Stroke. 2005;36:2244–50. doi: 10.1161/01.STR.0000182237.20807.d0. [DOI] [PubMed] [Google Scholar]
- 57.Pickering MC, Cook HT, Warren J, et al. Uncontrolled C3 activation causes membranoproliferative glomerulonephritis in mice deficient in complement factor H. Nat Genet. 2002;31:424–8. doi: 10.1038/ng912. [DOI] [PubMed] [Google Scholar]
- 58.Jokiranta TS, Zipfel PF, Hakulinen J, et al. Analysis of the recognition mechanism of the alternative pathway of complement by monoclonal anti-factor H antibodies: evidence for multiple interactions between H and surface bound C3b. FEBS Lett. 1996;393:297–302. doi: 10.1016/0014-5793(96)00905-2. [DOI] [PubMed] [Google Scholar]
- 59.Kuhn S, Zipfel PF. Mapping of the domains required for decay acceleration activity of the human factor H-like protein 1 and factor H. Eur J Immunol. 1996;26:2383–7. doi: 10.1002/eji.1830261017. [DOI] [PubMed] [Google Scholar]
- 60.Pangburn MK, Schreiber RD, Muller-Eberhard HJ. Human complement C3b inactivator: isolation, characterization, and demonstration of an absolute requirement for the serum protein beta1H for cleavage of C3b and C4b in solution. J Exp Med. 1977;146:257–70. doi: 10.1084/jem.146.1.257. [DOI] [PMC free article] [PubMed] [Google Scholar]
- 61.Weiler JM, Daha MR, Austen KF, Fearon DT. Control of the amplification convertase of complement by the plasma protein beta1H. Proc Natl Acad Sci U S A. 1976;73:3268–72. doi: 10.1073/pnas.73.9.3268. [DOI] [PMC free article] [PubMed] [Google Scholar]
- 62.Vorwerk CK, Gorla MSR, Dreyer EB. An experimental basis for implicating excitotoxicity in glaucomatous optic neuropathy. Surv Ophthalmol. 1999;43:S142–50. doi: 10.1016/s0039-6257(99)00017-x. [DOI] [PubMed] [Google Scholar]
- 63.Kwon YH, Rickman DW, Baruah S, et al. Vitreous and retinal amino acid concentrations in experimental central retinal artery occlusion in the primate. Eye. 2005;19:455–63. doi: 10.1038/sj.eye.6701546. [DOI] [PubMed] [Google Scholar]
- 64.Nucci C, Tartaglione R, Rombola L, Morrone LA, Fazzi E, Bagetta G. Neurochemical evidence to implicate elevated glutamate in the mechanisms of high intraocular pressure (IOP)-induced retinal ganglion cell death in rat. Neurotoxicology. 2005;26:935–41. doi: 10.1016/j.neuro.2005.06.002. [DOI] [PubMed] [Google Scholar]
- 65.Arning L, Kraus PH, Valentin S, Saft C, Andrich J, Epplen JT. NR2A and NR2B receptor gene variations modify age at onset in Huntington disease. Neurogenetics. 2005;6:25–8. doi: 10.1007/s10048-004-0198-8. [DOI] [PubMed] [Google Scholar]
- 66.Brandoli C, Sanna A, De Bernardi MA, Follesa P, Brooker G, Mocchetti I. Brain-derived neurotrophic factor and basic fibroblast growth factor downregulate NMDA receptor function in cerebellar granule cells. J Neurosci. 1998;18:7953–61. doi: 10.1523/JNEUROSCI.18-19-07953.1998. [DOI] [PMC free article] [PubMed] [Google Scholar]
- 67.Van Kirk CA, VanGuilder HD, Young M, Farley JA, Sonntag WE, Freeman WM. Age-related alterations in retinal neurovascular and inflammatory transcripts. Mol Vis. 2011;17:1261–74. [PMC free article] [PubMed] [Google Scholar]
- 68.Copani A, Bruno VMG, Barresi V, Battaglia G, Condorelli DF, Nicoletti F. Activation of metabotropic glutamate receptors prevents neuronal apoptosis in culture. J Neurochem. 1995;64:101–8. doi: 10.1046/j.1471-4159.1995.64010101.x. [DOI] [PubMed] [Google Scholar]
- 69.Nicoletti F, Bruno V, Copani A, Casabona G, Knopfel T. Metabotropic glutamate receptors: a new target for the therapy of neurodegenerative disorders? Trends Neurosci. 1996;19:267–71. doi: 10.1016/S0166-2236(96)20019-0. [DOI] [PubMed] [Google Scholar]
Associated Data
This section collects any data citations, data availability statements, or supplementary materials included in this article.
Supplementary Materials
Supplementary Tables 1–3. These tables 1 provide the top 30 genes (15 upregulated and 15 downregulated genes) for each of the three stages for IR-injury.