Summary
In this paper, we extend the 3D multispecies diffuse-interface model of the tumor growth, which was derived in Wise et al. (Three-dimensional multispecies nonlinear tumor growth-I: model and numerical method, J. Theor. Biol. 253 (2008) 524–543), and incorporate the effect of a stiff membrane to model tumor growth in a confined microenvironment. We then develop accurate and efficient numerical methods to solve the model. When the membrane is endowed with a surface energy, the model is variational, and the numerical scheme, which involves adaptive mesh refinement and a nonlinear multigrid finite difference method, is demonstrably shown to be energy stable. Namely, in the absence of cell proliferation and death, the discrete energy is a nonincreasing function of time for any time and space steps. When a simplified model of membrane elastic energy is used, the resulting model is derived analogously to the surface energy case. However, the elastic energy model is actually nonvariational because certain coupling terms are neglected. Nevertheless, a very stable numerical scheme is developed following the strategy used in the surface energy case. 2D and 3D simulations are performed that demonstrate the accuracy of the algorithm and illustrate the shape instabilities and nonlinear effects of membrane elastic forces that may resist or enhance growth of the tumor. Compared with the standard Crank–Nicholson method, the time step can be up to 25 times larger using the new approach.
Keywords: mixture model, tumor progression, encapsulation, ductal carcinoma in situ, energy stable method, adaptive finite difference method, multigrid method
1. Introduction
Tumor growth is a complex biological phenomenon and is influenced by many factors, such as cell–cell and cell–matrix adhesion, mechanical stress, cell motility and transport of oxygen, and nutrients and growth factors [1]. Mathematical modeling of cancer gives important insights on tumor progression, helps explain experimental and clinical observations, and helps provide optimal treatment strategies. In the past several years, more and more research has been conducted on mathematical models of cancer, and numerical simulations of tumor growth have been performed. See the recent reviews [2–21, 71]. There are now a variety of modeling strategies available for investigating various aspects of cancer, such as cellular automata and agent-based modeling, single-phase continuum and multiphase mixture models, and methods that combine both continuum and discrete components.
Nonlinear continuum models have been used to study the effects of shape instabilities on avascular, angiogenic, and vascular solid tumor growth. Shape instabilities are important because the mechanisms that control the tumor morphology also control the ability of the tumor to be locally invasive, and local invasiveness is believed to be a precursor of metastasis [22]. Using a boundary integral method, Cristini et al. [23] performed the first fully nonlinear simulations of a continuum model of avascular and vascular tumor growth in two dimensions. This work was extended to three dimensions [24], to coupled models of tumor growth and angiogenesis [25, 26], and in a heterogeneous tumor environment [27, 73, 74] using level set methods. The interaction of multiple tumor cell species has been modeled by multiphase mixture models (see, e.g., [19, 28–48]. In these models, the mechanical effects of the stroma, the extracellular matrix, the basement membrane, and the connective tissue were either neglected or highly idealized. Recently, using multiphase porous media mechanics and thermodynamically constrained averaging theory, Sciumè et al. [49] modeled growing tumors as a multiphase medium containing extracellular matrix, tumor and host cells, and interstitial liquid. Numerical simulations were performed that characterized tumor growth as a function of the initial tumor-to-healthy cell density ratio, nutrient concentration, mechanical strain, cell adhesion, and geometry. The interactions of a growing tumor and a basement membrane were studied by Bresch et al. [50] who used an age-structured tumor model that accounts for both proliferating and quiescent tumor cells, together with a level set method to model the basement membrane following an approach developed by Cottet and Maitre [51] for fluid–structure interactions that penalizes local stretching to model the membrane elasticity. 2D and 3D simulations were performed to show the effects of the membrane and nutrient heterogeneity on tumor growth.
Here, we adapt the approach from [50] for use in multiphase mixture models. We first consider the case in which the membrane has surface energy. The governing equations are derived using a variational approach, and the numerical scheme, which involves adaptive mesh refinement and a nonlinear multigrid finite difference method, is demonstrably shown to be energy stable. Namely, in the absence of cell proliferation and death, the discrete energy is a nonincreasing function of time for any time and space steps. We then consider a simplified model of membrane elasticity where global stretching is penalized. The governing equations are derived analogously to the surface energy case, although the model is not fully variational because certain coupling terms are dropped. Nevertheless, a very stable numerical scheme is developed following the strategy used in the surface energy case.
Energy stable numerical methods were first developed for Cahn–Hilliard equations by Eyre [52]. Recently, Wise [53] extended this method to consider Cahn–Hilliard–Hele–Shaw equations, where a nonlocal pressure was considered. This approach has since been extended to other gradient flow equations such as the phase field crystal [54] and modified phase field crystal equations [55, 56], as well as other problems in materials science involving crystal growth (e.g., [57]) and thin film epitaxy (e.g., [58]). Here, we extend the approach developed by Wise for the Cahn–Hilliard–Hele– Shaw equation to incorporate an encapsulating or basement membrane and the corresponding forces the membrane introduces. Although the work presented here contains numerous simplifications, the underlying modeling approach has been successfully used previously to compare with experiments (e.g., [39, 59]). Further, the modeling strategy and numerical methods presented here are generalizable to more complex, thermodynamically consistent models that account for additional biophysical detail (e.g., [6, 60]).
This paper is organized as follows. In Section 2, we extend the diffuse-interface model of Wise et al. [44] by incorporating a simplified description of membrane elasticity and then construct a stable finite difference scheme to efficiently solve the governing equations. In Section 3, the convergence rate of the numerical scheme is tested, and numerical simulations are performed considering different membrane stiffnesses and geometries in two and three dimensions. Finally, this paper is summarized and future work is discussed in Section 4.
2. Mathematical Model
In this section, we present a mathematical model of tumor growth with a simplified model of a basement membrane. We begin by recalling the nondimensional tumor growth model from Wise et al. [44], where a thermodynamically consistent diffuse-interface continuum model of multispecies tumor growth was formulated, analyzed, and simulated. The authors accounted for mechanical interactions, mainly focused on cell–cell adhesion among the tumor and host. This model converges to classical sharp-interface formulations (e.g., [23, 61, 62]). Both the diffuse-interface and sharp-interface models have been successfully used in comparison with experiments (e.g., [39, 59, 63, 64, 72]).
Here, we assume that the tumor and membrane are evolving in a bounded tissue domain Ω ⊂ Rd, d = 2 or 3. The dimensionless dependent variables defined in Ω are as follows:
ϕT is the volume fraction of the tumor cells;
ϕV is the volume fraction of the viable tumor cells;
ϕD is the volume fraction of the dead cells;
ϕH is the volume fraction of the host tissue;
ϕW is the volume fraction of the water;
uS is the solid tumor velocity;
uW is the interstitial fluid velocity;
p is the pressure;
q is the interstitial fluid pressure; and
n is the nutrient concentration.
We assume that there are no voids:
| (1) |
where ϕT = ϕV + ϕD. Following Wise et al. [44], we assume for simplicity that ϕW = ϕ̄W is constant. Then, ϕS = ϕH + ϕT = ϕ̄s = 1 − ϕ̄W. Rescaling the solid volume fraction by ϕ̄S (e.g., ϕ̃T = ϕT/ϕS), we obtain ϕ̃H + ϕ̃T = 1. Hereafter, we drop the tilde notation.
2.1. Total cell–cell interaction (adhesion) energy
It is assumed that tumor cells prefer to adhere to each other rather than to the host. Following the classical theory of phase transitions and Wise et al. [44], we use the following cell–cell adhesion energy E:
where is a double-well bulk energy minimized at ϕT = 0 and ϕT = 1, which characterizes the differential adhesiveness of the tumor and host cells. The parameter γ measures the cell–cell adhesion force, and is a gradient energy, with ε a parameter that characterizes strength of the penalty. We note that in practice, ε measures the thickness of the diffuse interface that separates the tumor and host domains.
2.2. Nondimensional equations
We now introduce a diffuse-interface continuum model of tumor growth described in Wise et al. [44]. The equations are nondimensionalized using the nutrient diffusion length and mitosis time scales. We refer the reader to [44] for more details of the nondimensionalization. With the assumptions that tumor cells move together and the densities of the components are matched, the volume fraction ϕT obeys the mass conservation equation
| (2) |
| (3) |
where M > 0 represents the diffusive mobility of the tumor cells, and μ is the chemical potential. The source term ST is specified later in Section 2.3. Note that because the density of tumor cells is constant, we absorbed it into the flux and source terms. Further, the source term is different from that used in [44] where the ϕT multiplicative factor of ST was not considered. This particular choice, which differs from the Wise et al. model only in the diffuse interface where ϕT transitions from 1 inside the tumor to 0 in the tumor exterior, is motivated in the succeeding discussion.
Instead of solving for ϕV, an evolution equation for the volume fraction of dead cells ϕD is used
| (4) |
where the source term of dead cells SD is also given in Section 2.3. Knowing ϕT and ϕD, we compute the volume fraction of viable tumor cells by ϕV = ϕT − ϕD.
The solid tumor velocity uS, which is the mass-averaged velocity of all the components, is assumed to be given by Darcy's law [44]
| (5) |
where we have assumed a constant motility that is scaled out when we nondimensionalize the equations. Note that we have implicitly assumed that all the components are tightly packed so that they all move with the mass-averaged velocity field. Assuming that the source of mass in the host tissue is SH = ϕHST, where ϕH = 1 − ϕT, velocity is constrained to satisfy [44]
| (6) |
Note that the source SH is nonzero only in the diffuse-interface region. Together, Eqs. (5) and (6) constitute a Poisson equation for the pressure p
| (7) |
The interstitial fluid velocity can also be modeled using Darcy's law uW = − ∇q such that ∇ ·uW = −ST by mass conservation, which couples the solid and liquid components [44]. With the choice, Eq. (2) can be rewritten as follows:
| (8) |
Because the time scale for nutrient diffusion is much faster (e.g., ∼ 1 min) than the rate of cell proliferation (e.g., ∼ 1 day), the nutrient is assumed to evolve quasistatically:
| (9) |
where we have neglected the nutrient uptake by host tissue because this is small compared with the uptake by tumor cells (e.g., see [44] for details and references). The diffusion coefficient D (ϕT) and nutrient capillary source term TC(ϕT,n) are
| (10) |
| (11) |
where DH is the nondimensional nutrient diffusion coefficient in the host domain, and denote the nutrient transfer rates for preexisting vascularization in the tumor and host domains, and nc is the nutrient level in the capillaries. The function Q(ϕ) is used to interpolate between DH and DT = 1, and is defined as
with Q(1) = 1, Q(1/2) = 1/2, and Q(0) = 0.
The earlier equations are valid on the whole domain Ω and not just on the tumor volume ΩT. There are no boundary conditions required for ϕT and ϕD at the tumor boundary ΣT. At the outer boundary, we choose the following boundary conditions
| (12) |
which allow the tumor to leave the domain smoothly [44].
2.3. The mass exchange terms
As described in Wise et al. [44], we suppose that the net source of tumor cells ST is
| (13) |
where the first term on the right-hand side of Eq. (13) describes mitosis. As mitosis occurs, an amount of water is converted into cell mass. The parameter λM is the tumor mitosis rate. Dead cells also undergo cell lysing. When cell lysis occurs, dead cells break down into water; λL is the lysing rate of dead cells.
The net source of dead cells SD is
| (14) |
where the term λAϕV describes the death of cells due to apoptosis with rate λA ≥ 0, the term λNℋ (nN−n)ϕV models the death of cells due to necrosis with rate λN ≥ 0, and ℋ is a Heaviside step function. It is assumed that viable tumor cells necrose based on the level of the local nutrient concentration n; that is, when the nutrient level is below the cell viability limit nN, cells die.
We also consider the effect of compressive stress. Motivated by the results of Cheng et al. [65], we assume that mechanical stress provides feedback on the cell mitosis and apoptosis rates, with pressure providing negative feedback for the former and positive feedback for the latter. Accordingly, we model the dependence of the cell mitosis and apoptosis rates on the pressure p as Hill-type functions:
| (15) |
| (16) |
where a,b,c,d are constants, the parameter λ̄M is the mitosis rate without feedback, χM, χA = 0,1, and p+ = max(0, p). We do not model the feedback due to tensile stress, although this may be considered in a future work.
2.4. Membrane surface energy
We now consider the effects of a basement membrane, Σ, on the growing tumor. We use a phase field approach and introduce a function ϕ̃ such that corresponds to Σ. We motivate the approach by considering first the membrane surface energy
Again, we take , a double-well potential; the parameter γ̃ measures the cell–cell adhesion force; is a gradient energy that allows intermixing, and ε̃ measures the thickness of the diffuse interface between the basement membrane and the host tissue.
We assume that the membrane moves with the velocity uS. Here, we use an advective Cahn–Hilliard type equation to approximate the transport of ϕ̃
| (17) |
| (18) |
where the mobility is localized on the membrane. The function μ̃ is the membrane chemical potential.
The membrane energy contributes an extra resistive force to the velocity field uS, which now becomes
| (19) |
where γ̃ is a measure of the membrane surface tension. Equations (17) and (18) are accompanied with the boundary conditions
The governing equations of our new model then consist of Eqs. (2)–(4), (7) –(9), and (17)–(18) with the velocity uS given by Eq. (19). This new model is thermodynamically consistent in the sense that under the assumption that there is no source, that is, ST = 0, the total energy Etot, which is the sum of E and Es, is nonincreasing in time. This is seen as follows: The time derivative of the total energy Etot is
| (20) |
Substituting Eqs. (2) and (17) into Eq. (20), using integration by parts and dropping the boundary terms, this gives
where we denote
Rewriting I2 and using the condition ∇ · uS = 0 (because ST = 0), one obtains
Further, by using integration by parts and the divergence theorem, and assuming that the tumor does not hit the boundary, I2 becomes
We rewrite I2 by using Eq. (19)
Combining this with I1 gives
2.5. A simplified description of membrane elastic energy
We next take into account a simplified version of the membrane elastic energy instead of the membrane surface energy considered in the previous section. The elastic energy is as follows:
where A denotes the stiffness, and χ(x,t) is a template function. For simplicity, we choose χ(x,t) =ϕ̃(x,0). Thus, deformations from the original state are penalized. Then, our new model with the membrane elastic energy can be obtained by using a variational approach but dropping the A-dependent term in chemical potential μ̃ and the γ̃ term in the velocity equation. Because of these dropped terms, the elastic energy model is not variational, and we cannot guarantee that the elastic energy is nonincreasing in time. While keeping the γ̃ term is not expected to yield qualitatively different results from those presented here, the A-dependent term in μ̃ is more problematic as it disrupts the smooth profile of ϕ̃ across the membrane surface, which is why we use the advective Cahn–Hilliard equation derived earlier to approximate the transport of ϕ̃ To summarize, the equations for the tumor and membrane are thus
| (21) |
| (22) |
| (23) |
| (24) |
| (25) |
and
| (26) |
| (27) |
Note that the elastic forces induce the additional term Aϕ̃∇(χ(x, t) − ϕ̃) in the velocity field uS. The nutrient equations (9)–(11) are unchanged.
2.6. A discrete time and continuous space scheme
To solve the system of equations governing tumor growth with an elastic membrane, we develop a stable numerical method. To motivate the approach, we first develop an energy stable scheme for the tumor growth model with the membrane surface energy in Eqs. (2)–(4), (7) – (9), and (17)–(18). The scheme, which is first order accurate in time and second order accurate in space, is based on a convex splitting approach (see [52–56, 58, 66–68]) and has two important properties: (1) unconditional energy stability and (2) unconditional unique solvability [53]. The key idea is that the energy Etot admits a (not necessarily unique) splitting into purely convex and concave energies, that is, Etot = Ec − Ee, where Ec and Ee are convex, although not necessarily strictly convex [52, 68]. Using the notation Ec and Ee from Eyre [52], where Ec refers to the contractive part of the energy (convex) and Ee refers to the expansive part of the energy (concave), we consider a canonical splitting of the surface energy
| (28) |
and
| (29) |
The approach here is based upon the following estimate that was proved in Wise et al. [68].
Theorem 2.1
Suppose that Ω = (0, Lx) × (0, Ly), ϕ, ψ ∈ H2 (Ω), and ∂nϕ = 0 on ∂Ω. Consider the canonical convex splitting of the energy Etot into Etot = Ec − Ee given in Eqs. (28) and (29). Then,
| (30) |
where δϕ denotes the variational derivative with respect to the argument of the energy, and Lx and Ly are positive real numbers.
We do not consider the motion of the extracellular water hereafter, because it decouples from the evolution of the solid volume fractions and the membrane. Taking ST = SD = 0, we propose the semi-implicit scheme:
| (31) |
| (32) |
| (33) |
| (34) |
| (35) |
| (36) |
| (37) |
where s > 0 is the time step size. This generalizes the model developed by Wise [53] for Hele-Shaw flows to incorporate the effects of a basement membrane.
We next prove that the earlier numerical scheme decreases the energy for any time step. Note that because the sources ST = SD = 0, the discretization of the nutrient equation does not affect the results (the discretized nutrient equation is given in the following text). Letting and in Eq. (30) and using Eqs. (31)–(37), one obtains
Hence, the energy is nonincreasing in time, that is,
| (38) |
Using the case with the membrane surface energy as a template, we then take the following semi-implicit scheme for the model with the membrane elastic energy:
| (39) |
| (40) |
| (41) |
| (42) |
| (43) |
| (44) |
| (45) |
Note that because the model with the membrane elastic energy is not variational (because certain terms were dropped as described earlier), we cannot fully duplicate the analysis for the surface energy model. We next rewrite Eqs. (39)–(45) in an equivalent form in which the velocity does not appear explicitly, and we incorporate the source term ST and SD:
| (46) |
| (47) |
| (48) |
| (49) |
| (50) |
| (51) |
The nutrient concentration equation is discretized as
| (52) |
2.6.1. The fully discrete energy stable scheme
Here, we use the notation from Wise et al. [15]. We present the scheme in two dimensions; the 3D case is analogously defined. We assume that the computational domain Ω = (0, Nxh) × (0, Nyh), where Nx and Ny are positive integers, and h > 0 is the grid spacing. We define
where i, j can take on integer and half-integer values. Consider the following three sets of uniform grid points: (i) east-west edge points Eew; (ii) north-south edge points Ens; and (iii) cell-centered points C, defined via
| (53) |
| (54) |
| (55) |
Real-valued grid functions with domains Eew are called east-west edge-centered functions and are identified via ; those with domains Ens are called north-south edge-centered functions and are identified via ; and those with domains C are called cell-centered functions and are identified via ϕi,j = ϕ(xi, yj). The velocity uS is approximated as edge-centered functions. For example, writing is approximated as an east-west edge-centered function, and is approximated as a north-south edge-centered function. All other dependent variables are approximated as cell-centered functions.
To complete the spatial discretization, we replace spatial derivatives by finite difference operators. The Laplacian operator is approximated to second order by
| (56) |
where ϕ is cell-centered. The Laplacian with nonconstant diffusivity/mobility is approximated to second order by
| (57) |
where both ϕ and m are assumed to be cell-centered, and Aave,x and Aave, y are the averaging operators defined component-wise as
We next discretize Eqs. (46)–(52) in space using centered differences to produce a fully discrete energy stable scheme.
| (58) |
| (59) |
| (60) |
| (61) |
| (62) |
| (63) |
and
| (64) |
To solve the fully coupled, nonlinear system of equations at the implicit time step, we use a nonlinear multigrid method [15, 53, 68, 69, 75]. This enables the resulting discrete equations to be solved with nearly optimal complexity. We provide the details of the algorithm in Appendix A.
3. Numerical Results
In this section, we first test the convergence rate of the scheme given in the previous section. We then present 2D and 3D simulations of tumor growth in confined geometries.
3.1. Convergence
To estimate the convergence rate with respect to a mesh with grid spacing h, three different grid spacings 2h, h, and h/2 are used. We calculate the error between two different grid spacings and by
and correspondingly for e2h:h. The rate of convergence is defined as
Here, we consider only the 2D case. The computational domain is Ω =(0, 20) × (0, 20). The initial shape of the tumor is elliptical such that the contour curve with ϕT = 0.5 satisfies the equation
| (65) |
We choose the root-level grid sizes 322, 642, and 1282, respectively. We perform three levels of refinement. That is, the finest mesh sizes are, respectively, h = 20/256, h = 20/512, and h = 20/1024. We take the linear refinement path s = 0.256h. Therefore, the corresponding time step sizes are 0.02, 0.01, and 0.005. The solution is evolved to time T = 20. We present results for the evolution using the membrane surface energy; the results for the algorithm when the elastic energy is used are similar and are not presented. The parameters are given in Table I, and the errors and rate of convergence are shown in Table II. This confirms the overall first order accuracy of the algorithm.
Table I.
Nondimensional parameters in the 2D numerical simulations.
| ε | 0.05 | ε̃ | 0.05 | |
| M | 12.0 | M̃ | 1.0 | |
| γ | 0.2 | γ̃ | 0.5 | |
|
|
0.5 | vU | 1.0 | |
| nc | 1.0 | λM | 1.0 | |
| λA | 0.0 | λN | 3.0 | |
| λL | 1.0 |
Table II.
Errors and convergence rate for the energy stable scheme with a 2D growing tumor. Parameters are given in Table I, the initial condition for the tumor is defined in Eq. (65), and T = 20.
| Root-level grid sizes | 322–642 | 642–1282 | |
| Error | 1.9221 × 10⁻³ | 9.7936 × 10⁻⁴ | |
| Rate | 0.9728 |
Using the same parameters, we compare the performance of our new algorithm with the Crank–Nicholson method [15]. When the membrane surface energy is considered, the largest time step that can be used with the Crank–Nicholson algorithm is s = 0.004, while the new algorithm yields accurate results using time step s = 0.1, a factor of 25 improvement. When the elastic forces are considered (using A = 1.0 with the other parameters unchanged), the largest time step that can be used with the Crank–Nicholson scheme is s = 0.005 while the new scheme can be used with s = 0.07, resulting in a factor of 14 improvement in efficiency. Keeping the other parameters the same, the largest time step s is a decreasing function of the parameter A. Here, we observed that .
3.2. 2D simulations with feedback from mechanical forces
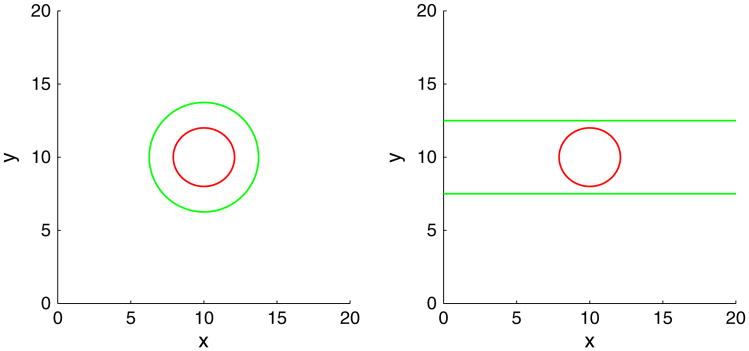
We present 2D simulations of tumor growth in confined geometries using the elastic energy model. The initial tumor is the same as considered in the previous section. We utilize a block-structured Cartesian adaptive mesh where the root-level grid is 322, and there are four levels of refinement—the grid size is halved with each level of refinement (Figure 1). We consider two types of membrane geometries. In the first type, a membrane that encapsulates a tumor (Figure 2 (left)) such that the contour curve with ϕ̃ = 0.5 satisfies {(x, y)|(x − 10)2 + (y − 10)2 = 14} is considered. The second geometry mimics a duct (Figure 2 (right)), where the ϕ̃ = 0.5 contour is given by the horizontal lines y = 7.5 and y = 12.5. The computational domain is Ω =(0,20) × (0,20).We take ε = ε̃ = 0.05, the mobility M = 10, and . The parameters are γ = 0,0.2 and A = 0,1,2,4. The simulations are performed up to time T = 100 and the time step size s = 0.002.
Figure 1.
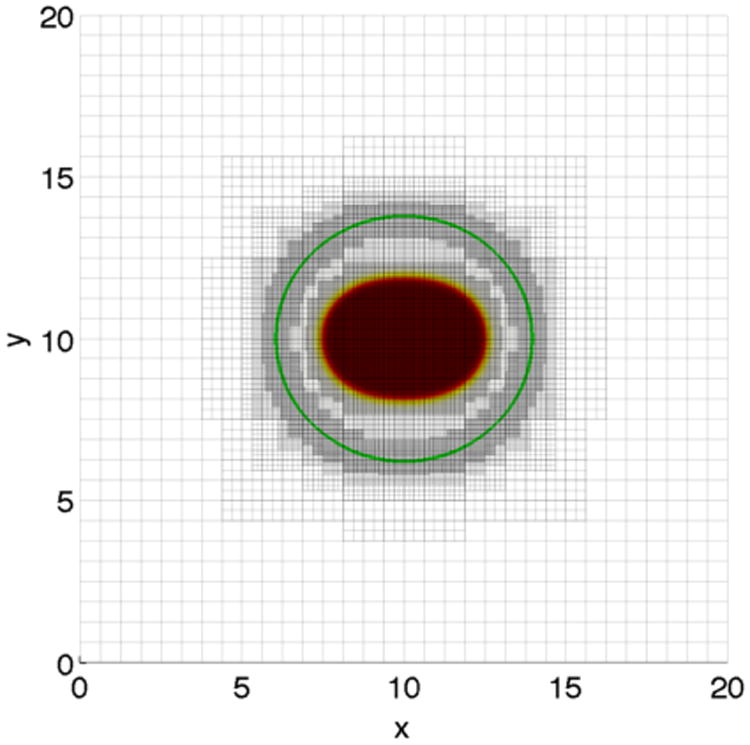
Tumor (solid) and membrane (contour, green) together with the adaptive mesh. Four levels of refinement are performed: the root-level grid is 322.
Figure 2.
Initial membrane (green) and tumor morphologies (red) in 2D.
We begin by investigating in Figures 3 and 6 how a fibrous capsule affects the growth of a tumor as a function of the capsule stiffness and cell–cell adhesion parameters. At early times (T ≤ 20), the evolution is similar for all the cases with the tumor being slightly more deformed when the capsule stiffness A is small. Increasing cell–cell adhesion γ tends to stabilize the tumor shape. At later times, there are significant differences in the evolution for the different cell–cell adhesion parameters and compared with a freely growing tumor when the capsule elastic parameter A = 0. When the cell–cell adhesion γ = 0 (Figure 3), the tumor develops a budding instability resulting first in a dumbbell-like shape (T ≈ 40) that later develops a further instability as the first buds become unstable (T ≈ 80). The pressure in the dead cell region is negative because of the lysing of dead cells (Figure 4). Increasing the capsule stiffness influences the instability with the larger stiffness resulting in the inhibition of instability and the first buds become stable (T ≈ 60), and at later times (T ≈ 80), the tumor pinches off to form two tumor fragments. The stiffer capsules exert more force, and the pressure becomes positive with high values within the domain enclosed by the membrane. Negative pressures are observed at the membrane because of the strong resistive forces (Figure 4). When the cell–cell adhesion is increased (Figure 6), the tumor grows much more stably with the secondary budding instability being suppressed. The capsule stiffness only slightly affects the evolution leading to slightly smaller and less deformed tumors. For comparison, the evolution of tumors using the membrane surface energy rather than the elastic energy are presented in Appendix B. The results are qualitatively similar.
Figure 3.
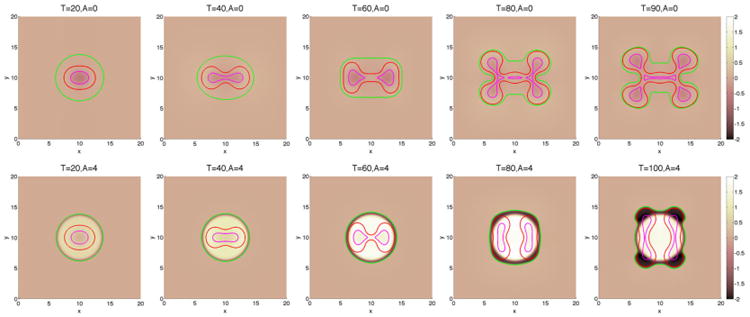
The pressure contours together with the membrane ϕ̃ = 0.5 surface (green), and the tumor ϕT = 0.5 surface (red) with small cell–cell adhesion γ = 0. The dead cells are located primarily within the magenta curve (ϕD = 0.5).
Figure 6.
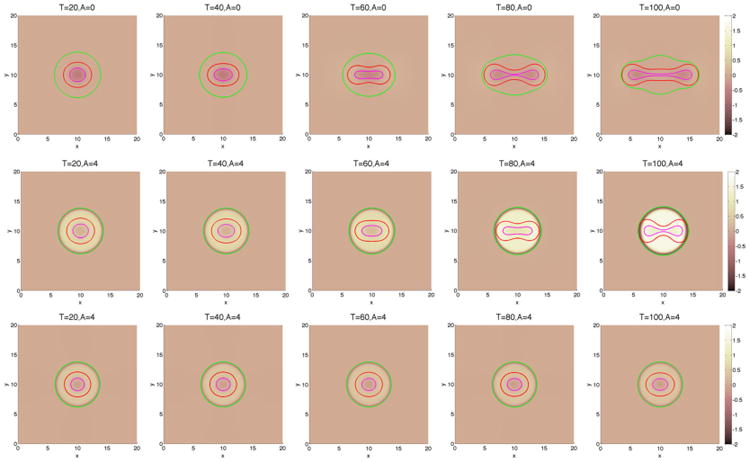
The pressure contours together with the membrane ϕ̃ = 0.5 surface (green), and the tumor ϕT = 0.5 surface (red) with large cell–cell adhesion γ = 0.2. The dead cells are located primarily within the magenta curve (ϕD = 0.5). Top and middle: without feedback; bottom: with feedback.
Figure 4.
Slices of the distributions of pressure (blue), membrane (green), tumor cells (red), and dead cells (magenta) along y = 10 in 2D for the simulation shown in Figure 3.
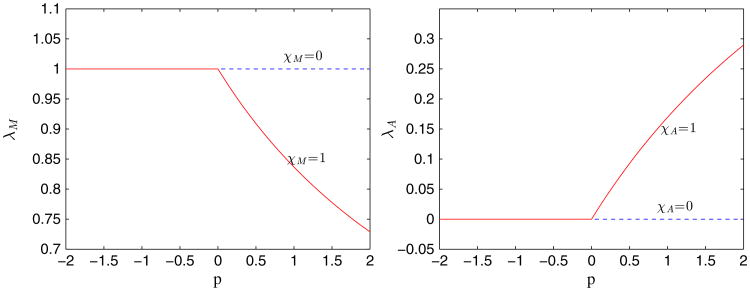
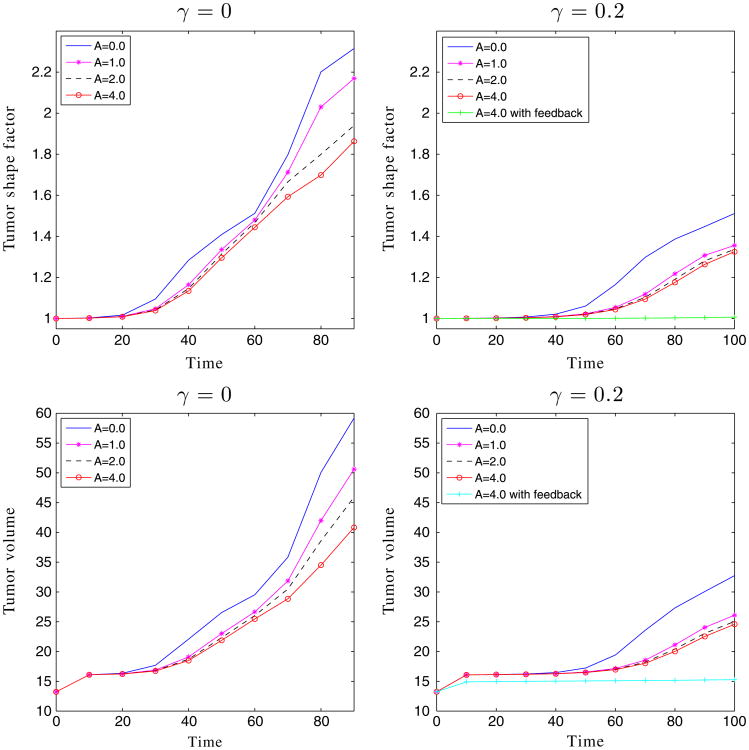
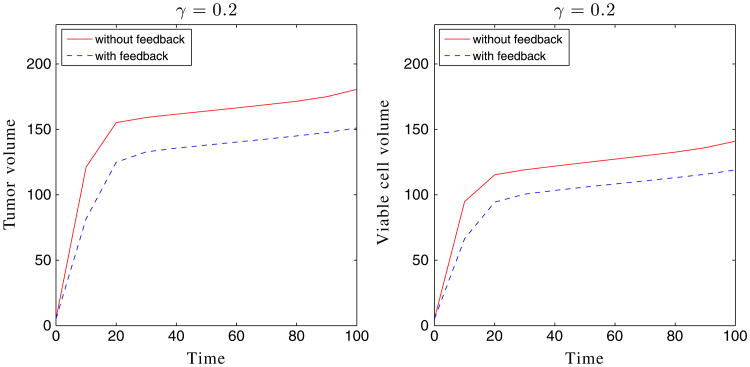
We have observed earlier that for those cases with a large membrane stiffness, for example, the cases with A = 4, there is strong positive pressure produced in the tumor domain. This high pressure may be expected to inhibit viable cell growth and may induce apoptosis [65]. Accordingly, we incorporate these effects here using Eqs. (15) and (16), where we take a = 8, b = 10, c = 39, d = 4.9. Clearly, there is no feedback when χM = χA = 0. As shown in Figure 5 with χM = χA = 1, the cell proliferation rate decreases rapidly while the apoptosis rate correspondingly increases as the pressure p increases. We next consider tumor with feedback in the capsule geometries. Using A = 4 and γ = 0.2, the result is shown in Figure 6 (bottom). The case without feedback (χM = χA = 0) is also shown in Figure 6 (middle). As expected, feedback inhibits the growth of the tumor, and the tumor reaches a steady size early in the evolution, as evidenced by the tumor volumes plotted in Figure 7.
Figure 5.
The effect of mechanical feedback on the mitosis λM and apoptosis λA rates through the pressure p.
Figure 7.
The shape factors and volumes of the encapsulated tumors in Figures 3 and 6.
To measure the shape deformation of the tumor, we introduce the shape factor ShϕT of the tumor:
where a = √4.4 and b = 2. ShϕT = 1 means there is no deformation (i.e., the tumor is the initial ellipse). In addition, the perimeters of the tumor and membrane are computed by
where ϕ = ϕT, ϕ̃ and the volumes of the regions enclosed by the tumor, viable cells, and capsule are given by
where ϕ = ϕT, ϕV, ϕ̃. As seen in Figure 7, the shape factors and tumor volumes are decreasing functions of the membrane stiffness, consistent with the stabilization observed earlier.
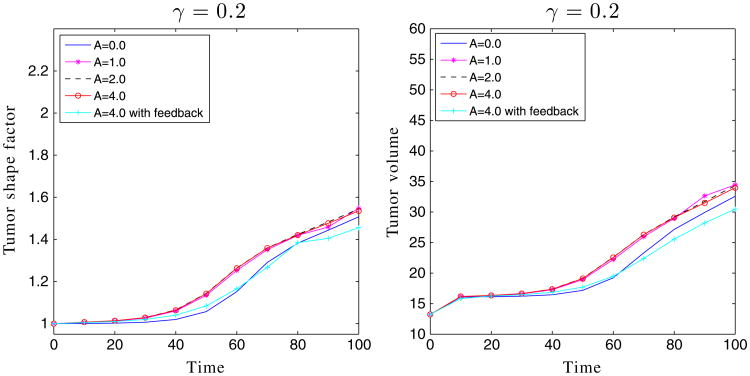
We next consider tumor growth in the ductal geometry in Figure 8. Note that all the parameters are identical to the previous cases, and the only difference is the geometry of the duct and the elastic forces it introduces. In the ductal case, growth in the vertical direction is significantly inhibited by the pressure of a stiff duct. Instead, growth along the duct is preferred. Indeed, the stiffer the duct, the more elongated and larger the tumor becomes, and the duct is less deformed. In the duct geometry, feedback similarly inhibits growth (Figures 8 and 9), although the tumors with feedback continue to grow and are still subject to instability (Figure 9). The pressure is lower than in the encapsulated case, so the feedback is less restrictive. As observed earlier, the feedback mainly reduces the rate of growth at early times while the rates of growth at late times are primarily insensitive to feedback. In contrast to the case of encapsulated tumor growth, here the shape factors and volumes are increasing functions of the membrane stiffness (Figure 9).
Figure 8.
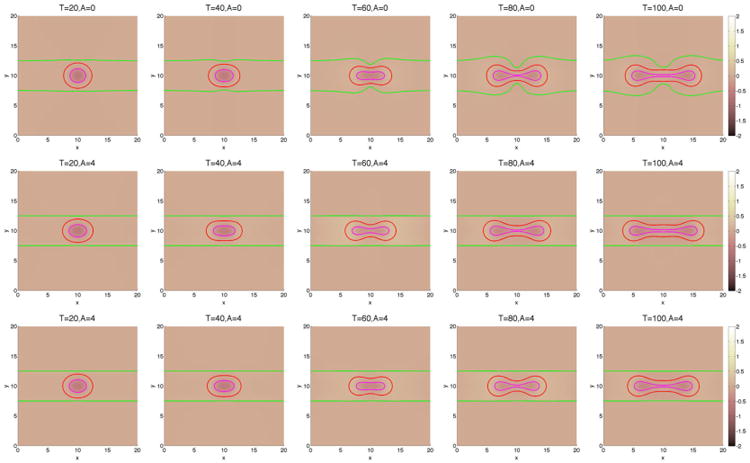
The pressure contours together with the membrane ϕ̃ = 0.5 surface (green), and the tumor ϕT = 0.5 surface (red) with large cell–cell adhesion γ = 0.2. The dead cells are located primarily within the magenta curve (ϕD = 0.5). Top and middle: without feedback; bottom: with feedback.
Figure 9.
The shape factors and volumes of the tumors shown in Figure 8.
3.3. 3D simulations with feedback from mechanical forces
We next investigate how the mechanical forces affect tumor growth in 3D configurations where the initial tumor shape (ϕT =0.5 isosurface) is given by
In the capsule geometry, the membrane is a sphere with center (10, 10, 10) and Rm = 4. In the duct geometry, the membrane is a cylinder with radius 2.8. The domain is Ω = (0, 20)3, the model parameters are given in Table III, the root-level grid is 323, and three levels of refinement are used. The time step size s = 0.005.
Table III.
Nondimensional parameters in the 3D numerical simulations.
| ε | 0.1 | ε̃ | 0.1 | ||
| M | 8.0 | M̃ | 20.0 | ||
| γ | 0.2 | A | 4.0 | ||
|
|
0.5 |
|
0.0 | ||
| nc | 1.0 | λM | 1.0 | ||
| λA | 0.0 | λN | 3.0 | ||
| λL | 1.0 |
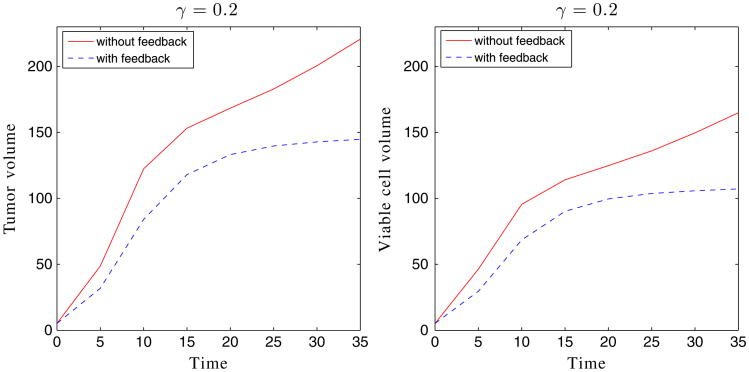
We first consider tumor growth in the capsule geometries. Taking A = 4 and γ = 0.2, the result is shown in Figures 10 and 11. The case with feedback is also shown in Figures 10 and 11. As expected, feedback inhibits the growth of the tumor, although the tumor with feedback continues to grow slowly. We observe that the tumors are more unstable than in two dimensions because there is more space for the tumor to grow in this 3D configuration (e.g., ratio of initial membrane and tumor radii is approximately 4 in three dimensions and 2 in two dimensions). This instability is what enables the tumor with feedback to continue to grow. Interestingly, Figure 12 shows the primary growth suppression due to feedback at early times, while at late times, the two tumors grow at similar rates. In the duct geometry, the case without feedback (χM = χA = 0) is also plotted in Figures 13 and 14. We observe that growth in the vertical direction is significantly inhibited by the pressure of a stiff duct, and feedback similarly inhibits growth (Figure 15), although in the duct case the tumor seems to evolve to a steady state.
Figure 10.
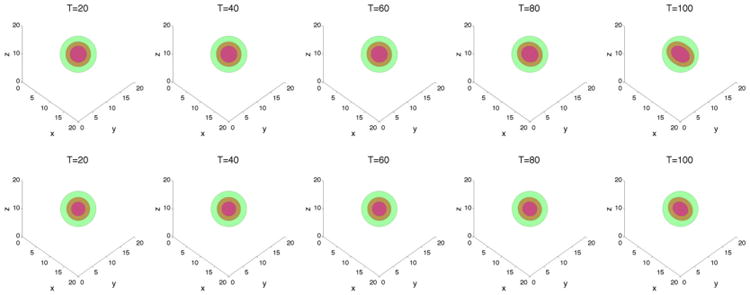
The membrane ϕ̃ = 0.5 surface (green) and the tumor ϕT = 0.5 surface (red) with large cell–cell adhesion γ = 0.2 and A = 4. The dead cells are located primarily within the magenta curve (ϕD = 0.5).Top: without feedback; bottom: with feedback.
Figure 11.
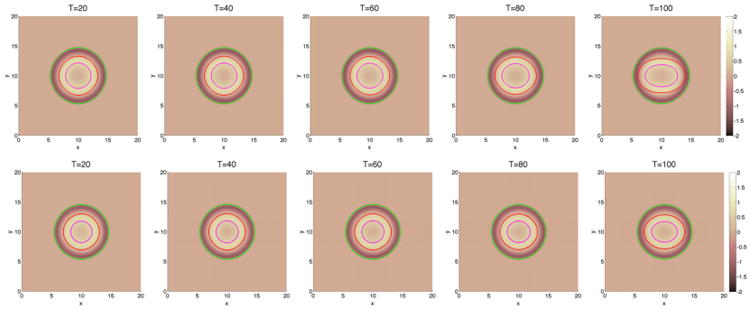
2D slices of the membrane ϕ̃ = 0.5 surface (green), the tumor ϕT = 0.5 surface (red), and dead cells (magenta) along z = 10 for the cases presented in Figure 10. Top: without feedback; bottom:with feedback.
Figure 12.
The volumes of the tumor and viable cells for the simulation shown in Figure 10.
Figure 13.
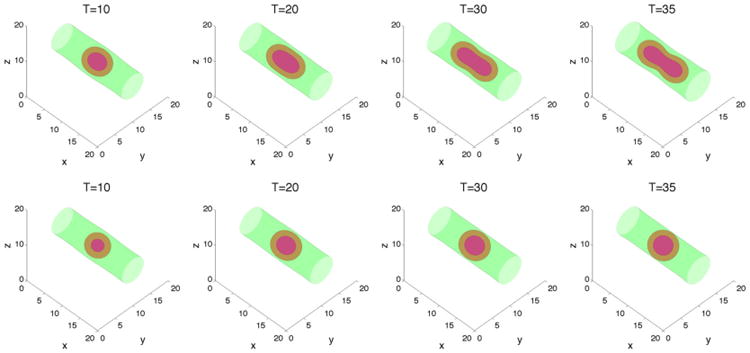
The membrane ϕ̃ = 0.5 surface (green), and the tumor ϕT = 0.5 surface (red) with large cell–cell adhesion γ = 0.2 and A = 4. The dead cells are located primarily within the magenta curve (ϕD = 0.5).Top: without feedback; bottom: with feedback.
Figure 14.
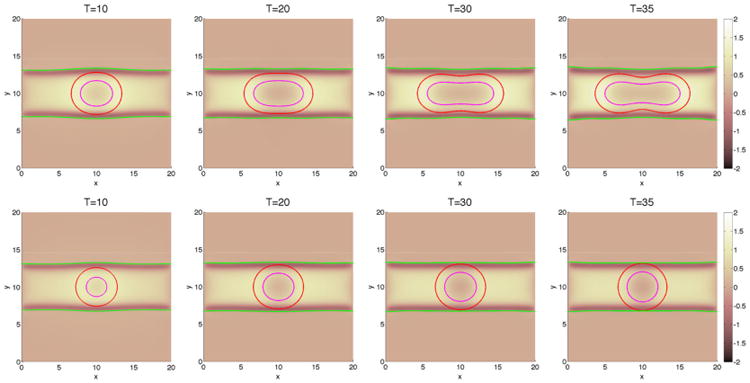
2D slices of the membrane ϕ̃ = 0.5 surface (green), and the tumor ϕT = 0.5 surface (red) and dead cells (magenta) along z = 10 for the cases presented in Figure 13. Top: without feedback; bottom:with feedback.
Figure 15.
The volumes of tumor and viable cells for the simulation shown in Figure 13.
4. Summary and Future Work
In this paper, we developed a simplified model, and associated efficient adaptive numerical methods, for tumors in the presence of a stiff membrane to model tumor growth in a confined microenvironment. We considered cases in which the membrane had a surface energy or a simplified elastic energy. In the surface energy case, the model is variational. In the elastic energy case, the model is nonvariational because certain coupling terms are neglected. To solve the equations efficiently, we developed a stable numerical method based on an implicit and spatially adaptive finite difference approximation of the governing system of equations. In the surface energy case, the numerical method was shown to be energy stable. In the elastic energy case, the method was shown to be very stable. Compared with the standard Crank–Nicholson method, the time step could be up to 25 times larger using the method developed here. Simulations were performed in two and three dimensions that demonstrated the accuracy of the algorithm and the influence of the membrane stiffness on tumor growth. The membrane compressed the evolving tumor, could suppress instability, and could lead to growth anisotropy. In a ductal geometry, this could actually lead to more rapid growth. We also found that negative feedback from mechanical (solid) pressure that reduces mitosis rates and increases apoptosis rates generally made tumors smaller and less deformed.
The future challenges include extending the current approach to more realistically model confinement by a membrane, both mechanically and geometrically, and comparing the results with experiments. Accordingly, we have recently developed a modeling approach following the diffuse domain method [70], combined with the mechanical model and energy stable numerical methods developed here, to provide a more realistic model of confined tumor growth. This will be described in a forthcoming paper as will comparisons with experiments.
Acknowledgments
JL acknowledges funding from the National Science Foundation-Division of Mathematical Sciences (NSF-DMS) and the National Institutes of Health through grants NIH P50GM76516 for a Center of Excellence in Systems Biology at the University of California, Irvine, and P30CA062203 for the Chao Comprehensive Cancer Center at the University of California, Irvine. VBS acknowledges support from the NSF (CMMI-1129172). SMW acknowledges the generous support of the National Science Foundation through the grant DMS 1115390. The authors also thank Hermann Frieboes for many useful discussions.
Appendix A: Nonlinear Multigrid Method
We write the discrete nonlinear system (58)–(63) as N = F, where the 7 × Nx × Ny nonlinear operator N = (N(1), N(2), N(3), N(4), N(5), N(6), N(7)) is defined as
| (A.1) |
| (A.2) |
| (A.3) |
| (A.4) |
| (A.5) |
| (A.6) |
| (A.7) |
The 7 × Nx × Ny source F = F(1), F(2), F(3), F(4), F(5), F(6), F(7)) is defined as
| (A.8) |
| (A.9) |
| (A.10) |
| (A.11) |
| (A.12) |
| (A.13) |
| (A.14) |
V-cycle algorithm
Suppose that a unique solution Ψk+1 exists for the equation N = F. We are now to construct a sequence that converges to the solution as m → ∞. To construct this sequence, we redefine the operator and source terms as
and
To obtain the next iterate Ψk+1,m+1 from the previous iterate Ψk+1,m, we solve the equation
| (A.15) |
Here, we use a single FAS multigrid V-cycle iteration with Ψk+1,m as the initial guess to obtain an approximate solution of Eq. (A.15)[68].
Nonlinear smoothing
In this appendix, we describe the smoothing using the simpler lexicographic ordering. Let l be the index for the lexicographic Gauss–Seidel. We introduce the following center-to-edge averages:
and
The smoothing procedure is as follows: for every (i, j), stepping lexicographically from (1, 1) to (Nx, Ny), find and that solve
| (A.16) |
| (A.17) |
| (A.18) |
| (A.19) |
| (A.20) |
| (A.21) |
| (A.22) |
| (A.23) |
Note that a local Newton linearization is used to handle the nonlinear terms at the implicit time level. The terms in F that are evaluated at the (k + 1) time level are lagged in the V-cycle iteration. Because Eqs. (A.16)–(A.22) are coupled, we use Cramer's rule to solve for the solutions. The nutrient equation (A.23) is decoupled from the others, and we solve it by simple division.
Appendix B: 2D Simulations of the Tumor Growth Model with the Membrane Surface Energy
In this section, we present 2D simulations of tumor growth for the surface energy model. We use the same initial tumor and membrane (only capsule geometry) as for the simulations of the elastic energy model. All parameters are the same as in the model with elastic energy except that the membrane surface energy γ̃ = 0,1,2. The results, which are presented in Figures B.1 and B.2, demonstrate that the evolution is qualitatively similar to that when the elastic energy is used.
Figure B.1.
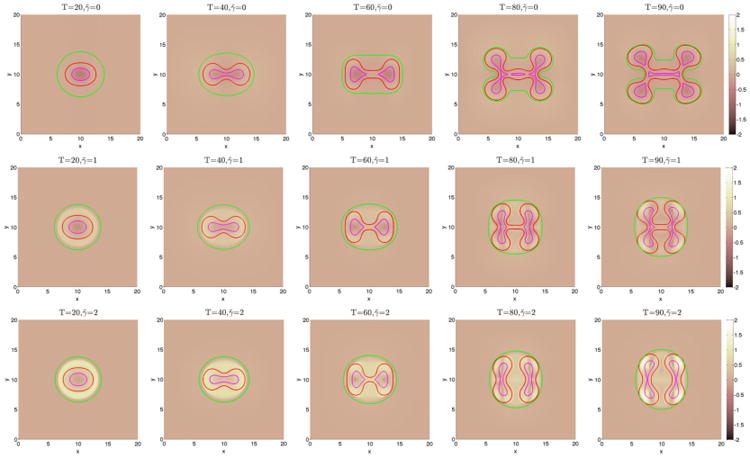
The pressure contours together with the membrane ϕ̃ = 0.5 surface (green), and the tumor ϕT = 0.5 surface (red) with small cell–cell adhesion γ = 0. The dead cells are located primarily within the magenta curve (ϕD = 0.5).
Figure B.2.
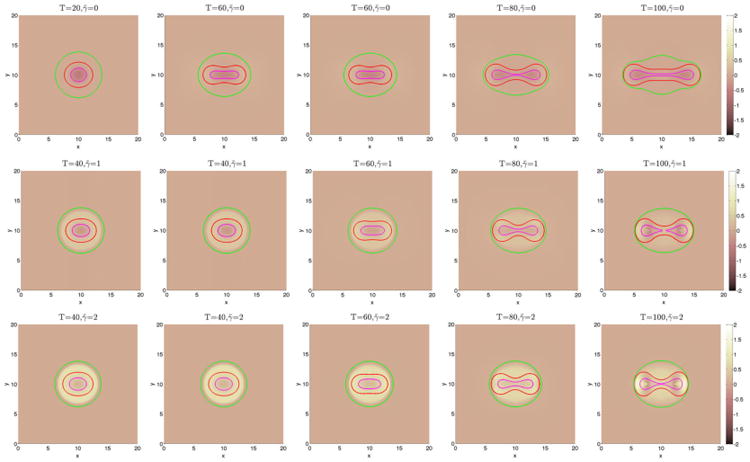
The pressure contours together with the membrane ϕ̃ = 0.5 surface (green), and the tumor ϕT = 0.5 surface (red) with small cell–cell adhesion γ = 0.2. The dead cells are located primarily within the magenta curve (ϕD = 0.5).
References
- 1.Alberts B, Johnson A, Lewis J, Raff M, Roberts K, Walter P. Molecular Biology of the Cell. 4th. Garland Science; New York: 2002. [Google Scholar]
- 2.Anderson ARA, Quaranta V. Integrative mathematical oncology. Nature Reviews Cancer. 2008;8:227–244. doi: 10.1038/nrc2329. [DOI] [PubMed] [Google Scholar]
- 3.Bellomo N, Li NK, Maini PK. On the foundations of cancer modeling: selected topics, speculations, and perspective. Mathematical Models and Methods in Applied Sciences. 2008;4:593–646. [Google Scholar]
- 4.Byrne H, Alarcón T, Owen M, Webb S, Maini P. Modeling aspects of cancer dynamics: a review. Philosophical Transactions of the Royal Society A. 2006;364:1563–1578. doi: 10.1098/rsta.2006.1786. [DOI] [PubMed] [Google Scholar]
- 5.Cristini V, Frieboes H, Li X, Lowengrub J, Macklin P, Sanga S, Wise S, Zheng X. Nonlinear modeling and simulation of tumor growth. In: Bellomo N, Chaplain M, De Angelis E, editors. Selected topics in Cancer Modeling: Genesis, Evolution, Immune Competition, and Therapy, in: Modeling and Simulation in Science, Engineering and Technology. Birkhäuser; Boston: 2008. [Google Scholar]
- 6.Cristini V, Lowengrub JS. Multiscale Modeling Of Cancer: An Integrated Experimental and Mathematical Modeling Approach. Cambridge University Press; Cambridge, UK: 2010. [Google Scholar]
- 7.Deisboeck TS, Zhang X, Yoon J, Costa J. In silico cancer modeling: is it ready for prime time. Nature Clinical Practice Oncology. 2009;6:34–42. doi: 10.1038/ncponc1237. [DOI] [PMC free article] [PubMed] [Google Scholar]
- 8.Drasdo D, Höhme S. On the role of physics in the growth and pattern formation of multicellular systems: what we learn from individual-cell based models. Journal of Statistical Physics. 2007;128:287–345. [Google Scholar]
- 9.Fasano A, Bertuzzi A, Gandolfi A. Complex system in Biomedicine. Springer; Milan: 2006. Mathematical modeling of tumour growth and treatment; pp. 71–108. [Google Scholar]
- 10.Friedman A, Bellomo N, Maini PK. Mathematical analysis and challenges arising from models of tumor growth. Mathematical Models and Methods in Applied Sciences. 2007;17:1751–1772. [Google Scholar]
- 11.Graziano L, Preziosi L. Mechanics in tumor growth. In: Mollica F, Preziosi L, Rajagopal KR, editors. Modeling of Biological Materials (Modeling and Simulation in Science, Engineering and Technology) Birkhäuser; Boston: 2007. pp. 263–321. [Google Scholar]
- 12.Harpold HLP, Alvord EC, Swanson KR. The evolution of mathematical modeling of glioma proliferation and invasion. Journal of Neuropathology & Experimental Neurology. 2007;66:1–9. doi: 10.1097/nen.0b013e31802d9000. [DOI] [PubMed] [Google Scholar]
- 13.Hatzikirou H, Deutsch A, Schaller C, Simon M, Swanson K. Mathematical modeling of glioblastoma tumour development: a review. Mathematical Models and Methods in Applied Sciences. 2005;15:1779–1794. [Google Scholar]
- 14.Lowengrub J, Frieboes H, Jin F, Chuang YL, Li X, Macklin P, Wise S, Cristini V. Nonlinear modeling of cancer: bridging the gap between cells and tumors. Nonlinearity. 2010;23:R1–R91. doi: 10.1088/0951-7715/23/1/r01. [DOI] [PMC free article] [PubMed] [Google Scholar]
- 15.Wise S, Lowengrub J, Cristini C. An adaptive multigrid algorithm for simulating solid tumor growth using mixture models. Mathematical and Computer Modelling. 2011;53:1–20. doi: 10.1016/j.mcm.2010.07.007. [DOI] [PMC free article] [PubMed] [Google Scholar]
- 16.Nagy JD. The ecology and evolutionary biology of cancer: a review of mathematical models of necrosis and tumor cell diversity. Mathematical Biosciences and Engineering. 2005;2:381–418. doi: 10.3934/mbe.2005.2.381. [DOI] [PubMed] [Google Scholar]
- 17.Quaranta V, Weaver AM, Cummings PT, Anderson ARA. Mathematical modeling of cancer: the future of prognosis and treatment. Clinica Chimica Acta. 2005;357(2):173–179. doi: 10.1016/j.cccn.2005.03.023. [DOI] [PubMed] [Google Scholar]
- 18.Ribba B, Alarcón K, Maini PK, Agur Z. The use of hybrid cellular automaton models for improving cancer therapy. In: Chopard B, Sloot PMA, Hoekstra AG, editors. Cellular Automata, in: Lecture Notes in Computer Science. Springer; Berlin: 2004. pp. 444–453. [Google Scholar]
- 19.Roose T, Chapman SJ, Maini PK. Mathematical models of avascular tumor growth. SIAM Review. 2007;49:179–208. [Google Scholar]
- 20.Sanga S, Frieboes HB, Zheng X, Gatenby R, Bearer EL, Cristini V. Predictive oncology: a review of multidisciplinary, multiscale in silico modeling linking phenotype, morphology and growth. Neurolmage. 2007;37:S120–S134. doi: 10.1016/j.neuroimage.2007.05.043. [DOI] [PMC free article] [PubMed] [Google Scholar]
- 21.van Leeuwen IMM, Edwards CM, Ilyas M, Byrne HM. Towards a multiscale model of colorectal cancer. World Journal of Gastroenterology. 2007;13:1399–1407. doi: 10.3748/wjg.v13.i9.1399. [DOI] [PMC free article] [PubMed] [Google Scholar]
- 22.Friedl P, Wolf A. Tumor cell invasion and migration: diversity and escape mechanisms. Nature Reviews Cancer. 2003;3:362–374. doi: 10.1038/nrc1075. [DOI] [PubMed] [Google Scholar]
- 23.Cristini V, Lowengrub J, Nie Q. Nonlinear simulation of tumor growth. Journal of Mathematical Biology. 2003;46:191–224. doi: 10.1007/s00285-002-0174-6. [DOI] [PubMed] [Google Scholar]
- 24.Li X, Cristini V, Nie Q, Lowengrub JS. Nonlinear three-dimensional simulation of solid tumor growth. Discrete and Continuous Dynamical Systems-Series B. 2007;7(3):581–604. [Google Scholar]
- 25.Macklin P, McDougall S, Anderson ARA, Chaplain MAJ, Cristini V, Lowengrub J. Multiscale modeling and nonlinear simulations of vascular tumour growth. Journal of Mathematical Biology. 2009;58:765–798. doi: 10.1007/s00285-008-0216-9. [DOI] [PMC free article] [PubMed] [Google Scholar]
- 26.Zheng X, Wise S, Cristini V. Nonlinear simulation of tumor necrosis, neovascularization and tissue invasion via an adaptive finite-element/level-set method. Bulletin of Mathematical Biology. 2005;67:211–259. doi: 10.1016/j.bulm.2004.08.001. [DOI] [PubMed] [Google Scholar]
- 27.Macklin P, Lowengrub J. Nonlinear simulation of the effect of microenvironment on tumor growth. Journal of Theoretical Biology. 2007;245:677–704. doi: 10.1016/j.jtbi.2006.12.004. [DOI] [PubMed] [Google Scholar]
- 28.Ambrosi D, Preziosi L. On the closure of mass balance models for tumor growth. Mathematical Models and Methods in Applied Sciences. 2002;12:737–754. [Google Scholar]
- 29.Ambrosi D, Preziosi L. Cell adhesion mechanisms and stress relaxation in the mechanics of tumours. Biomechanics and Modeling in Mechanobiology. 2009;8:397–413. doi: 10.1007/s10237-008-0145-y. [DOI] [PubMed] [Google Scholar]
- 30.Araujo R, McElwain D. A mixture theory for the genesis of residual stresses in growing tissues I: a general formulation. SIAM Journal on Applied Mathematics. 2005;65:1261–1284. [Google Scholar]
- 31.Araujo R, McElwain D. A mixture theory for the genesis of residual stresses in growing tissues II: solutions to the biphasic equations for a multicell spheroid. SIAM Journal on Applied Mathematics. 2005;66:447–467. [Google Scholar]
- 32.Breward C, Byrne H, Lewis C. The role of cell-cell interaction in a two-phase model for avascular tumour growth. Journal of Mathematical Biology. 2002;45:125–152. doi: 10.1007/s002850200149. [DOI] [PubMed] [Google Scholar]
- 33.Breward C, Byrne H, Lewis C. A multiphase model describing vascular tumor growth. Bulletin of Mathematical Biology. 2003;65:609–640. doi: 10.1016/S0092-8240(03)00027-2. [DOI] [PubMed] [Google Scholar]
- 34.Byrne H, King J, McElwain D, Preziosi L. A two-phase model of solid tumour growth. Applied Mathematics Letters. 2003;16:567–573. [Google Scholar]
- 35.Byrne H, Preziosi L. Modelling solid tumour growth using the theory of mixtures. Mathematical Medicine and Biology. 2003;20:341–366. doi: 10.1093/imammb/20.4.341. [DOI] [PubMed] [Google Scholar]
- 36.Chaplain M, Graziano L, Presiosi L. Mathematical modelling of the loss of tissue compression responsiveness and its role in solid tumor development. Mathematical Medicine and Biology. 2006;23:197–229. doi: 10.1093/imammb/dql009. [DOI] [PubMed] [Google Scholar]
- 37.Franks S, Byrne H, King J, Underwood J, Lewis C. Modeling the early growth of ductal carcinoma in situ of the breast. Journal of Mathematical Biology. 2003;47:424–452. doi: 10.1007/s00285-003-0214-x. [DOI] [PubMed] [Google Scholar]
- 38.Franks S, Byrne H, Mudhar H, Underwood J, Lewis C. Mathematical modeling of comedo ductal carcinoma in situ of the breast. Mathematical medicine and Biology. 2003;20:277–308. doi: 10.1093/imammb/20.3.277. [DOI] [PubMed] [Google Scholar]
- 39.Frieboes HB, Jin F, Chuang YL, Wise SM, Lowengrub JS, Cristini V. Three-dimensional multispecies nonlinear tumor growth-II: tumor invasion and angiogenesis. Journal of Theoretical Biology. 2010;264:1254–1278. doi: 10.1016/j.jtbi.2010.02.036. [DOI] [PMC free article] [PubMed] [Google Scholar]
- 40.Please C, Pettet G, McElwain D. A new approach to modeling the formation of necrotic regions in tumors. Applied Mathematics Letters. 1998;11:89–94. [Google Scholar]
- 41.Please C, Pettet G, McElwain D. Avascular tumour dynamics and necrosis. Mathematical Models in the Applied Sciences. 1999;9:596–579. [Google Scholar]
- 42.Preziosi L, Tosin A. Multiphase and multiscale trends in cancer modelling. Mathematical Modelling of Natural Phenomena. 2009;4:1–11. [Google Scholar]
- 43.Preziosi L, Tosin A. Multiphase modelling of tumour growth and extracellular matrix interaction: mathematical tools and applications. Journal of Mathematical Biology. 2009;58:625–656. doi: 10.1007/s00285-008-0218-7. [DOI] [PubMed] [Google Scholar]
- 44.Wise S, Lowengrub J, Frieboes H, Cristini V. Three-dimensional multispecies nonlinear tumor growth–I: model and numerical method. Journal of Theoretical Biology. 2008;253:524–543. doi: 10.1016/j.jtbi.2008.03.027. [DOI] [PMC free article] [PubMed] [Google Scholar]
- 45.Tosin A. Multiphase modeling and qualitative analysis of the growth of tumor cords. Networks and heterogeneous Media. 2008;3:43–84. [Google Scholar]
- 46.Tracqui P. Biophysical models of tumor growth. Reports on Progress in Physics. 2009;72:056701. doi: 10.1088/0034-4885/72/5/056701. [DOI] [Google Scholar]
- 47.Ward J, King J. Mathematical modelling of avascular tumor growth. IMA Journal of Mathematics Applied in Medicine and Biology. 1997;14:36–69. [PubMed] [Google Scholar]
- 48.Ward J, King J. Mathematical modelling of avascular tumor growth II: modelling growth saturation. Mathematical Medicine and Biology. 1999;16:171–211. [PubMed] [Google Scholar]
- 49.Sciumè G, Shelton S, Gray WG, Miller CT, Hussain F, Ferrari M, Decuzzi P, Schrefler BA. A multiphase model for three-dimensional tumor growth. New Journal of Physics. 2013;15:015005. doi: 10.1088/1367-2630/15/1/015005. [DOI] [PMC free article] [PubMed] [Google Scholar]
- 50.Bresch D, Colin T, Grenier E, Ribba B, Saut O. Computational modeling of solid tumor growth: the avascular stage. SIAM Journal on Scientific Computing. 2010;32(4):2321–2344. [Google Scholar]
- 51.Cottet GH, Maitre E. A level-set formulation of immersed boundary methods for fluid-structure interaction problems. Comptes Rendus Mathematique. 2004;338:581–586. [Google Scholar]
- 52.Eyre D. Unconditionally gradient stable time marching the Cahn-Hilliard equation. In: Bullard JW, Kalia R, Stoneham M, Chen L, editors. Computational and mathematical models of microstructural evolution. Vol. 53. Materials Research Society; Warrendale: 1998. pp. 1686–1712. [Google Scholar]
- 53.Wise S. Unconditionally stable finite difference, nonlinear multigrid simulation of the Cahn-Hilliard-Hele-Shaw system of equations. Journal of Scientific Computing. 2010;44:38–68. [Google Scholar]
- 54.Hu Z, Wise S, Wang C, Lowengrub J. Stable and efficient finite-difference nonlinear-multigrid schemes for the phase-field crystal equation. Journal of Computational Physics. 2009;228:5323–5339. [Google Scholar]
- 55.Baskaran A, Zhou P, Hu Z, Wang C, Wise SM, Lowengrub J. Energy stable and efficient finite-difference nonlinear multigrid schemes for the modified phase field crystal equation. Journal of Computational Physics. 2013;250:270–292. [Google Scholar]
- 56.Baskaran A, Lowengrub J, Wang C, Wise SM. Convergence analysis of a second order convex splitting scheme for the modified phase field crystal equation. SIAM Journal on Numerical Analysis. 2013;51:2851–2873. [Google Scholar]
- 57.Xu C, Tang T. Stability analysis of large time-stepping methods for epitaxial growth models. SIAM Journal on Numerical Analysis. 2006;44:1759–1779. [Google Scholar]
- 58.Shen J, Wang C, Wang X, Wise SM. Second-order convex splitting schemes for gradient flows with Ehrlich-Schwoebel-type energy: application to thin film epitaxy. SIAM Journal on Numerical Analysis. 2012;50:205–125. [Google Scholar]
- 59.Bearer EL, Lowengrub JS, Frieboes HB, Chuang YL, Wise SM, Ferrari M, Agus DB, Cristini V. Multiparameter computational modeling of tumor invasion. Cancer Research. 2009;69:4493–4501. doi: 10.1158/0008-5472.CAN-08-3834. [DOI] [PMC free article] [PubMed] [Google Scholar]
- 60.Chen Y. PhD Thesis. University of California; Irvine: 2012. Mathematical modeling of solid tumor growth in complex, dynamic geometries. [Google Scholar]
- 61.Li X, Cristini V, Nie Q, Lowengrub JS. Nonlinear three-dimensional simulation of solid tumor growth. Discrete and Continuous Dynamical Systems B. 2007;7:581–604. [Google Scholar]
- 62.Greenspan HP. On the growth and stability of cell cultures and solid tumors. Journal of Theoretical Biology. 1976;56:229–242. doi: 10.1016/s0022-5193(76)80054-9. [DOI] [PubMed] [Google Scholar]
- 63.Frieboes HB, Zheng X, Sun CH, Tromberg B, Gatenby R, Cristini V. An integrated computational/experimental model of tumor invasion. Cancer Research. 2006;66:1597–1604. doi: 10.1158/0008-5472.CAN-05-3166. [DOI] [PubMed] [Google Scholar]
- 64.Pham K, Frieboes HB, Cristini V, Lowengrub J. Predictions of tumor morphological stability and evaluation against experimental observations. Journal of the Royal Society Interface. 2010;8:16–29. doi: 10.1098/rsif.2010.0194. [DOI] [PMC free article] [PubMed] [Google Scholar]
- 65.Cheng G, Tse J, Jain RK, Munn LL. Microenvironmental mechanical stress controls tumor size and morphology by suppressing proliferation and inducing apoptosis in cancer cells. PLOS One. 2009;4(2):e4632. doi: 10.1371/journal.pone.0004632. [DOI] [PMC free article] [PubMed] [Google Scholar]
- 66.Wang C, Wang X, Wise S. Unconditionally stable schemes for equations of thin film epitaxy. Discrete and Continuous Dynamical Systems-Series A. 2010;28:405–423. [Google Scholar]
- 67.Wang C, Wise S. An energy stable and convergent finite-difference scheme for the modified phase field crystal equation. SIAM Journal on Numerical Analysis. 2011;49:945–969. [Google Scholar]
- 68.Wise S, Wang C, Lowengrub J. An energy stable and convergent finite-difference scheme for the phase field crystal equation. SIAM Journal on Numerical Analysis. 2009;47:2269–2288. [Google Scholar]
- 69.Trottenberg U, Oosterlee C, Schüller A. Multigrid. Academic Press; New York: 2001. [Google Scholar]
- 70.Li X, Lowengrub J, Räez A, Voigt A. Solving PDEs in complex geometries: a diffusion domain approach. Communications in Mathematical Sciences. 2009;7:81–107. doi: 10.4310/cms.2009.v7.n1.a4. [DOI] [PMC free article] [PubMed] [Google Scholar]
- 71.Araujo R, McElwain D. A history of the study of solid tumor growth: the contribution of mathematical modeling. Bulletin of Mathematical Biology. 2004;66:1039–1091. doi: 10.1016/j.bulm.2003.11.002. [DOI] [PubMed] [Google Scholar]
- 72.Cristini V, Frieboes HB, Gatenby R, Caserta S, Ferrari M, Sinek J. Morphological instability and cancer invasion. Clinical Cancer Research. 2005;11(19):6772–6779. doi: 10.1158/1078-0432.CCR-05-0852. [DOI] [PubMed] [Google Scholar]
- 73.Hogea CS, Murray BT, Sethian JA. Simulating complex tumor dynamics from avascular to vascular growth using a general level-set method. Journal of Mathematical Biology. 2006;53(1):86–134. doi: 10.1007/s00285-006-0378-2. [DOI] [PubMed] [Google Scholar]
- 74.Macklin P, Lowengrub J. A new ghost cell/level set method for moving boundary problems: application to tumor growth. Journal of Scientific Computing. 2008;35(2-3):266–299. doi: 10.1007/s10915-008-9190-z. [DOI] [PMC free article] [PubMed] [Google Scholar]
- 75.Wise S, Kim JS, Lowengrub J. Solving the regularized, strongly anisotropic Cahn-Hilliard equation by an adaptive nonlinear multigrid method. Journal of Computational Physics. 2007;226:414–446. [Google Scholar]


