Abstract
Mathematical models of human weight dynamics have been validated in research settings, but are they applicable in the real world of clinical obesity treatment? We compared model calculations to weight loss data from 49 patients in a medically-supervised, outpatient weight loss program. A range of expected weight losses was defined for each patient based on uncertainties in their baseline energy requirements and physical activity changes. Assuming that energy intake was within the prescribed range, the observed and model-calculated weight losses were highly correlated (r=0.9, p<0.0001) and the mean calculated loss of 14.0±9.1 kg (mean±SD) achieved over 13.2±9.4 weeks was not significantly different from the data (13.2±8.9 kg; p=0.14). However, the model identified 14 patients whose weight losses were less than expected, suggesting the possibility of non-compliance. Therefore, mathematical models can be clinically useful tools for prospective goal-setting and assessment of compliance, both of which are important considerations for treating obesity.
Introduction
Weight loss occurs when there is a deficit of energy intake compared to expenditure, and both components of this energy balance equation can dynamically change over time (1). For decades, the static 3500 kcal per pound rule was the standard method for calculating weight loss predictions. However, mathematical models of human body weight dynamics have demonstrated that the assumptions underlying the 3500 kcal per pound rule are flawed and its predictions are inaccurate (2, 3).
Widespread interest in obtaining accurate weight loss predictions is evidenced by the fact that a web-based mathematical model (http://bwsimulator.niddk.nih.gov) has had over a million unique users in the past few years and is typically used >500 times per day (3). While this model has been validated in a research setting, here we investigate its applicability in the real world of clinical obesity treatment.
Methods
We compared model-predicted weight losses (3) to data from obese patients participating in a medically-supervised, outpatient weight loss program. The program prescribed three high-protein meal replacements daily and patients were instructed by a dietitian to add a pair of 2-cup servings of vegetables along with 4–8 ounces of lean meat, poultry, fish, or soy/tempeh with dinner. Other food, caloric beverages, and alcohol were prohibited. Adherent patients consumed a diet ranging from 900–1100 kcal/day composed of roughly 50% protein, 30% fat and 20% carbohydrate.
Noncompliant patients were identified from clinical records as those reporting more than two “cheats” per week, inaccurate diet tracking, left-over meal replacements, or reports of non-adherence for any reason. We used data from 49 patients thought to be compliant for a minimum of 4 weeks whose weight losses were tracked weekly in a secure database. We included all patients regardless of co-morbid conditions or medication usage.
The model (3) used initial height, weight, age, sex and estimated activity level to calculate baseline energy requirements. For simplicity, we assumed that there were no changes in deliberate physical activity, although the energy cost of physical activity was proportional to body weight and therefore decreased as weight was lost. Since these patients were generally very sedentary, we assumed a physical activity level (PAL) of 1.4. Individual model-predicted weight losses were then compared to actual follow-up weights.
Given the substantial uncertainty about each individual’s baseline energy requirements and physical activity, we simulated a range of weight losses for each individual corresponding to an initial +20% or −10% difference in baseline energy requirements along with a possible +20% or −10% change in physical activity during the intervention. The Institutional Review Board of Mercy Medical Center & St. Luke’s Hospital approved this study as exempt research.
Results
At the start of the intervention, our patients had a mean age of 50±12 years and a mean body mass index of 37.4 ± 8.5 kg/m2 (mean ± SD). The model predicted that their baseline body fat was 46.6 ± 8.7 %, resting metabolic rate was 1680 ± 290 kcal/d, and the baseline energy requirement for weight maintenance was 2350 ± 400 kcal/d.
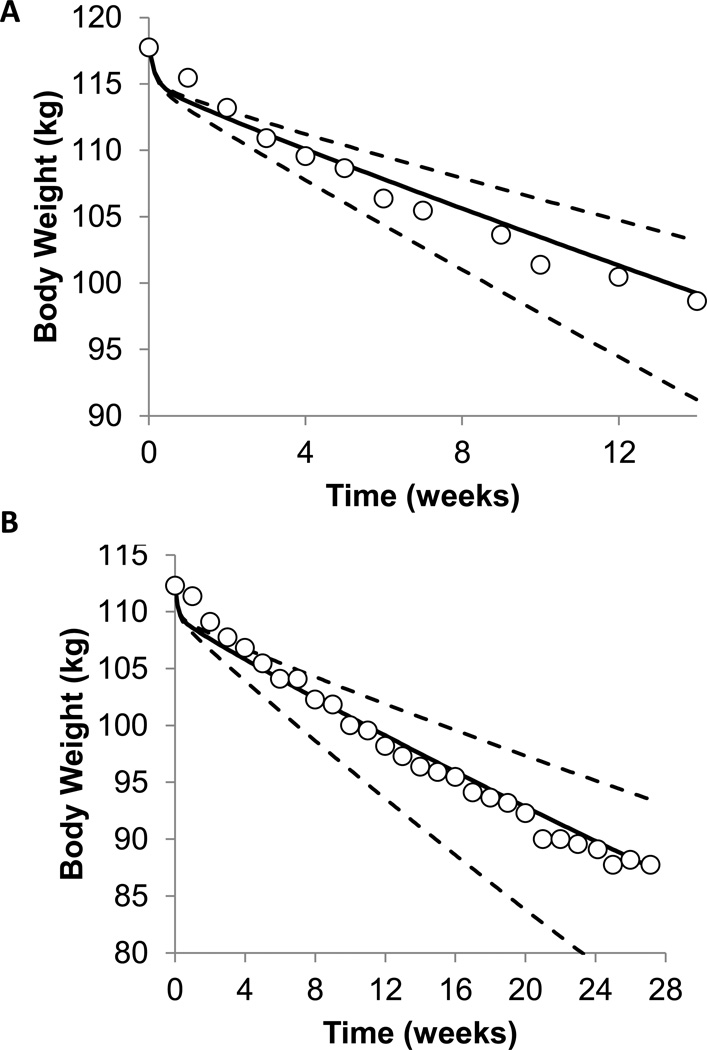
Figures 1A and 1B show weekly body weight measurements in two example patients (open circles) along with model simulations (solid curve). The dashed curves indicate the expected weight loss range assuming perfect adherence to the diet while accounting for the uncertainty in each individual’s baseline energy requirements and possible changes in physical activity.
Figure 1.
(A) Model calculations (curves) along with the observed body weight time course (○) in (A) a sedentary 59 year old male with BMI of 34 kg/m2 and (B) a sedentary 50 year old female with BMI of 40 kg/m2 who were both participating in a medically-supervised, outpatient weight loss program. The solid curves are the model’s best estimate and the dashed curves illustrate the uncertainty in the model predictions based on uncertainties in an individual’s baseline energy requirements and changes in physical activity during the intervention.
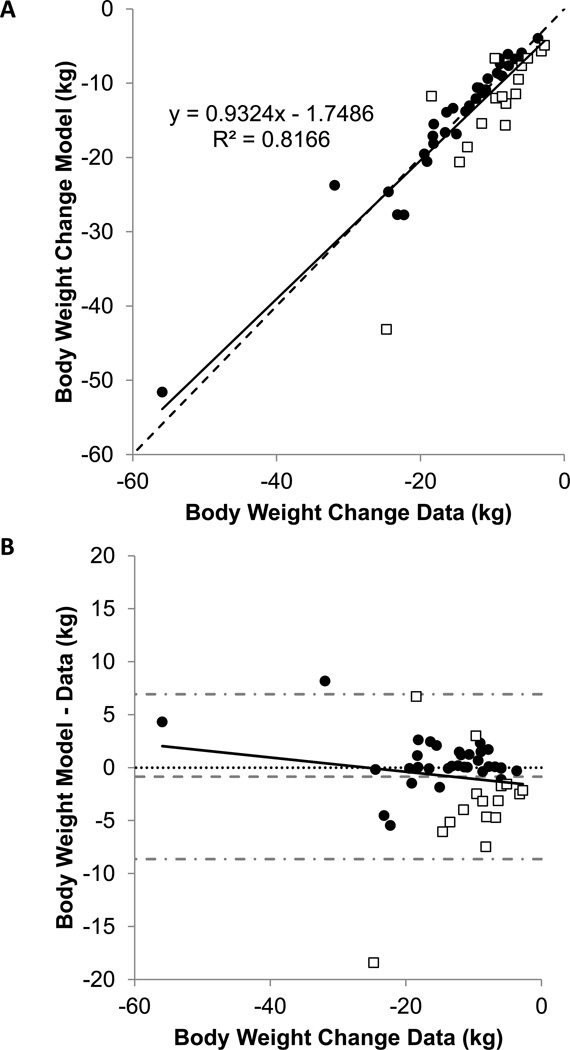
Figure 2A illustrates that the model predictions were highly correlated with the individual weight loss data at the latest clinic visit (r=0.9; p<0.0001), which occurred after 13.2 ± 9.4 weeks of the intervention. The mean 13.2 ± 8.9 kg weight loss observed in the patients was not significantly different from the model calculations (14.0 ± 9.1 kg; p=0.14). Figure 2B shows the deviations between the model calculations and the observed weight losses plotted against the data.
Figure 2.
(A) Model calculations versus observed weight losses in 35 patients whose weight loss was within the expected range (•) along with 16 patients whose weight loss was outside the expected range (□). The dotted line is the line of identity and the solid line is the best-fit linear regression. (B) Difference between model predicted and observed weight losses versus the observed weight losses in 35 patients whose weight loss was within the expected range (•) along with 16 patients whose weight loss was outside the expected range (□). The dotted horizontal line indicates perfect agreement and the solid line is the best-fit linear regression and indicating no significant trend (r=0.04, p=0.3). The horizontal dashed gray line indicates the mean residual and the dash-dotted gray lines indicate the 95% confidence interval.
Despite the overall agreement between the model and the data, we identified 16 patients whose weight losses were outside the expected range (open boxes in Fig. 2A and 2B). Only 2 of these patients had greater than expected weight loss, whereas 14 patients had less than expected weight loss.
Discussion
Overall, the model simulations were remarkably consistent with the weight losses observed in our sedentary, middle-aged patients regardless of co-morbid conditions or medication usage. However, the precision of the weight loss predictions for individual patients was fundamentally limited by the uncertainty of their baseline energy requirements (2, 3). For example, baseline energy requirements have an uncertainty of several hundred kcal/d (4). Therefore, an individual’s initial energy deficit achieved through a given diet is uncertain by at least this amount. Add to that the variability in physical activity during the intervention, and our model defines an expected range of weight loss for a compliant patient based on these fundamental uncertainties (2, 3).
Our dynamic energy balance model builds on previous statistical representations of expected weight loss that have been used to evaluate diet adherence (5, 6, 7). Recently, another dynamic energy balance model also presented a weight loss range for adherent individuals (8), but its underlying basis was not provided and it is unclear how it compares with the range defined by the previously described fundamental uncertainties (2, 3).
We identified 14 subjects whose weight losses were significantly less than expected. It is possible that, despite the assumed sedentary baseline physical activity level, these patients had significantly lower baseline energy requirements. Alternatively, these patients may have decreased their physical activity more than expected, or experienced a slowing of metabolic rate that was much greater than captured by our model. However, the possibility of non-adherence to the protocol is an extremely likely possibility.
Our results have important implications for clinicians treating obesity. The high correlation between model-calculated and actual weight loss suggests that mathematical modeling may be useful for prospective goal-setting as well as assessment of adherence to the intervention (3, 8, 9, 10). Comparing the model’s projected weight trajectory range with the patient’s actual weight loss could be used to promote discussion of barriers to adherence and thereby improve overall weight loss outcomes.
Acknowledgements
This research was supported by the Intramural Research Program of the NIH, National Institute of Diabetes & Digestive & Kidney Diseases (KDH). IB is supported by Mercy Medical Center. KDH reports a US patent application assigned to the National Institutes of Health related to the use of mathematical models for body weight management.
Footnotes
IB has no conflicts of interest.
References
- 1.Hall KD, Heymsfield SB, Kemnitz JW, Klein S, Schoeller DA, Speakman JR. Energy balance and its components: implications for body weight regulation. Am J Clin Nutr. 2012;95:989–994. doi: 10.3945/ajcn.112.036350. [DOI] [PMC free article] [PubMed] [Google Scholar]
- 2.Hall KD. Modeling metabolic adaptations and energy regulation in humans. Annu Rev Nutr. 2012;32:35–54. doi: 10.1146/annurev-nutr-071811-150705. [DOI] [PubMed] [Google Scholar]
- 3.Hall KD, Sacks G, Chandramohan D, Chow CC, Wang YC, Gortmaker SL, et al. Quantification of the effect of energy imbalance on bodyweight. Lancet. 2011;378:826–837. doi: 10.1016/S0140-6736(11)60812-X. [DOI] [PMC free article] [PubMed] [Google Scholar]
- 4.Dietary reference intakes for energy, carbohydrate, fiber, fat, fatty acids, cholesterol, protein, and amino acids. Washington DC: Institute of Medicine of the National Academies, The National Academies Press; 2002. [DOI] [PubMed] [Google Scholar]
- 5.Keys A. The biology of human starvation. Minneapolis: University of Minnesota Press; 1950. [Google Scholar]
- 6.Pieper C, Redman L, Racette S, Roberts S, Bhapkar M, Rochon J, et al. Development of adherence metrics for caloric restriction interventions. Clinical trials. 2011;8:155–164. doi: 10.1177/1740774511398369. [DOI] [PMC free article] [PubMed] [Google Scholar]
- 7.Rochon J, Bales CW, Ravussin E, Redman LM, Holloszy JO, Racette SB, et al. Design and conduct of the CALERIE study: comprehensive assessment of the long-term effects of reducing intake of energy. J Gerontol A Biol Sci Med Sci. 2011;66:97–108. doi: 10.1093/gerona/glq168. [DOI] [PMC free article] [PubMed] [Google Scholar]
- 8.Thomas DM. Modeling in clinical nutrition: does it add to patient care? Eur J Clin Nutr. 2013;67:555–557. doi: 10.1038/ejcn.2013.16. [DOI] [PubMed] [Google Scholar]
- 9.Chow CC, Hall KD. Short and long-term energy intake patterns and their implications for human body weight regulation. Physiol Behav. 2014 doi: 10.1016/j.physbeh.2014.02.044. [DOI] [PMC free article] [PubMed] [Google Scholar]
- 10.Hall KD. Personalized dynamic feedback control of body weight. 13/754,058, 2013. U.S. Patent Application. 2013


