

Supplemental Digital Content is Available in the Text.
Key Words: viral load, ART monitoring, cost, feasibility, second-line, adherence
Abstract
Objective:
To assess the programmatic quality (coverage of testing, counseling, and retesting), cost, and outcomes (viral suppression, treatment decisions) of routine viral load (VL) monitoring in Swaziland.
Design:
Retrospective cohort study of patients undergoing routine VL monitoring in Swaziland (October 1, 2012 to March 31, 2013).
Results:
Of 5563 patients eligible for routine VL testing monitoring in the period of study, an estimated 4767 patients (86%) underwent testing that year. Of 288 patients with detectable VL, 210 (73%) underwent enhanced adherence counseling and 202 (70%) had a follow-up VL within 6 months. Testing coverage was slightly lower in children, but coverage of retesting was similar between and age groups and sexes. Of those with a follow-up test, 126 (62%) showed viral suppression. The remaining 78 patients had World Health Organization–defined virologic failure; 41 (53%) were referred by the doctor for more adherence counseling, and 13 (15%) were changed to second-line therapy, equating to an estimated rate of 1.2 switches per 100 patient-years. Twenty-four patients (32%) were transferred out, lost to follow-up, or not reviewed by doctor. The “fully loaded” cost of VL monitoring was $35 per patient-year.
Conclusions:
Achieving good quality VL monitoring is feasible and affordable in resource-limited settings, although close supervision is needed to ensure good coverage of testing and counseling. The low rate of switch to second-line therapy in patients with World Health Organization–defined virologic failure seems to reflect clinician suspicion of ongoing adherence problems. In our study, the main impact of routine VL monitoring was reinforcing adherence rather than increasing use of second-line therapy.
INTRODUCTION
The 2013 World Health Organization (WHO) guidelines recommend routine viral load (VL) monitoring of all patients on antiretroviral therapy (ART) for more than 6 months, to enable earlier detection of treatment failure due to resistance mutations and to help clinicians distinguish this from adherence problems.1 Because an elevated VL after 6 months on ART can indicate either therapeutic failure due to drug resistance or poor adherence to treatment, the WHO recommends that such patients receive adherence support followed by retesting at 3–6 months, at which time a persistently elevated VL (>1000 copies/mL) should be considered as therapeutic failure requiring switch to second-line therapy.1 Although randomized controlled trials have so far failed to show survival benefits from VL monitoring, compared with immunological monitoring alone, programmatic research has shown that routine VL monitoring of patients on ART, with an adherence intervention for patients with detectable VL, is associated with improved treatment outcomes and earlier switches to second-line therapy.2–4
Routine VL monitoring is resource intensive, in terms of reagents and transport logistics. An efficient VL monitoring “cascade” with minimal delays between steps is essential for VL monitoring to enable early intervention (either counseling or switch to second-line therapy), to prevent further accumulation of mutations and disease progression associated with chronic viremia.4 Thus, before rolling out such programs nationwide, countries need to know how to establish good quality VL monitoring (in terms of coverage and time-efficiency of testing, counseling, and retesting in all age groups).1 Furthermore, although VL monitoring is associated with superior programmatic outcomes, concerns have been expressed about the cost (and cost-effectiveness) of this monitoring strategy for low- and middle-income countries.5 However, costs of VL reagents are decreasing as demand for testing rises and more suppliers enter the market; because the cost of manufacture of reagents is relatively low, pooled purchasing by governments and major donors enables better price negotiation with the suppliers.6 The possibility of pooled sampling and other cost reduction strategies, such as dried blood spot sampling, means that VL monitoring is quickly becoming accessible to lower resource countries.7
Implementation research on routine VL monitoring in resource-limited settings is still limited. Several studies have investigated virological outcomes following adherence counseling, although most of these studies focused on adults (Cheti E, Reid T, Kizito W, et al. Is systematic viral load testing at six months of antiretroviral therapy followed by enhanced adherence counseling effective in reducing viral load in HIV-infected patients in an informal urban settlement in Nairobi, Kenya, unpublished data, 2013).7 In terms of impact on treatment decisions, existing studies suggest that many patients with virological failure identified through routine VL monitoring are not switched to second-line therapy; rates of switch as low as 0.18% among routinely virologically monitored patients have been described.8,9 Furthermore, it is not clear that VL monitoring always leads to earlier switching to second-line therapy; studies have reported “time to switch” of more than 16 months following VL testing.10,11
Swaziland is one of several countries in sub-Saharan Africa that is planning to roll out routine VL monitoring.12,13 In 2012, the country started a pilot program of routine VL monitoring with enhanced adherence counseling (EAC) for patients with detectable VL, in one region of the country, supported by Médecins Sans Frontières (MSF). No published studies document the feasibility and impact of VL monitoring in a rural setting comparable to Swaziland, with a highly decentralized health system and a low level of reported HIV drug resistance.14 Furthermore, the Swaziland pilot program uses a generic VL platform (commercialized by Biocentric, Bandol, France) to reduce costs; some authors have suggested that using generic platforms may make VL monitoring affordable, and so obtaining “real-time” costing data in such programs is essential.15
This study assesses the programmatic quality (coverage of testing and counseling), costs, and impact (virological outcomes and treatment decisions) of routine VL monitoring in Swaziland. The rate of switches to second-line therapy is described, as well as the number and proportion of patients who are “lost” at each step in the VL monitoring process. The study will thus inform the implementation approach for national roll-out and may assist other programs planning to introduce routine VL monitoring.
METHODS
Design
Retrospective cohort study using data from the pilot routine VL monitoring program in Shiselweni, Swaziland.
Setting
Swaziland is a landlocked lower- to middle-income country in Southern Africa, with a population of 1.2 million and an adult HIV prevalence of 31% (18–49 age group).8 Shiselweni (the study region) has a poor and rurally located population, with approximately 37,000 people living with HIV, 15,800 of whom are on ART.9 ART is provided through a decentralized network of 22 primary care clinics and 3 referral facilities; this has been achieved through task shifting of ART management from doctors to nurses. MSF has supported these health facilities since 2007.
Patients on ART in Swaziland undergo 6-monthly immunological monitoring; the country also has VL testing capacity at its National Reference Laboratory, but until now, this service is reserved for “targeted monitoring” for patients with suspected treatment failure. In 2012, MSF, in collaboration with the Ministry of Health, implemented routine plasma-based VL monitoring throughout the Shiselweni region, using a Generic HIV VL platform (Biocentric) based at the regional virology laboratory; MSF provided laboratory equipment and reagents, logistic support, and training of nursing and counseling staff. All patients on ART for at least 6 months are now offered annual VL monitoring, with EAC for patients with detectable VL. Full details of the program and monitoring algorithm can be found in Box S1 and Figure S1 (see Supplemental Digital Content, http://links.lww.com/QAI/A535).
Participants
The study population consisted of all patients on ART for at least 6 months (registered in the national ART database), attending Shiselweni primary healthcare clinics during October 01, 2012 to March 31, 2013. Patients who underwent VL testing and had a detectable VL were followed up for a minimum of 6 months after the test. Patients who had undergone VL testing in the previous year were excluded. Patients attending secondary facilities were not included because VL monitoring was not implemented in secondary facilities until early 2013.
Data Collection and Validation
The National ART Patient Monitoring Register was used to identify patients attending primary care clinics in the study period. To assess coverage, we linked the ART records of active patients with the VL laboratory records using a unique patient identifier (ART number).
To address questions of program quality, we followed up a cohort of patients with detectable VL, for whom laboratory records showed that their first VL test occurred during the study period. An MSF data clerk accessed patient files in the health facilities to collect data on dates of EAC sessions, treatment decisions following VL monitoring, and other outcomes (death, loss to follow-up, transfer out, or stopped ART). Clinic records were also used to determine when the health facility had received the test results. Because the patient normally receives their first EAC session on the day they receive a detectable VL result, the date of first EAC session was used to estimate the turnover time from blood draw to receipt of result by the patient. Information regarding patient follow-up and outcome was crosschecked with the doctors' records of “at-risk” patients (which include all pediatric HIV patients, all patients on second-line ART, and all patients with detectable VL).
Costing data included costs of reagents, laboratory staff, consumables, transport, equipment maintenance and depreciation, overheads, and construction depreciation. To enable comparison with the cost of CD4 monitoring, the same data were collected for point-of-care CD4 testing by PIMA, which is the primary means of CD4 quantification in the study setting. All data were obtained from accounting, invoices, and interviews with MSF and Ministry of Health staff. Triangulation between sources, using top-down (empirical) and bottom-up (theoretical) approaches, was used to ensure accuracy of costing data.
Data Analysis
Initial VL results were classified as “detectable” or “undetectable” according to the detection threshold of the Biocentric technique (100–400 copies/mL). Follow-up VL results were classified as “suppressed” or “virologic failure,” with virologic suppression defined as VL below the therapeutic failure threshold (1000 copies/mL) at least 60 days after an initial detectable VL.1
Proportions were estimated for patients eligible for and undergoing (1) VL testing (and their results), (2) EAC (and number of sessions received), and (3) retesting (and their results). Pearson χ2 test (for categorical variables) and a nonparametric comparison of medians (for continuous variables) were used to check for statistically significant differences in these 3 outcomes according to different subgroups of interest. The median time taken between each stage in the process was calculated and presented with interquartile ranges (IQRs).
The rate of switch to a second-line regimens is presented per 100 person-years, with the entry point determined as the date of blood draw for the initial VL and the exit date being the switch date or the end of follow-up in the cohort study (the last date a data clerk retrieved the patient files to extract outcome data). We estimated an overall rate of switch to second-line ART in patients undergoing routine VL monitoring using a proportionate random sample of undetectable first VL laboratory records from the same period, applying the median follow-up time for the detectable cohort to each record, and assuming that none switched to second-line therapy.
An ingredient costing approach, by which the total ingredient costs over a 1-year period were divided by the total number of tests done, was used to calculate the “fully loaded” cost of each VL and CD4 test. The annual cost per patient monitored was calculated separately for CD4 and VL monitoring, on the basis of the average number of tests per patient year (including EAC in the case of VL monitoring).
Epidata 3.1 was used for data entry. Data management and statistical analysis were performed using Stata/SE Version 12.1 (StataCorp, College Station, TX).
Ethics
This study has received ethical approval from the MSF Ethics Review Board, Geneva, Switzerland, and the Swaziland Scientific and Ethics Committee, Mbabane, Swaziland.
RESULTS
Baseline Characteristics of Study Population
In the study period, 6905 active patients on ART for over 6 months attended clinics in Shiselweni. Of these, 1342 individuals (19%) had already received a VL test in the previous year. The remaining 5563 patients were deemed eligible for VL testing, of whom 28 (0.5%) were on second-line therapy. Baseline characteristics of eligible patients are given in Table 1.
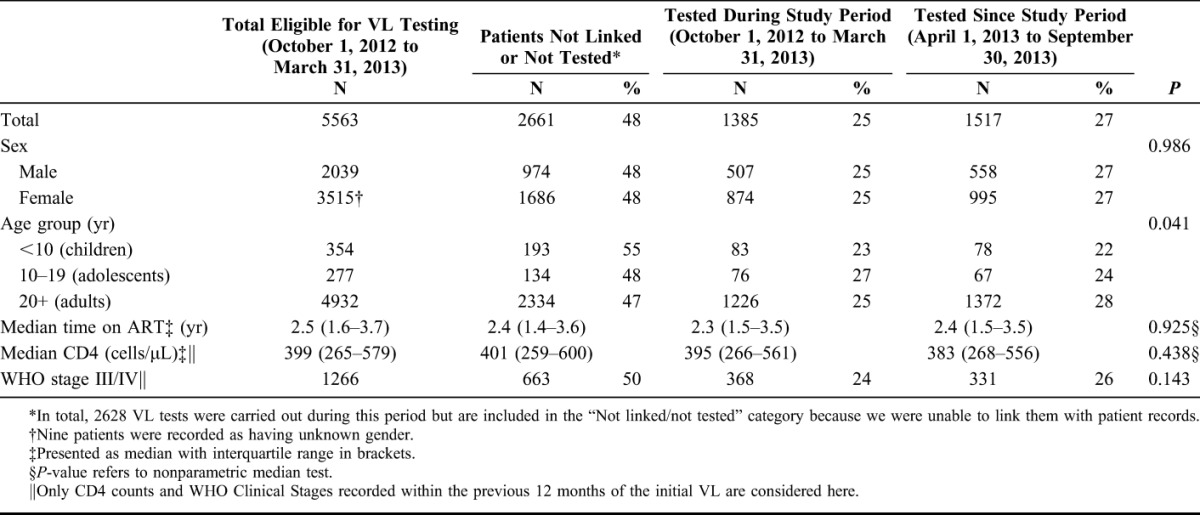
TABLE 1.
Proportions and Characteristics of Clinic ART Patients Undergoing Routine VL Monitoring in Shiselweni, Swaziland, During the Period of the Cohort Study (October 1, 2012 to March 31, 2013), and the Remaining 6 Months of the Year
Coverage of Testing
Of those eligible for VL testing, 1385 (25%) underwent testing within the 6-month study period and 1517 (27%) were tested in the subsequent 6 months (up to September 30, 2013) (Table 1). An additional 2220 initial VL tests were sent from clinics during these 12 months but could not be linked electronically with the patient records.
There was no significant difference in testing coverage by sex, and the median time on ART, and median last CD4 were similar among those who were tested and those who were not tested. Testing coverage seemed to be lower in children compared with adults (P = 0.0206).
Coverage of Counseling and Retesting Among Patients With Detectable VL
Laboratory records showed that 3242 VL tests were carried out in clinics in the 6-month study period, 551 (17%) of which were detectable (Fig. 1 and Table 2). Of these, 288 (52%) were confirmed to be initial VL tests in eligible patients. These patients were followed up using all available clinical records including the patient files for a median of 7.6 months (IQR: 6.2–9.2). From Figure 1, it can be seen that 78 (27%) of these patients did not receive EAC. Fifty-eight patients (20%) received a complete EAC intervention of 3 sessions and 152 (53%) received either 1 or 2 EAC sessions. There was no significant difference in coverage of EAC between sex and age groups. The median VL was similar in the group that received EAC and the group that did not.
FIGURE 1.
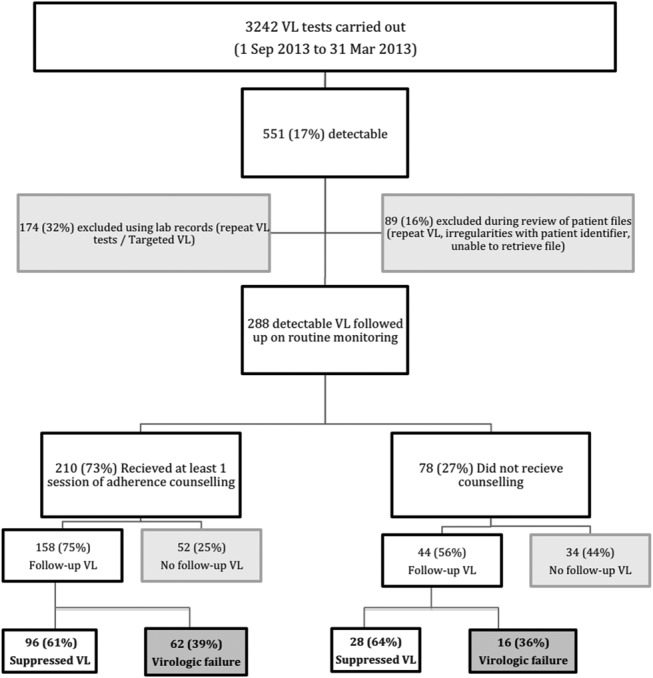
Routine VL monitoring cascade, showing “leaks” at each step, Shiselweni, Swaziland, October 1, 2012 to March 31, 2013.
TABLE 2.
Characteristics of Patients With Detectable VL, Showing the Proportions Undergoing Counseling, Receiving a Follow-up Test, and Being Diagnosed With Virological Failure, in Shiselweni, Swaziland (October 1, 2012 to March 31, 2013)
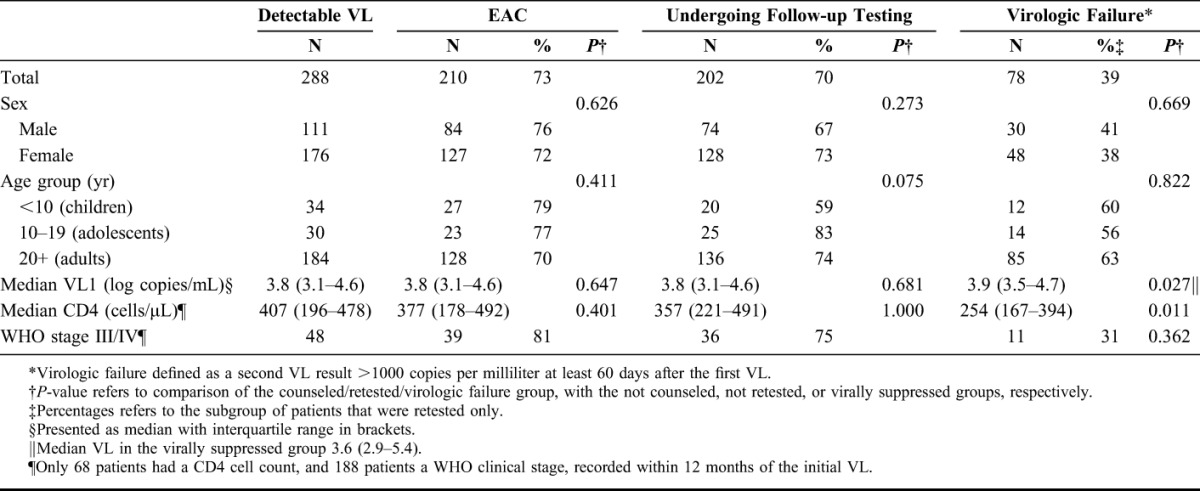
In all, 202 (70%) of patients with initial detectable VL received a follow-up VL, with a median time from first VL of 4.6 months (IQR: 3.4–6.2), and of these, 126 (62%) showed viral suppression. There was no significant difference in coverage of retesting or proportion suppressing by age group or sex; median time on ART in those who suppressed was similar to that in the overall study population. The proportion undergoing follow-up testing was significantly higher in patients who had received at least 1 EAC session than in those who received no EAC (75% and 56%, respectively, P < 0.001). Of the group that underwent EAC and were retested, 96 (61%) showed viral suppression, whereas in the group that did not receive EAC, 28 (64%) achieved suppression (P = 0.729); likewise the proportion resuppressing did not vary according to the number of counseling sessions received. There were no differences with regards to age or sex between patients with virological failure and those who showed suppression on retesting, but the last CD4 was significantly lower, and the initial VL significantly higher, among the failing patients (P = 0.011 and 0.027, respectively).
Final Outcomes After Routine VL Monitoring
Of 288 patients with detectable VL, 86 (30%) never had a follow-up test; 4 (5%) of these patients were changed to second-line therapy, 33 (37%) were lost to follow-up, and 6 (9%) died, were hospitalized, stopped ART, or were transferred (Table 3). The remaining 44 patients (51%) are still on first-line ART and attending their clinic visits.
TABLE 3.
Treatment Decisions and Results of Retesting in the 78 Patients With Virological Failure, Shiselweni, Swaziland (October 1, 2012 to March 31, 2013)
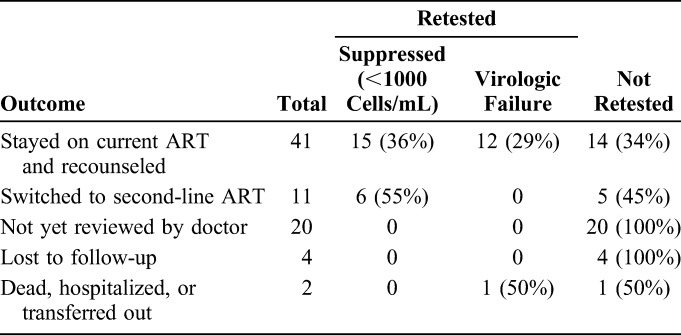
Of the 202 patients with detectable VL who had a follow-up test, 124 (61%) now showed viral suppression and were thus maintained on their current regimen. The remaining 78 patients still had a VL >1000 copies per milliliter, which equates to virologic failure; of these 11 (14%) were switched to second-line therapy after medical review. Forty-one patients (53%) were seen by a doctor and re-referred for further adherence counseling, of whom 15 (56%) of 27 who underwent a further VL test now showed viral suppression. Two patients (3%) were transferred out or hospitalized, 20 (26%) were not reviewed by a doctor, and 4 (4%) were lost to follow-up, and in these cases, no treatment decision was made.
In total, 15 patients were switched to second-line therapy, with a median time since first VL test of 6.7 months (IQR: 5.2–10.2). Eleven of these patients were switched after a follow-up VL >1000 copies per milliliter, which equates to 14% of the patients with virological failure according to the WHO algorithm; of these patients, 6 underwent a further VL test and all 6 (100%) were now virologically suppressed. The remaining 4 patients who switched to second line were switched after a single VL >1000 copies per milliliter (median time since VL 68 days, IQR: 43–92).
The 288 patients were followed-up for a total of 171 person-years. The rate of switch to second line among patients who had a detectable VL was 8.8 per 100 person-years (95% confidence interval: 5.2 to 14.2). Assuming that no patients with undetectable VL were switched to second-line therapy over an equivalent follow-up period, the estimated rate of switch to second-line ART in the cohort of VL monitored patients was 1.2 switches per 100 person-years (95% confidence interval: 0.7 to 2.0).
Costs
The total cost of 1 VL test was $28.33, comprising reagents ($18.76), staff ($4.95), consumables ($1.36), transport ($1.20), equipment ($1.18), overheads ($0.50), maintenance ($0.35), and construction ($0.03). The total cost of 1 (3 sessions) EAC intervention was $1.99. Given that 15% of the cohort had a detectable VL and required EAC and follow-up testing, and that 40% of those who had a follow-up test had virological failure and would thus require further counseling and a further VL test that year (whether or not switched to second-line therapy), it can be seen that VL monitored patients undergo on average 1.21 VL tests and 0.21 EAC interventions per patient per year. This equates to a “fully loaded” cost for routine VL monitoring of $35 per patient per year (with EAC contributing $0.42).
In comparison, the total cost of 1 CD4 test was $12.30, comprising reagents ($8.08), staff ($1.08), consumables ($0.29), equipment ($2.24), overheads ($0.18), and maintenance ($0.04). All CD4 monitored patients are supposed to undergo 2 CD4 tests per year, equivalent to a “fully loaded” cost for CD4 monitoring of $25 per patient per year.
DISCUSSION
This study showed that relatively robust routine VL monitoring is achievable in a health system managed by the Ministry of Health, in a setting with high HIV prevalence, at a cost that is approximately 40% higher than CD4 monitoring. However, only a small proportion of patients who met the WHO 2013 criteria for virologic failure were changed to second-line therapy. This seemed to be due to clinical suspicion of ongoing adherence problems, lack of review by a doctor, or loss to follow-up. Given that 60% of patients with initially detectable VLs resuppressed on retesting, for now the greatest impact of VL monitoring is reinforcing adherence rather than early identification of treatment failure.8 For VL monitoring to have its full value, program managers will need to monitor every step in the testing cascade, to ensure that “leaks” along the cascade are addressed.
Although only 2902 (52%) eligible patients were identified as having a VL test over the 12-month period (through linking their laboratory and clinical records), a further 2220 VL tests were sent from clinics over this period but could not be linked to the clinical database. We can estimate that 1865 (84%) of these additional tests are likely to have been initial VL tests in eligible patients (the review of patient files of patients with detectable VL excluded 16% of VL tests that seemed eligible according to laboratory records). The annual coverage is thus likely to be around 86%. There were several other significant “leaks in the cascade,” at the point of counseling (27%), follow-up testing (30%), and referral of patients with virological failure to see a doctor (26% not reviewed).
The time to receipt of results (<3 months) and time to switch to second-line therapy (<7 months) compare favorably with other studies that generally report much longer times to treatment switch.10,11 It is likely that the close supervision provided by the MSF doctors helped reinforce this cascade. Given that coverage is even then not yet optimal, it seems likely that intensified supervision will be required during the implementation phase of a national VL roll-out.
The majority of patients with an initial detectable VL subsequently suppressed (or maintained a VL <1000 copies/mL on retesting), as did the majority of patients with presumed virologic failure who were re-referred for counseling, which demonstrates the value of VL monitoring as a tool to reinforce adherence. It is, however, difficult to determine which element of the EAC intervention had this effect. Given that we observed similar rates of suppression among patients who did not receive EAC, it is possible that just being told by the nurse that your VL is detectable (and thus that you have been poorly adherent) is an equally powerful incentive to improve adherence as a 3-month course of EAC. However, the proportion of patients who were retested was significantly lower in the group that did not undergo EAC; because many patients who were not retested could still have had a high VL, the “real” virological outcomes in the noncounseled group may be poorer than our data suggest. Randomized controlled trials would be required to accurately determine the effectiveness of EAC for improving treatment compliance (and thus virological outcomes).
The rate of switch to second-line therapy of 1.2 per 100 patient-years following VL monitoring was lower than expected, yet is comparable to that seen in other resource-limited settings.3,10,16,17 Patients identified as being in virological failure had lower CD4 counts and higher initial VLs than the rest of the study population and thus are at higher risk of developing resistance mutations and complications associated with ongoing viremia. This apparent reluctance to switch to second-line therapy may reflect a judgment by the clinician that ongoing poor adherence (not resistance) was the cause of the virological failure or it may represent a “holding strategy,” to try to optimize the patient's adherence before changing therapy. Although training and supervision could help improve counseling quality and clinician confidence regarding second-line therapy, qualitative research might enable a better understanding of adherence barriers in those with virological failure, to help ascertain which patient groups could benefit most from counseling. Furthermore, it is important to ensure an adequate referral pathway for patients with virologic failure and that doctors are confident with interpreting VL results and second-line therapy initiation.
The strength of this study was the follow-up of individual patients through the full process of VL monitoring, which gives a reliable vision of the leaks in the cascade. However, patients were only followed up for a median of 7 months from the initial VL test, and some patients may have changed treatment regimens after this follow-up period. The analysis of costs includes only the testing and counseling process and does not take into account the consequent costs of increased switches to second-line therapy associated with VL monitoring nor the potential costs of additional CD4 and targeted VL tests for immunologically monitored patients with declining CD4 counts. Finally, very few patients in this cohort were already on second-line therapy; this may reflect the relative “youth” of the Swaziland ART program and may limit the generalizability of these findings to contexts with more mature ART programs.
In conclusion, implementation of routine VL monitoring was found to be feasible in a rural setting with high HIV prevalence and a large ART cohort, but strong clinical supervision is required during the implementation phase to mitigate against leaks in the monitoring cascade that will limit its public health impact. In our study, EAC seemed to have little impact on likelihood of viral resuppression, although those who did not receive EAC were also less likely to re-test, and the poorest virological outcomes may occur in this group. Furthermore, a better understanding of adherence barriers (through qualitative research) may help identify which groups are likely to benefit from EAC and which barriers require different types of intervention. Routine VL monitoring resulted in a lower-than-expected rate of switches to second-line therapy, which seems to reflect clinician concern that adherence problems had not been sufficiently addressed through EAC. Our study found the main impact of routine VL monitoring to be a means of reinforcing adherence support rather than increasing use of second-line therapy.
Supplementary Material
Footnotes
Supported by Médecins Sans Frontières—Operational Centre Geneva.
An extract of this data was presented at the Seventh International Francophone Conference on HIV and Hepatitis (AfraVIH), Montpellier, France, April 29, 2014.
The authors have no conflicts of interest to disclose.
Supplemental digital content is available for this article. Direct URL citations appear in the printed text and are provided in the HTML and PDF versions of this article on the journal's Web site (www.jaids.com).
REFERENCES
- 1.WHO. Consolidated Guidelines on the Use of Antiretroviral Drugs for Treating and Preventing HIV Infection. Recommendations for a Public Health Approach. World Health Organization, Geneva, 2013 [PubMed] [Google Scholar]
- 2.Kunutsor S, Walley J, Muchuro S, et al. Improving adherence to antiretroviral therapy in sub-Saharan African HIV-positive populations: an enhanced adherence package. AIDS Care. 2012;24:1308–1315 [DOI] [PubMed] [Google Scholar]
- 3.Keiser O, Chi BH, Gsponer T, et al. Outcomes of antiretroviral treatment in programmes with and without routine viral load monitoring in Southern Africa. AIDS. 2011;25:1761–1769 [DOI] [PMC free article] [PubMed] [Google Scholar]
- 4.Sigaloff KCE, Hamers RL, Wallis CL, et al. Unnecessary antiretroviral treatment switches and accumulation of HIV resistance mutations; two arguments for viral load monitoring in Africa. J Acquir Immune Defic Syndr. 2011;58:23–31 [DOI] [PubMed] [Google Scholar]
- 5.Keebler D, Revill P, Braithwaite S, et al. Cost-effectiveness of different strategies to monitor adults on antiretroviral treatment: a combined analysis of three mathematical models. Lancet Glob Health. 2014;2:e35–e43 [DOI] [PMC free article] [PubMed] [Google Scholar]
- 6.MSF Access Campaign. How Low Can We Go? Pricing for HIV Viral Load Testing in Low- and Middle-Income Countries. Geneva: MSF; 2013 [Google Scholar]
- 7.Bonner K, Mezochow A, Roberts T, et al. Viral load monitoring as a tool to reinforce adherence: a systematic review. J Acquir Immune Defic Syndr. 2013;64:74–78 [DOI] [PubMed] [Google Scholar]
- 8.Davies MA, Moultrie H, Eley B, et al. Virologic failure and second-line antiretroviral therapy in children in South Africa—the IeDEA Southern Africa Collaboration. J Acquir Immune Defic Syndr. 2011;56:270–278 [DOI] [PMC free article] [PubMed] [Google Scholar]
- 9.Orrell C, Harling G, Lawn S. Conservation of first-line antiretroviral treatment regimen where therapeutic options are limited. Antivir Ther. 2007;12:83–88 Available at: http://www.intmedpress.com/servefile.cfm?suid=4424b208-e825-4c65-96aa-8c9af65cfb60. Accessed March 20, 2013 [PubMed] [Google Scholar]
- 10.Johnston V, Fielding KL, Churchyard G. Outcomes following virological failure and predictors of switching to second-line antiretroviral therapy in a South African treatment programme. J Acquir Immune Defic Syndr. 2012;61:1–19 [DOI] [PMC free article] [PubMed] [Google Scholar]
- 11.Keiser O, Tweya H, Boulle A, et al. Switching to second-line antiretroviral therapy in resource-limited settings: comparison of programmes with and without viral load monitoring. AIDS. 2009;23:1867–1874 [DOI] [PMC free article] [PubMed] [Google Scholar]
- 12.Nkambule R. SHIMS (Swaziland HIV Incidence Measurement Survey)—Findings. ICAP, New York; 2012 [Google Scholar]
- 13.Strategic Information Department—Ministry of Health—Kingdom of Swaziland. ART Program Annual Report 2012. Ministry of Health, Mbabane, 2012 [Google Scholar]
- 14.Maphalala G, Okello V, Mndzebele S, et al. Surveillance of transmitted HIV drug resistance in the Manzini-Mbabane corridor, Swaziland, in 2006. Antivir Ther. 2008;13(suppl 2):95–100 Available at: http://www.ncbi.nlm.nih.gov/pubmed/18575197. Accessed March 20, 2013 [PubMed] [Google Scholar]
- 15.Boyer S, March L, Kouanfack C, et al. Monitoring of HIV viral load, CD4 cell count, and clinical assessment versus clinical monitoring alone for antiretroviral therapy in low-resource settings (Stratall ANRS 12110/ESTHER): a cost-effectiveness analysis. Lancet Infect Dis. 2013;13:577–586 [DOI] [PubMed] [Google Scholar]
- 16.Auld AF, Mbofana F, Shiraishi RW, et al. Four-year treatment outcomes of adult patients enrolled in Mozambique's rapidly expanding antiretroviral therapy program. PLoS One. 2011;6:e18453. [DOI] [PMC free article] [PubMed] [Google Scholar]
- 17.Landier J, Akonde A, Pizzocolo C, et al. Switch to second-line ART in West African routine care: incidence and reasons for switching. AIDS Care. 2011;23:75–78 [DOI] [PubMed] [Google Scholar]
Associated Data
This section collects any data citations, data availability statements, or supplementary materials included in this article.