

Abstract
Purpose:
Assessing pulmonary emphysema using Quantitative CT of the lung depends on accurate measures of CT density. Sinogram-Affirmed-Iterative-Reconstruction (SAFIRE) is a new approach for reconstructing CT data acquired at significantly lower doses. However, quantitative effects of this method remain unexplored. The authors investigated the effects on the median values of materials in the COPDGene2 test-object as a function of the reconstruction method [weighted filtered back projection (WFBP) versus SAFIRE], test-object size, dose, and material composition using a Siemens SOMATOM Definition FLASH CT scanner.
Methods:
The COPDGene2 test-object contains eight materials; acrylic, water, four foams (20 lb, 12 lb, lung-equivalent, and 4 lb emphysema-equivalent), internal and external-air. The test-object was scanned with three different outer ring sizes, simulating three different body habitus. There is an average size (36 cm) Ring A, large size (40 cm) Ring B, and small size Ring C (30 cm). The CT protocol used 120 kVp, 0.5 s rotation, 1.0 pitch, and a 0.6 slice collimation with progressively decreasing x-ray exposure values, 11.94–0.74 mGy. With a thorax length of 30 cm, the corresponding effective doses would be 5.01–0.31 mSv. The effects of using SAFIRE versus WFBP were assessed using a two tailed t-test for each ring size, material, and dose. Multivariable linear regression was used to evaluate the relative effects of ring size, material composition, dose, and reconstruction method on the measured median value in HU.
Results:
SAFIRE versus WFBP, at the largest ring size and two lowest doses there was a significant difference in median values of 4 lb-foam, p < 0.01. Using the smallest ring size at the lowest dose level there was a significant difference in the median value of 4 lb-foam, but the effect size was small, 1 HU. There is a significant difference in median values of both internal and external air using both the small and medium size rings at the three lowest dose levels, p < 0.05. There are significant differences noted at both high and low dose levels when using the large ring size in the median values of internal and external air when, p < 0.05. These effects on 4 lb-foam, inside and outside air are shown to be in part due to truncation effects on the median value since the lowest HU value in the CT scale used is −1024 HU. Multivariable linear regression results demonstrated significant effects on the measured material median value and standard deviation due to ring size, material composition, dose level, and reconstruction method, p < 0.05.
Conclusions:
The authors have shown that there is no significant effect on the median values obtained when using WFBP versus SAFIRE in materials with CT density between 120 and −856 HU using three different test-object sizes and CT doses that vary from 11.94 to 0.74 mGy. The authors have demonstrated there are significant effects on median values obtained when using WFBP versus SAFIRE in materials with CT density values between −937 and −1000 HU depending on the ring size and dose used. As expected, there is considerable reduction in image noise (lower standard deviation) using SAFIRE versus WFBP with all ring sizes, doses, and materials in the COPDGene2 test-object.
Keywords: computed tomography, quantitative CT, test object, phantom, lung imaging, emphysema, COPD, dose
I. INTRODUCTION
There is considerable interest in using quantitative CT (QCT) measures for the assessment of lung structure,1–8 QCT scans of the thorax require carefully designed CT protocols for the purpose of quantitatively assessing the amount of emphysema, air trapping, and inflammation that might be present in the lung. Such protocols would facilitate the following these pathologic changes over time to study the natural history of a variety of lung diseases as well as to assess their response to a variety of therapeutic interventions.9–19
A recent study from our laboratory validated that a test object containing acrylic, water, lung equivalent foam, internal and external air, the COPDGene 1 test object, can assess CT scanner performance in regard to changes in CT attenuation measurements over time in subjects participating in the COPDGene research study.1 All CT scans in that study used filtered back projection reconstruction kernels specifically avoiding newer iterative reconstruction methods because of the lack of information regarding the effects of these methods on imaging quantitation. New iterative reconstruction methods provide the opportunity to lower dose and or increase signal to noise ratio in CT images of the lungs compared to the established filtered back projection methods.20–32 The question that arises is whether these new iterative reconstruction methods will faithfully reproduce the median values of those studies that have used filtered back projection methods to determine the median CT values in normal and diseased lung parenchyma.
This paper will report our results on the effects of progressively reducing radiation exposure when performing MDCT scans of the COPDGene 2 test object. The COPDGene 2 test object contains eight materials of interest for imaging the thorax varying in CT density from −1000 to 120 HU. Measurements of the median and standard deviation (SD) for the eight different materials will be reported while progressively reducing radiation exposure from 11.94 to 0.75 mGy. For this study the Siemens B35f weighted filtered back projection (WFBP) (Ref. 33) kernel and the Siemens I30f Sinogram Affirmed Iterative Reconstruction (SAFIRE) second generation iterative reconstruction kernel were used for image reconstruction on scans obtained using a Siemens SOMATOM Definition FLASH MDCT scanner with the latest Stellar34 detector technology.
II. METHODS
II.A. MDCT scanner
The scanner used for this work was a Siemens SOMATOM Definition Flash which includes Stellar Detectors and Straton x-ray tubes. The scanner was running software version VA44 and is capable of performing both WFBP and SAFIRE reconstructions.
II.B. Test object
The test object (phantom) that was used for this study was the COPDGene 2 test object, Fig. 1. The COPDGene 2 test object is an improved version of the COPDGene 1 test object.1 The COPDGene 2 test object was manufactured to specifications that were provided to the Phantom Laboratories, Salem, NY. The specifications for improvement of the original COPDGene 1 test object were developed by the COPDGene Imaging Committee and also the National Institute of Standards (NIST) in Gaithersburg, MD, USA. The new features of the COPDGene 2 test object compared to the COPDGene 1 test object include the addition of three 3 cm cylinders of NIST manufactured foams. The three NIST foams are referred to as 4, 12, and 20 lb foams. These materials are used to generate different CT density references from −937 HU (4 lb foam), −824 HU (12 lb foam), and −703 HU (20 lb foam), respectively, Fig. 1.
FIG. 1.

COPDGene 2 test object/phantom as described in the text.
The COPDGene 2 test object preserves the 12 internal air holes and six embedded polycarbonate tubes from the COPDGene 1 test object. The tubes serve in the same capacity as in the COPDGene 1 test object, which is to simulate different airways sizes. Two of the polycarbonate tubes were embedded at a 30° angle to the z axis of the test object. Thus the COPDGene2 test object contains eight materials that can be used for a quantitative densitometry study; acrylic (120 HU), water (0 HU), 20 lb foam (−703 HU), 12 lb foam (−824 HU), lung equivalent foam (−856 HU), 4 lb foam emphysema-equivalent foam (−937 HU), internal air (−1000 HU), and external air (−1000 HU). This range of material densities encompasses the range of densities most often assessed with quantitative CT imaging of the lungs. The test object was scanned with three different water equivalent outer ring sizes, simulating three different body habituses. There is an average size (36 cm) Ring A, large size (40 cm) Ring B, and small size (30 cm) Ring C.
II.C. Test object CT scan protocol
The COPDGene 2 test object was secured to the CT table such that the long axis of the test object was parallel to the CT gantry along the x-y plane of the detector thus consistent with orientation of routine patient scanning. The table position was adjusted to place the test object in the iso-center of the imaging field of view. The CT scan protocol utilized a scan collimation of 0.6 mm × 128 slices, 0.75 mm slice thickness with 0.5 mm increment, pitch 1.0, 0.5 s rotation time, 120 kVp. The test object measures 50 mm in the z axis. We performed a spiral scan in the z axis of the test object of 50 mm in length that was centered in the middle of the z axis of the test object. Only the central 30 mm of the test object was used for the analysis.
Without moving the test object with a given outer Ring Configuration between runs, the object was scanned at six different effective mAs values ranging from 169 to 17 mAs, corresponding to six different x-ray exposures, 11.94 mGy (typical clinical CT of the thorax exposure), 9.02 or 9.04, 5.97, 3.04, 1.55 or 1.58, and 0.74 or 0.76 mGy. There were slight variations in the exposures at the ∼9 and ∼1.5 mGy range caused by a data entry issue at the time of scanning. Effective mAs is defined as tube current (mA) multiplied by rotation time (s) divided by pitch. Using a 30 cm DLP, typical for a human thorax, the corresponding effective doses would range from 5.01 to 0.31 mSv. When we performed WFBP reconstruction, the spiral scanning mode was selected along with the medium sharpness B35f standard weighted filtered back projection kernel. Using the same raw projection data, SAFIRE reconstruction mode was selected. Both reconstruction kernel and the SAFIRE strength parameter must be specified when using this particular manufacturer's iterative reconstruction technique.23,35–39 We selected the I30f reconstruction kernel since it is also a medium smooth kernel and is used in scanning the thorax and is very comparable to the B35f reconstruction kernel. Medium sharp kernels for both filtered back projection and iterative reconstruction methods with similar features are available from other CT manufacturers. The SAFIRE strength parameter varies from a value of 1 to 5. The number does not refer to the number of iterations that are performed and so does not influence reconstruction time. It does refer to the amount of noise reduction that is desired in the image while maintaining the same spatial resolution and acceptable image texture that is necessary for the imaging physician to render a qualitative interpretation. We selected SAFIRE strength 5 to get the highest amount of noise reduction possible. We used all three water equivalent ring sizes (A, B, C as described above) as depicted in Fig. 2. The data for the study included three scans of all eight materials using each of the outer rings, dose levels, reconstructed with both WFBP and SAFIRE.
FIG. 2.

(Top to bottom) Ring A, Ring B, and Ring C, see text.
II.D. Test object CT image segmentation and analysis
The regions of interest used to determine the median and standard deviation for each material in the test object were extracted using purpose built segmentation software which made use of threshholding followed by connected component analysis. The segmented regions were eroded by 4 pixels around the outer edge to eliminate the partial volume effect at the boundary in the x-y plane. The z axis of the test object measures 50 mm. However, the water bottle insert is only 30 mm in length and is centered along the z axis of the test object. The ROI segmentation software captures the central 20 mm of the z axis of the test object including the water bottle insert. The analysis in the z axis of this ROI included the central 10 mm. This was done to avoid edge effects where the scatter would change abruptly. We also wanted a thick enough slab to provide reasonable measures not only of median material value but also standard deviation of the material. The elliptical shaped core insert of the test object is made of lung equivalent foam that measures 250 × 150 mm in size in the x-y plane. The other seven materials are inserts placed within this larger core and each of these smaller inserts are circular in shape with a diameter of 30 mm. The number of voxels encompassed by the lung foam region in the x-y plane is much larger than the number of voxels encompassed by the other smaller material regions in the x-y plane, Fig. 1.
II.E. Statistical methods
Welch's two-tailed t-test, which compensates for unequal variance,40 was used to assess differences between the median values for a given material, ring size, and dose level when using WFBP versus SAFIRE.
To study the relative effects of ring size, dose level, and material composition on the measured median values in HU a multivariable covariance method was used of the following design:
| (1) |
There was no variation in the ROI voxel number for a given standard foam between the two reconstructions, but the ROIs of different foam standards are generally of different size; ROI voxel size ranges from 10 766 (acrylic) to 1 306 379 (lung foam). It is known that for normal data, the population variance of the sample median is proportional to the ratio of the population variance to the total voxels in the ROI, Sec. 5.24 in Ref. 41, which is properly accounted for in the specification of the data-case weight in the model for the median as specified by Eq. (1).
To study the relative effects of ring size, dose level, and material composition on the measured standard deviation of the median values the following multivariable covariance method was used:
| (2) |
All statistical analyses were conducted in R.42 A significant statistical difference was assumed if p < 0.05.
III. RESULTS
The results of our study are summarized in Tables I–VI. Table I summarizes the changes in median material value for the ROI and corresponding standard deviation (SD) (measure of noise) of the median value of the ROI as radiation dose is reduced from 11.94 to 0.74 mGy using Ring A and SAFIRE 5. Table II summarizes the data for Ring A using WFBP. Similarly, Tables III and IV summarize the mean material values for Ring B across the same range of radiation doses using SAFIRE 5, Table III, and WFBP, Table IV. Tables V and VI summarize the mean material values for SAFIRE 5 and WFBP, respectively, using Ring C. Below we elaborate on our results in these tables looking specifically at effect sizes and significance related to radiation exposure, material composition, reconstruction kernel, and ring size.
TABLE I.
Ring “A”: Median and standard deviation of the three materials scanned using SAFIRE at decreasing doses. *P value < 0.05—Comparing median SAFIRE value and median WFBP value at the same dose level for the same material.
| Material | SAFIRE: Ring A—median HU (sd) | |||||
|---|---|---|---|---|---|---|
| Dose (mGy) | 11.94 | 9.04 | 5.97 | 3.04 | 1.55 | 0.74 |
| Acrylic | 120 (6.57) | 120 (7.07) | 121 (7.21) | 120 (8.83) | 121 (11.21) | 120 (17.11) |
| Water | −5 (6.53) | −6 (6.82) | −5.00 (7.71) | −5 (9.43) | −6 (11.33) | −6 (15.97) |
| 20 lb foam | −702 (4.35) | −703 (4.47) | −702 (5.97) | −703 (8.37) | −703 (9.74) | −703 (14.75) |
| 12 lb foam | −824 (3.13) | −824 (3.56) | −823 (4.10) | −823 (5.92) | −823 (7.93) | −823 (11.67) |
| Lung foam | −857 (6.82) | −857 (6.97) | −856 (7.53) | −856 (8.97) | −856 (11.30) | −856 (15.43) |
| 4 lb foam | −937 (3.46) | −938 (4.23) | −938 (4.65) | −938 (6.49) | −937 (9.93) | −937 (14.32) |
| Internal air | −999 (2.97) | −999 (3.30) | −999 (4.09) | −998.0 (5.23)* | −997 (6.88)* | −994 (9.08)* |
| External air | −1002 (4.37) | −1002 (4.93) | −1002 (4.94) | −1001 (6.54)* | −1000 (8.01)* | −996 (10.77)* |
TABLE II.
Ring “A”: Median and standard deviation of the three materials scanned using WFBP at decreasing doses. *P value < 0.05—Comparing median SAFIRE value and median WFBP value at the same dose level for the same material.
| Material | WFBP: Ring A—median HU (sd) | |||||
|---|---|---|---|---|---|---|
| Dose (mGy) | 11.94 | 9.04 | 5.97 | 3.04 | 1.55 | 0.74 |
| Acrylic | 120 (9.82) | 120 (11.42) | 121 (12.18) | 120 (16.47) | 121 (23.04) | 120 (34.94) |
| Water | −5 (10.47) | −6 (11.32) | −5 (13.40) | −5 (18.03) | −6 (22.64) | −6 (33.52) |
| 20 lb foam | −702 (8.90) | −703 (9.33) | −702 (12.56) | −702 (17.81) | −702 (21.10) | −702 (31.80) |
| 12 lb foam | −823 (7.15) | −823 (8.15) | −823 (9.43) | −823 (13.60) | −823 (18.30) | −822 (26.73) |
| Lung foam | −856 (9.77) | −856 (10.61) | −856 (12.31) | −856 (16.22) | −855 (22.04) | −855 (31.78) |
| 4 lb foam | −937 (7.46) | −937 (9.25) | −937 (10.16) | −938 (14.21) | −937 (21.75) | −938 (31.34) |
| Internal air | −1000 (6.61) | −1000 (7.46) | −1000 (9.31) | −1000 (12.04)* | −999 (15.74)* | −997 (20.92)* |
| External air | −1003 (8.41) | −1003 (9.63) | −1003 (9.67) | −1004 (12.80)* | −1003 (15.50)* | −1000 (20.51)* |
TABLE III.
Ring “B”: Median and standard deviation of the three materials scanned using SAFIRE at decreasing doses. *P value < 0.05—Comparing median SAFIRE value and median WFBP value at the same dose level for the same material.
| Material | SAFIRE: Ring B—median HU (sd) | |||||
|---|---|---|---|---|---|---|
| Dose (mGy) | 11.94 | 9.04 | 5.97 | 3.04 | 1.55 | 0.74 |
| Acrylic | 116 (11.59) | 121 (11.79) | 113 (14.11) | 117 (18.31) | 119 (23.41) | 115 (38.26) |
| Water | −13 (11.35) | −7 (12.92) | −14 (13.79) | −11 (18.46) | −9 (24.88) | −15 (35.42) |
| 20 lb foam | −697 (9.81) | −698 (11.40) | −697 (12.39) | −698 (18.25) | −698 (25.00) | −696 (36.24) |
| 12 lb foam | −821 (7.19) | −821 (8.03) | −820 (9.33) | −821 (13.29) | −820 (18.18) | −820 (25.84) |
| Lung foam | −850 (14.13) | −850 (14.47) | −850 (16.15) | −849 (19.63) | −849 (24.30) | −848 (32.31) |
| 4 lb foam | −930 (9.40) | −931 (9.77) | −930 (12.98) | −930 (17.00) | −928 (20.26)* | −921 (28.62)* |
| Internal air | −994 (6.33)* | −993 (7.21) | −992 (8.57)* | −988 (10.84)* | −981 (13.50)* | −972 (17.19)* |
| External air | −999 (9.27)* | −998 (10.32)* | −997 (11.02) | −993 (13.74) | −985 (15.82) | −958 (30.40)* |
TABLE IV.
Ring “B”: Median and standard deviation of the three materials scanned using WFBP at decreasing doses. *P value < 0.05—Comparing median SAFIRE value and median WFBP value at the same dose level for the same material.
| Material | WFBP: Ring B—median HU (sd) | |||||
|---|---|---|---|---|---|---|
| Dose (mGy) | 11.94 | 9.04 | 5.97 | 3.04 | 1.55 | 0.74 |
| Acrylic | 116 (22.41) | 121 (23.71) | 113 (29.21) | 117 (38.76) | 119 (50.73) | 115 (79.98) |
| Water | −13 (21.89) | −7 (25.70) | −15 (28.37) | −11 (38.92) | −9 (54.02) | −15 (75.01) |
| 20 lb foam | −697 (21.29) | −697 (24.89) | −697 (27.13) | −697 (40.67) | −697 (55.10) | −695 (78.18) |
| 12 lb foam | −820 (16.08) | −820 (18.30) | −820 (21.41) | −820 (30.42) | −819 (41.86) | −819 (59.24) |
| Lung foam | −849 (21.98) | −849 (24.24) | −849 (28.79) | −848 (38.50) | −848 (50.41) | −849 (68.40) |
| 4 lb foam | −930 (20.52) | −932 (21.58) | −931 (28.61) | 932 (37.98) | −933 (45.86)* | −930 (62.70)* |
| Internal air | −996 (14.20)* | −995 (16.17) | −995 (19.22)* | −992 (24.77)* | −988 (31.38)* | −983 (39.30)* |
| External air | −1002 (16.47)* | −1002 (16.96)* | −1002 (19.17) | −1000 (22.87) | −997 (27.18) | −985 (50.40)* |
TABLE V.
Ring “C”: Median and standard deviation of the three materials scanned using SAFIRE at decreasing doses. *P value < 0.05—Comparing median SAFIRE value and median WFBP value at the same dose level for the same material.
| Material | SAFIRE: Ring C—median HU (sd) | |||||
|---|---|---|---|---|---|---|
| Dose (mGy) | 11.94 | 9.01 | 5.97 | 3.04 | 1.58 | 0.76 |
| Acrylic | 120 (6.60) | 121 (6.89) | 121 (7.32) | 120 (10.11) | 120 (12.60) | 121 (18.47) |
| Water | −8 (6.39) | −7 (6.66) | −6 (7.75) | −8 (9.24) | −7 (13.10) | −8 (18.12) |
| 20 lb foam | −702 (4.15) | −702 (4.38) | −702 (6.12) | −702 (7.69) | −702 (11.70) | −702 (16.71) |
| 12 lb foam | −824 (3.41) | −824 (3.61) | −823 (4.32) | −824 (6.18) | −823 (8.64) | −823 (12.56) |
| Lung foam | −857 (6.61) | −856 (6.84) | −856 (7.54) | −856 (9.07) | −856 (11.87) | −856 (16.31) |
| 4 lb foam | −937 (4.04) | −937 (4.65) | −937 (5.09) | −937 (7.85) | −937 (9.92) | −936 (15.02)* |
| Internal air | −1000 (3.31) | −999 (3.85) | −999 (4.73) | −998 (5.71)* | −997 (7.54)* | −993 (10.05)* |
| External air | −1001 (4.63) | −1001 (4.88) | −1001 (5.31)* | −1000 (7.31)* | −998 (9.15) | −994 (12.20)* |
TABLE VI.
Ring “C”: Median and standard deviation of the three materials scanned using WFBP at decreasing doses. *P value < 0.05—Comparing median SAFIRE value and median WFBP value at the same dose level for the same material.
| Material | WFBP: Ring C—median HU (sd) | |||||
|---|---|---|---|---|---|---|
| Dose (mGy) | 11.94 | 9.01 | 5.97 | 3.04 | 1.58 | 0.76 |
| Acrylic | 119 (10.86) | 120 (11.93) | 121 (13.20) | 120 (19.76) | 120 (25.52) | 121 (38.52) |
| Water | −8 (10.77) | −7 (11.51) | −7 (14.12) | −8 (18.22) | −7 (26.84) | −8 (38.12) |
| 20 lb foam | −702 (8.83) | −701 (9.39) | −701 (13.27) | −702 (16.74) | −702 (25.32) | −701 (36.17) |
| 12 lb foam | −824 (7.78) | −823 (8.20) | −823 (9.86) | −823 (14.15) | −823 (19.77) | −823 28.49) |
| Lung foam | −856 (10.05) | −856 (11.07) | −856 (12.98) | −855 (17.20) | −856 (23.98) | −856 (34.23) |
| 4 lb foam | −937 (8.95) | −937 (10.23) | −937 (11.29) | −937 (17.30) | −937 (21.96) | −937 (33.60)* |
| Internal air | −1000 (7.33) | −1000 (8.57) | −1000 (10.40) | −1000 (12.89)* | −999 (17.05)* | −997 (22.81)* |
| External air | −1002 (8.78) | −1002 (9.31) | −1003 (10.16)* | −1003 (13.89)* | −1002 (17.36) | −999 (22.41)* |
III.A. Radiation dose
Using the largest outer ring size, Ring B, and the SAFIRE reconstruction kernel, Table III, as the radiation dose to the test object was decreased from 11.94 to 0.74 mGy there was a significant shift in the median values of the 4 lb foam from −930 to −921 HU, p < 0.05. The effect size on median material value by reducing the radiation exposure from 11.94 to 0.74 mGy was even greater for internal air shifting from –994 to −973 HU, p < 0.05. There was no obvious unusual behavior in the standard deviation from the ROI's as the dose was reduced using the SAFIRE reconstruction kernel. The corresponding data for WFBP are summarized in Table IV. The shift in median material value was seen in internal air using WFBP but the effect size was much less, −996 to −983 HU. However, the corresponding SD of the internal air ROI, 39.3 HU, decreases more than one would expect at the lowest dose level of 0.74 mGy when compared to the SD ROI of 4 lb foam, 62.7 HU, at 0.74 mGy, Table IV. This effect is seen well in Fig. 3 where the corresponding histograms for internal air are graphed as a function of radiation dose. A clear truncation artifact is seen in the lower dose histograms for internal air using WFBP, Fig. 3 (upper left). The corresponding histogram for internal air using SAFIRE shows a different effect with increased skewness from a normal Gaussian distribution as the dose decreases from 11.94 to 0.74 mGy, Fig. 3 (upper right). The histograms for water are Gaussian shaped for both WFBP, Fig. 3 (lower left), and SAFIRE, Fig. 3 (lower right), at all dose levels.
FIG. 3.
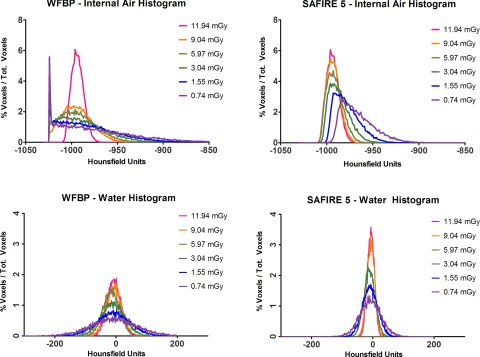
Histograms plots of internal air and water, using WFBP and SAFIRE.
III.B. Material composition
Material composition does have an effect on the change in median value as a function of decreasing radiation dose that is best demonstrated in the data obtained using Ring B, Tables III and IV. The materials that have a higher mean attenuation value measured in HU's do not shift significantly using SAFIRE, Table III. Water measures −13 HU at a dose of 11.94 mGy and measures –15 HU at 0.74 mGy, p > 0.05. However, the very low attenuating material internal air has a median attenuation value of –994 HU at 11.94 mGy and −972 HU at 0.74 mGy, p < 0.05, which is a very large effect size with statistical significance compared to water. Similarly, using WFBP and Ring B in Table IV, there is no significant shift in the higher attenuating material water, −13 HU, at a dose of 11.94 mGy, compared to a value of −15 HU at the lowest dose of 0.74 mGy, p > 0.05. However, the median attenuation value of internal air measures −996 HU at a dose level of 11.94 and −983 HU at dose level of 0.74 HU which is a moderately large effect size with statistical significance, p < 0.05. The changes in median attenuation of lower density materials such as internal air are less when using the smaller Ring A and Ring C sizes, Tables I and II for Ring A and Tables V and VI for Ring C.
III.C. Reconstruction method
The SAFIRE and WFBP reconstruction kernel have no significant effect on the median attenuating values of the higher attenuating materials such as acrylic or water across the dose range of 11.94–0.74 mGy, Tables I–VI. However, there is a significant effect, p < 0.05, in the median attenuating values of internal and external air for all ring sizes as the radiation dose is decreased from 11.94 to 0.74 mGy for both SAFIRE and WFBP but the effect size for SAFIRE is greater than WFBP for the lower attenuating materials such as internal air, Tables III and IV, with a change in the median value of internal of 22 HU for SAFIRE, p < 0.05, and a corresponding change in median value of internal air of 13 HU for WFBP, p < 0.05.
III.D. Ring size
Ring size has a significant effect on the median attenuation values of the materials with lower attenuating values. The data using the smallest ring, Ring A, are summarized in Table I for SAFIRE. As dose is reduced from 11.94 to 0.74 mGy, the median attenuating value of 4 lb foam measures −937 HU at both the highest and lowest doses, p > 0.05. However, when the largest ring size is used, Ring B, Table III, using the same SAFIRE reconstruction method, the value of 4 lb foam increases from −930 HU at 11.94 mGy to −921 HU at 0.74 mGy, p < 0.05.
III.E. Multiple variable regression analysis
Given the above results for the changes in median value attenuation values in a given material ROI as a function of radiation dose, material composition, reconstruction method, and ring size that are summarized in Tables I–VI, we used multiple variable regression analysis to see if in a multivariable model the above relationships between radiation dose, material composition, reconstruction method, and ring size would continue to hold. The multivariable covariant model for the median attenuating material value (response variable), see Sec. II, showed a significant correlation, overall model adjusted R2 = 0.9999, p-value < 2.2 × 10⁻¹⁶, for the following explanatory variables: radiation dose, material composition, reconstruction method, and ring size confirming what we have described above.
Similarly, given the above results for changes in the SD of the median attenuating values in a given material ROI as a function of radiation dose, material composition, reconstruction method, and different ring size that are summarized in Table I–VI, we used multiple variable regression analysis to see if in a multivariable model the above relationships between the SD of the median attenuation value and radiation dose, material composition, reconstruction method, and ring size would continue to hold. The multivariable covariant model used for the SD of the median attenuating value (response variable), see Sec. II, showed a significant correlation, overall model adjusted R2 = 0.968, p-value < 2.0 × 10⁻¹⁶, for the explanatory variables: radiation dose, material composition, reconstruction method, and ring size and total number of voxels in the sampled ROI for a given material.
We also complement the above formal statistical analysis by plotting material by material, the median response from SAFIRE minus that from WFPB against the average response, with data colored according to dose and shaped according to ring type, Fig. 4. The plot is done in the spirit of a Bland-Altman analysis. It clearly demonstrates that the two methods are comparable for all materials, except Foam 4 lb, internal and external air, for which the problem of truncation kicks in as the response distributions have significant tail probability below −1024 HU.
FIG. 4.

Shows difference of median CT attenuation measurements from the two reconstruction kernels versus the average of the median CT attenuation measurements.
IV. DISCUSSION
The results of our study have demonstrated a significant difference between measured median and standard deviation of materials in the COPDGene 2 test object due to reconstruction method, material composition, ring size, radiation dose and in the case of the standard deviation total voxels in the sampled ROI of a given material. However, our results demonstrated no statistical difference for materials with densities of 120 HU down to −856 HU using either SAFIRE or WFBP at dose levels from 11.94 to 0.74 mGy for all test object ring sizes. The effect size of the 4 lb foam (−937 HU) is quite small between WFBP and SAFIRE at all dose levels when using the small ring, Ring C, compared to the very large ring, Ring B. The most significant effects occur with internal and external air densities (−1000 HU) at lower doses and at lower material values for all ring sizes. It is also significant when measuring 4 lb foam (−937 HU) as well as internal and external air when the largest ring size is used. These results are partly due to truncation of the Hounsfield scale at −1024 HU, for the following reason. The variance of a truncated normal distribution is smaller than the untruncated distribution, with the reduction in variance strictly decreasing with the truncation fraction. For instance, if 30% of the attenuation coefficient is lower than −1024 HU and hence they are truncated to 1024 HU, the variance of the truncated normal distribution is reduced to about half of the original variance, see Fig. 2 in Barr and Sherrill.43 However, truncation at −1024 HU is consequential only for distribution with substantial tail probability below −1024 HU. In particular, we have identified a paradoxical lowering of the standard deviation as the median material value shifts more positive which can be explained by a sudden change in the low values using the larger ring size from a normal distribution to a very non-normal distribution of values. This effect is seen at low doses and any ring size for internal air and also 4 lb foam and air at the largest ring size across a larger range of doses. The truncation effect was previously reported,44 for weighted filtered back projection but not for iterative reconstruction or the relative effects between the two. The reduced variance of the sample median calculated from the truncated data deflates the standard errors of the coefficient estimates, resulting in inflated significant statistical results which should be interpreted with caution.
Recently, technological advances in CT scanner design and new reconstruction capabilities are lowering radiological CT exposures. Multi-detector (MDCT) scanners, those above 64 detectors have less over scanning, have improved detector design, as well as improved amplifiers to boost the signal compared to early models.45 These features coupled with new model based iterative reconstruction allow MDCT to achieve a quality image with considerably less radiation.22,23,36,46 Baker et al. recently reported that SAFIRE reconstructions improved contrast to noise compared to filtered back projection in both a liver test object and in in vivo CT scans of the liver.23 At 70% and 50% of the dose, SAFIRE had increased contrast to noise level (CNR) compared with the 100% dose WFBP method. Kalra et al. also reported recently that SAFIRE provided equivalent diagnostic value for CT images of the liver at a 50% lower radiation dose over WFBP.36 In some patients a 75% reduction in dose was possible with SAFIRE without a decrease in diagnostic value. While these groups focused on anatomical organs related to muscle and fat, our work focused on the effects of SAFIRE (strength 5) related to changes in lower density measures. Results of this test object study are relevant to CT scans obtained on humans to assess lung density. The median values for the reconstruction method determine the thresh-holds that are used to determine the amount of air trapping (−856 HU on FRC CT Scans) or emphysema (−950 HU on TLC CT scans) that is present. If there is a shift in the median value of the lung between reconstruction methods there will be a change in the corresponding measure of air trapping or emphysema. The SD of the reconstruction method determines the noise in the measurement and as the SD increases the ability to detect a small change in lung density will decrease. This is the precision of the measurement. The reduced SD with SAFIRE would improve the ability to detect small changes in lung density compared to WFBP.
The main advantage of iterative reconstruction is the ability to maintain image quality while scanning at lower radiation exposures. There are also disadvantages. Beister et al.22 discussed the need for extensive computations when using iterative methods, especially when increased scatter or motion is present. There are additional biologic effects in quantitative lung imaging that are not addressed by our COPDGene 2 test object since the lung is surrounded by bone which produces scatter, and the heart introduces cardiogenic motion as an additional issue. While it is difficult for a test object to simulate all the biological effects that determine lung density, it can more readily provide important systematic information by standardized analysis of known physical densities that measure a portion of the important biological effects. The test object we chose, the COPDGene 2 test object is an improved version of the COPDGene 1 test object.1 The COPDGene 2 test objects provides three additional foam like materials that are in the range of normal and abnormal lung tissue, −703, −824, and −934 HU. Another advantage of using a test object is the ability to scan the stationary object many times and reconstruct the scans using exactly the same scan settings. Willimink et al.47 performed a similar radiation dose study design, using an anthropomorphic phantom scanned multiple times at different dose levels to evaluate differences in lung nodule volume using both iterative reconstructions and filtered back projection. Willimink reported no “clinically significant” difference in lung nodule size using either reconstruction method. However, it was mentioned that certain size nodules could lead to over or under estimation of nodule volume.
In summary, our study indicates that a multi-material test object, like the one presented, can identify inaccuracies in CT density measurements that occur in the low densities of interest in imaging the lung when using new CT technologies such as model based iterative reconstruction as well as proven CT technologies like weighted filtered back projection. We have shown that truncation of the Hounsfield scale at −1024 HU identified a paradoxical lowering of the standard deviation as the median material value shifted more positive. This effected the voxel distribution of the low values using the larger ring size. Based on this, we assume that by extending the Hounsfield scale well below −1024 HU and avoiding truncation errors, unwanted effects of truncation can be eliminated. This will allow for robust quantitative measures of lung density to extend to −1000 HU using conventional or dose reducing reconstruction technologies.
ACKNOWLEDGMENTS
E.A.H. is a founder and shareholder of VIDA Diagnostics Inc., a company commercializing lung image analysis software developed, in part, at the University of Iowa. J.P.S. and J.D.N. are paid consultants for VIDA Diagnostics Inc. J.D.N. has stock options with VIDA. Siemens Healthcare has provided in-kind support for hardware and software residing at the University of Iowa and used in this project.
REFERENCES
- 1.Sieren J. P.et al. , “Reference standard and statistical model for intersite and temporal comparisons of CT attenuation in a multicenter quantitative lung study,” Med. Phys. 39(9), 5757–5767 (2012). 10.1118/1.4747342 [DOI] [PMC free article] [PubMed] [Google Scholar]
- 2.Zach J. A.et al. , “Quantitative computed tomography of the lungs and airways in healthy nonsmoking adults,” Invest. Radiol. 47(10), 596–602 (2012). 10.1097/RLI.0b013e318262292e [DOI] [PMC free article] [PubMed] [Google Scholar]
- 3.Martinez C. H.et al. , “Relationship between quantitative CT metrics and health status and BODE in chronic obstructive pulmonary disease,” Thorax 67(5), 399–406 (2012). 10.1136/thoraxjnl-2011-201185 [DOI] [PMC free article] [PubMed] [Google Scholar]
- 4.Barr R. G.et al. , “A combined pulmonary-radiology workshop for visual evaluation of COPD: Study design, chest CT findings, and concordance with quantitative evaluation,” COPD 9(2), 151–159 (2012). 10.3109/15412555.2012.654923 [DOI] [PMC free article] [PubMed] [Google Scholar]
- 5.Han M. K.et al. , “Chronic obstructive pulmonary disease exacerbations in the COPDGene study: Associated radiologic phenotypes,” Radiology 261(1), 274–282 (2011). 10.1148/radiol.11110173 [DOI] [PMC free article] [PubMed] [Google Scholar]
- 6.Kim D. K.et al. , “Clinical and radiographic correlates of hypoxemia and oxygen therapy in the COPDGene study,” Respir. Med. 105(8), 1211–1221 (2011). 10.1016/j.rmed.2011.02.015 [DOI] [PMC free article] [PubMed] [Google Scholar]
- 7.Hersh C. P.et al. , “Family history is a risk factor for COPD,” Chest. 140(2), 343–350 (2011). 10.1378/chest.10-2761 [DOI] [PMC free article] [PubMed] [Google Scholar]
- 8.Regan E. A.et al. , “Genetic epidemiology of COPD (COPDGene) study design,” COPD 7(1), 32–43 (2010). 10.3109/15412550903499522 [DOI] [PMC free article] [PubMed] [Google Scholar]
- 9.Swift I.et al. , “Demographic, physiologic and radiographic characteristics of COPD patients taking chronic systemic corticosteroids,” COPD 9(1), 29–35 (2012). 10.3109/15412555.2011.634454 [DOI] [PMC free article] [PubMed] [Google Scholar]
- 10.Hardin M.et al. , “The clinical features of the overlap between COPD and asthma,” Resp. Res. 12, 127–134 (2011). 10.1186/1465-9921-12-127 [DOI] [PMC free article] [PubMed] [Google Scholar]
- 11.Busacker A.et al. , “A multivariate analysis of risk factors for the air-trapping asthmatic phenotype as measured by quantitative CT analysis,” Chest 135(1), 48–56 (2009). 10.1378/chest.08-0049 [DOI] [PMC free article] [PubMed] [Google Scholar]
- 12.Aysola R. S.et al. , “Airway remodeling measured by multidetector CT is increased in severe asthma and correlates with pathology,” Chest 134(6), 1183–1191 (2008). 10.1378/chest.07-2779 [DOI] [PMC free article] [PubMed] [Google Scholar]
- 13.Newman K. B.et al. , “Quantitative computed tomography detects air trapping due to asthma,” Chest 106(1), 105–109 (1994). 10.1378/chest.106.1.105 [DOI] [PubMed] [Google Scholar]
- 14.Yamashiro T.et al. , “Quantitative airway assessment on computed tomography in patients with alpha1-antitrypsin deficiency,” COPD 6(6), 468–477 (2009). 10.3109/15412550903341521 [DOI] [PMC free article] [PubMed] [Google Scholar]
- 15.Stolk J.et al. , “Progression parameters for emphysema: A clinical investigation,” Respir. Med. 101(9), 1924–1930 (2007). 10.1016/j.rmed.2007.04.016 [DOI] [PubMed] [Google Scholar]
- 16.Stavngaard T., Shaker S. B., and Dirksen A., “Quantitative assessment of emphysema distribution in smokers and patients with alpha1-antitrypsin deficiency,” Respir. Med. 100(1), 94–100 (2006). 10.1016/j.rmed.2005.04.001 [DOI] [PubMed] [Google Scholar]
- 17.Shaker S. B.et al. , “Quantitative computed tomography and aerosol morphometry in COPD and alpha1-antitrypsin deficiency,” Eur. Respir. J. 25(1), 23–30 (2005). 10.1183/09031936.04.00075304 [DOI] [PubMed] [Google Scholar]
- 18.Parr D. G.et al. , “Influence of calibration on densitometric studies of emphysema progression using computed tomography,” Am. J. Respir. Crit. Care Med. 170(8), 883–890 (2004). 10.1164/rccm.200403-326OC [DOI] [PubMed] [Google Scholar]
- 19.Newell J. D. Jr., Hogg J. C., and Snider G. L., “Report of a workshop: Quantitative computed tomography scanning in longitudinal studies of emphysema,” Eur. Respir. J. 23(5), 769–775 (2004). 10.1183/09031936.04.00026504 [DOI] [PubMed] [Google Scholar]
- 20.Neroladaki A.et al. , “Computed tomography of the chest with model-based iterative reconstruction using a radiation exposure similar to chest X-ray examination: Preliminary observations,” Eur Radiol. 23(2), 360–366 (2013). 10.1007/s00330-012-2627-7 [DOI] [PubMed] [Google Scholar]
- 21.Mets O. M.et al. , “The effect of iterative reconstruction on computed tomography assessment of emphysema, air trapping, and airway dimensions,” Eur. Radiol. 22(10), 2103–2109 (2012). 10.1007/s00330-012-2489-z [DOI] [PMC free article] [PubMed] [Google Scholar]
- 22.Beister M., Kolditz D., and Kalender W. A., “Iterative reconstruction methods in X-ray CT,” Phys. Med. 28(2), 94–108 (2012). 10.1016/j.ejmp.2012.01.003 [DOI] [PubMed] [Google Scholar]
- 23.Baker M. E.et al. , “Contrast-to-noise ratio and low-contrast object resolution on full- and low-dose MDCT: SAFIRE versus filtered back projection in a low-contrast object phantom and in the liver,” AJR, Am. J. Roentgenol. 199(1), 8–18 (2012). 10.2214/AJR.11.7421 [DOI] [PubMed] [Google Scholar]
- 24.Singh S.et al. , “Adaptive statistical iterative reconstruction technique for radiation dose reduction in chest CT: A pilot study,” Radiology 259(2), 565–573 (2011). 10.1148/radiol.11101450 [DOI] [PubMed] [Google Scholar]
- 25.Pontana F.et al. , “Chest computed tomography using iterative reconstruction vs filtered back projection (Part 1): Evaluation of image noise reduction in 32 patients,” Eur. Radiol. 21(3), 627–635 (2011). 10.1007/s00330-010-1990-5 [DOI] [PubMed] [Google Scholar]
- 26.Pontana F.et al. , “Chest computed tomography using iterative reconstruction vs filtered back projection (Part 2): Image quality of low-dose CT examinations in 80 patients,” Eur. Radiol. 21(3), 636–643 (2011). 10.1007/s00330-010-1991-4 [DOI] [PubMed] [Google Scholar]
- 27.Hu X. H.et al. , “Radiation dose of non-enhanced chest CT can be reduced 40% by using iterative reconstruction in image space,” Clin. Radiol. 66(11), 1023–1029 (2011). 10.1016/j.crad.2011.04.008 [DOI] [PubMed] [Google Scholar]
- 28.Honda O.et al. , “Image quality of multiplanar reconstruction of pulmonary CT scans using adaptive statistical iterative reconstruction,” Br. J. Radiol. 84(1000), 335–341 (2011). 10.1259/bjr/57998586 [DOI] [PMC free article] [PubMed] [Google Scholar]
- 29.Silva A. C.et al. , “Innovations in CT dose reduction strategy: Application of the adaptive statistical iterative reconstruction algorithm,” AJR, Am. J. Roentgenol. 194(1), 191–199 (2010). 10.2214/AJR.09.2953 [DOI] [PubMed] [Google Scholar]
- 30.Prakash P.et al. , “Radiation dose reduction with chest computed tomography using adaptive statistical iterative reconstruction technique: Initial experience,” J. Comput. Assist. Tomogr. 34(1), 40–45 (2010). 10.1097/RCT.0b013e3181b26c67 [DOI] [PubMed] [Google Scholar]
- 31.Prakash P.et al. , “Diffuse lung disease: CT of the chest with adaptive statistical iterative reconstruction technique,” Radiology 256(1), 261–269 (2010). 10.1148/radiol.10091487 [DOI] [PubMed] [Google Scholar]
- 32.Flohr T. G.et al. , “Pushing the envelope: New computed tomography techniques for cardiothoracic imaging,” J. Thorac. Imaging 25(2), 100–111 (2010). 10.1097/RTI.0b013e3181d7e898 [DOI] [PubMed] [Google Scholar]
- 33.Stierstorfer K.et al. , “Weighted FBP–A simple approximate 3D FBP algorithm for multislice spiral CT with good dose usage for arbitrary pitch,” Phys. Med. Biol. 49(11), 2209–2218 (2004). 10.1088/0031-9155/49/11/007 [DOI] [PubMed] [Google Scholar]
- 34.Morsbach F.et al. , “Stenosis quantification in coronary CT angiography: Impact of an integrated circuit detector with iterative reconstruction,” Invest. Radiol. 48(1), 32–40 (2013). 10.1097/RLI.0b013e318274cf82 [DOI] [PubMed] [Google Scholar]
- 35.Yang W. J.et al. , “Can sinogram-affirmed iterative (SAFIRE) reconstruction improve imaging quality on low-dose lung CT screening compared with traditional filtered back projection (FBP) reconstruction?,” J. Comput. Assist. Tomogr. 37(2), 301–305 (2013). 10.1097/RCT.0b013e31827b8c66 [DOI] [PubMed] [Google Scholar]
- 36.Kalra M. K.et al. , “Radiation dose reduction with Sinogram Affirmed Iterative Reconstruction technique for abdominal computed tomography,” J. Comput. Assist. Tomogr. 36(3), 339–346 (2012). 10.1097/RCT.0b013e31825586c0 [DOI] [PubMed] [Google Scholar]
- 37.Baumueller S.et al. , “Low-dose CT of the lung: Potential value of iterative reconstructions,” Eur. Radiol. 22(12), 2597–606 (2012). 10.1007/s00330-012-2524-0 [DOI] [PubMed] [Google Scholar]
- 38.Winklehner A.et al. , “Raw data-based iterative reconstruction in body CTA: Evaluation of radiation dose saving potential,” Eur. Radiol. 21(12), 2521–2526 (2011). 10.1007/s00330-011-2227-y [DOI] [PubMed] [Google Scholar]
- 39.Moscariello A.et al. , “Coronary CT angiography: Image quality, diagnostic accuracy, and potential for radiation dose reduction using a novel iterative image reconstruction technique-comparison with traditional filtered back projection,” Eur. Radiol. 21(10), 2130–2138 (2011). 10.1007/s00330-011-2164-9 [DOI] [PubMed] [Google Scholar]
- 40.Welch B. L., “The generalization of students problem when several different population variances are involved,” Biometrika 34(1–2), 28–35 (1947). [DOI] [PubMed] [Google Scholar]
- 41.van der Vaart A. W., Asymptotic Statistics (Cambridge University Press, Cambridge, 1998). [Google Scholar]
- 42. R Development Core Team, R: A Language and Environment for Statistical Computing (R Foundation for Statistical Computing, Vienna, Austria, 2011). [Google Scholar]
- 43.Barr D. R. and Sherril E. T., “Mean and variance of truncated normal distributions,” Am. Stat. 53, 357–361 (1999). [Google Scholar]
- 44.Yuan R.et al. , “The effects of radiation dose and CT manufacturer on measurements of lung densitometry,” Chest 132(2), 617–623 (2007). 10.1378/chest.06-2325 [DOI] [PubMed] [Google Scholar]
- 45.Rogalla P., Kloeters C., and Hein P. A., “CT technology overview: 64-slice and beyond,” Radiol. Clin. North Am. 47(1), 1–11 (2009). 10.1016/j.rcl.2008.10.004 [DOI] [PubMed] [Google Scholar]
- 46.Wang H.et al. , “Raw-data-based iterative reconstruction versus filtered back projection: Image quality of low-dose chest computed tomography examinations in 87 patients,” Clin. Imaging 37(6), 1024–1032 (2013). 10.1016/j.clinimag.2013.06.004 [DOI] [PubMed] [Google Scholar]
- 47.Willemink M. J.et al. , “Systematic error in lung nodule volumetry: Effect of iterative reconstruction versus filtered back projection at different CT parameters,” AJR, Am. J. Roentgenol. 199(6), 1241–1246 (2012). 10.2214/AJR.12.8727 [DOI] [PubMed] [Google Scholar]