Lichenized fungi create a suitable habitat for their photobionts to ensure desiccation tolerance by differentially adjusting their cellular osmolarity to match those of chlorobionts or cyanobionts.
Abstract
Lichens result from symbioses between a fungus and either a green alga or a cyanobacterium. They are known to exhibit extreme desiccation tolerance. We investigated the mechanism that makes photobionts biologically active under severe desiccation using green algal lichens (chlorolichens), cyanobacterial lichens (cyanolichens), a cephalodia-possessing lichen composed of green algal and cyanobacterial parts within the same thallus, a green algal photobiont, an aerial green alga, and a terrestrial cyanobacterium. The photosynthetic response to dehydration by the cyanolichen was almost the same as that of the terrestrial cyanobacterium but was more sensitive than that of the chlorolichen or the chlorobiont. Different responses to dehydration were closely related to cellular osmolarity; osmolarity was comparable between the cyanolichen and a cyanobacterium as well as between a chlorolichen and a green alga. In the cephalodium-possessing lichen, osmolarity and the effect of dehydration on cephalodia were similar to those exhibited by cyanolichens. The green algal part response was similar to those exhibited by chlorolichens. Through the analysis of cellular osmolarity, it was clearly shown that photobionts retain their original properties as free-living organisms even after lichenization.
Lichens are ubiquitously found in all terrestrial environments, including those with extreme climates such as Antarctica and deserts; they are pioneer organisms in primary succession (Longton, 1988; Ahmadjian, 1993). Colonization ability is largely owed to lichens’ extreme tolerance for desiccation (Ahmadjian, 1993). Although lichens harbor photosynthetic green algae or cyanobacteria (blue-green algae) within their thalli, they show metabolic activity even when dried at 20°C and under conditions of 54% relative humidity (Cowan et al., 1979). This desiccation tolerance partially results from drought resistance originally exhibited by the photobiont. It is further strengthened by lichen symbiosis (Kosugi et al., 2009). Cyanolichens (symbiosis between a fungus and a cyanobacterium) are desiccation-tolerant organisms that favor humid and shady environments, whereas chlorolichens (symbiosis between a fungus and a green alga) tolerate dry and high-light environments (James and Henssen, 1976; Lange et al., 1988). Chlorolichens can perform photosynthesis when the surrounding humidity is high, but cyanolichens require some water in a liquid state (Lange et al., 1986, 2001; Nash et al., 1990; Ahmadjian, 1993).
Most poikilohydric photosynthetic organisms can tolerate rapid drying. Biological activity during desiccation and recovery following drought are scarcely affected by protein synthesis inhibitors (Proctor and Smirnoff, 2000). Moderate drought tolerance is attained by increasing compatible solutes (amino acids, sugars, and sugar alcohols) as protective agents during drought stress (Mazur, 1968; Parker, 1968; Hoekstra et al., 2001). An increase in compatible solutes prevents water loss or increases water uptake from the air when humidity is high (Lange et al., 1988). It has been observed, however, that the intracellular solute concentration is low (corresponding to a sorbitol concentration of approximately 0.22 m) in the desiccation-tolerant terrestrial cyanobacterium Nostoc commune (Satoh et al., 2002; Hirai et al., 2004). N. commune photosynthetic activity is lost when incubated in low sorbitol concentrations (Hirai et al., 2004), whereas a Trebouxia spp. chlorobiont freshly isolated from the desiccation-tolerant chlorolichen Ramalina yasudae remains active under the same conditions (Kosugi et al., 2009).
Different solute concentrations in photobionts may dictate habitat preferences for chlorolichens and cyanolichens (James and Henssen, 1976; Lange et al., 1988). One might expect that the ideal cellular osmotic pressure (or cellular solute concentration) of a lichenized fungus is problematic, as both the fungus and the photobiont are closely associated in the thallus (Kranner et al., 2005). Thus, we may be able to further hypothesize that the solute concentration itself in original photobionts determines the nature of desiccation tolerance in chlorolichens and cyanolichens.
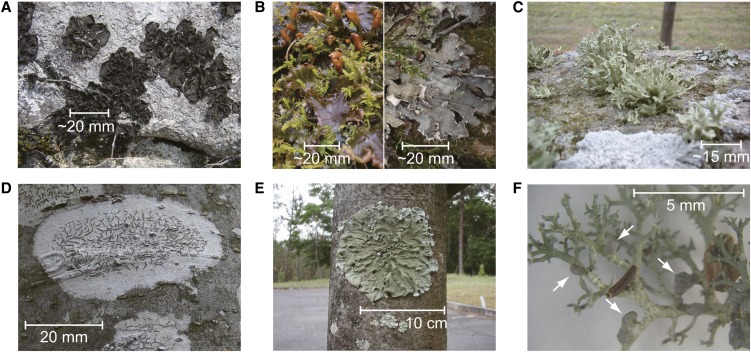
To better understand symbiosis in lichens, it is important to examine how the cellular osmotic pressures of both symbionts contribute to lichen photosynthesis. In this study, cellular osmotic pressures of lichens and photobionts were determined by assessing water potential. The cephalodia-possessing lichen Stereocaulon sorediiferum was chosen as a desiccation-tolerant model organism because it separately harbors a green alga and a cyanobacterium in different compartments of the lichen body. The green algal photobiont is contained in the stem- and branch-like structures, whereas the cyanobacterial photobiont (cyanobiont) is contained in the organism’s cephalodia. For comparison, several chlorolichens (R. yasudae, Parmotrema tinctorum, and Graphis spp.), cyanolichens (Collema subflaccidum and Peltigera degenii), green algae (Prasiola crispa, Trebouxia spp., and Trentepohlia aurea), and cyanobacteria (N. commune, Scytonema spp., and Stigonema spp.) were also analyzed (Fig. 1). The cyanobiont of C. subflaccidum is closely related to N. commune (Ahmadjian, 1993), and the cyanobiont of S. sorediiferum belongs to the genus Stigonema (Kurina and Vitousek, 1999). Green algal photobionts of R. yasudae and S. sorediiferum are Trebouxia spp. (Bergman and Huss-Danell, 1983). For the measurements of water potential, we had to use specimens larger than 0.1 g dry weight for one measurement. Furthermore, the specimens should cover approximately 70% of the surface area of a sample cup with 4 cm diameter that was equipped in our dewpoint potentiometer. Considering the statistical analyses, we needed large amounts of lichen and algal samples for the measurement of water potential. To conduct this study, we wanted to use free-living green algae and cyanobacteria, not the photobionts isolated from a lichen body. This is because inconsistent results were reported previously for chlorobionts liberated from lichens (Brock, 1975; Lange et al., 1990). Three major photobionts of lichens, Trebouxia, Trentepohlia, and Nostoc spp., were considered for inclusion. Until now, free-living Trebouxia spp. were not observed convincingly in nature. Therefore, cultivated Trebouxia spp. were used. Other green algae and cyanobacteria were chosen from among free-living species that (1) are closely related to some photobionts, (2) form large communities sufficient to cover the required quantity that will not destroy the local ecosystem by our sampling, (3) are easy to remove from other attached algae/microorganisms, and (4) are tolerant to desiccation. P. crispa forms large communities in nature, and the closely related species Prasiola borealis is known to be a photobiont of Mastodia tessellata. Only two freshwater species of genus Prasiola are found in Japan; P. crispa inhabits a limited area of Hokkaido Island, and Prasiola japonica is a rare species. P. crispa harvested in Antarctica and shown to be desiccation tolerant in our previous work (Kosugi et al., 2010b) was used in this study.
Figure 1.
Lichens analyzed in this study. A, Cyanolichen C. subflaccidum on a rock. B, Wet (left) and dry (right) thalli of cyanolichen Peltigera degenii with green moss. C, Chlorolichen R. yasudae on a rock. D, Chlorolichen Graphis spp. on a Zelkova serrata tree trunk. The grayish basal part of Graphis spp. is the site where the photobiont resides, and the dark-colored streaks are the apothecia. E, Chlorolichen Parmotrema tinctorum on a Z. serrata tree trunk. F, Cephalodia-possessing lichen S. sorediiferum. Some cephalodia are indicated by arrows. The stem- and branch-like structures are the green algae-containing compartments.
RESULTS
External Osmotic Pressure and Photosynthesis in Cyanolichens and Cyanobacteria
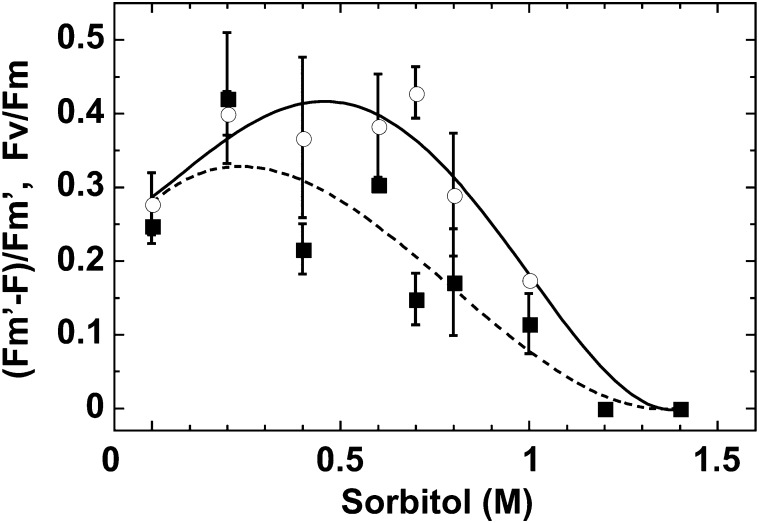
We wished to determine the effects of external osmotic pressure on cyanolichens and cyanobacteria when exposed to conditions that mimic naturally occurring dehydration. When the external osmotic pressure was increased by incubating the organisms in increasing sorbitol concentrations, changes in PSII reaction center activity and photosynthetic electron flow of the cyanolichen C. subflaccidum were observed (Fig. 2). PSII activity and photosynthetic electron flow activity are expressed as Fv/Fm and [Fm′ − F]/Fm′, respectively (Genty et al., 1989; Krause and Weis, 1991). Fv is the variable part of chlorophyll fluorescence determined by the difference between the maximum (Fm) and minimum (Fo) chlorophyll fluorescence in dark-adapted conditions (Fv = Fm – Fo). Fm′ and F are the maximum and steady-state levels of chlorophyll fluorescence under actinic light. [Fm′ − F]/Fm′ is an effective quantum yield of PSII in the light, and the product of irradiance and effective quantum yield equals relative electron flow. Therefore, here we used [Fm′ − F]/Fm′ to evaluate photosynthetic electron flow activity. Photosynthetic electron flow activity increased with increasing sorbitol concentrations. However, a decrease was observed at 0.5 m sorbitol, eventually reaching zero at 1.25 m sorbitol (Fig. 2; Table I, column 4). PSII activity began to decrease at a slightly higher sorbitol concentration (0.75 m). This is similar to the pattern exhibited by the free-living terrestrial cyanobacterium N. commune, in which both values reached zero at 1 m sorbitol (Hirai et al., 2004). A concomitant decrease in Fv/Fm (maximum photochemical efficiency of PSII in the dark-adapted state) and [Fm′ − F]/Fm′ was also observed when C. subflaccidum was air dried (Table I, column 3). Similar changes were noted for N. commune (Table I, column 3).
Figure 2.
Effects of a hypertonic environment on PSII and photosynthetic electron flow in C. subflaccidum. The thallus was incubated in different sorbitol concentrations for 30 min, after which PSII activity (Fv/Fm, circles and solid line) and photosynthetic electron flow ([Fm′ − F]/Fm′, squares and dashed line) were measured. The intensity of the actinic light was 50 μmol photons m−2 s−1.
Table I. Summary of cellular solute concentrations and responses to desiccation in lichens, green algae, and cyanobacteria.
O, observed; Δ, partially observed; X, not observed; n.d., not determined. Trebouxia spp. was a cultured strain. A value was not obtained for the chlorolichen Graphis spp. because the thallus could not be detached from its substrate without disintegration. Only cellular solute concentration was assessed for Parmotrema tinctorum and Peltigera degenii in this work. Cellular solute concentration values are m ± se (n = 3–4). Data from previous reports are used with permission from the individual publishers (footnotes b, h, and, i from Oxford University Press; footnote g from Wiley).
| Species | 1 |
2 |
3 |
4 |
5 |
6 |
7 |
|---|---|---|---|---|---|---|---|
| Cellular Solute Concentrationa | Recovery from Air Drying | Concomitant Decrease in Fv/Fm with [Fm′ − F]/Fm′ upon Air Drying | Inhibition of Fv/Fm and [Fm′ − F]/Fm′ in 1.5 m Sorbitol Solution | Sites of Chlorophyll Fluorescence Quenching under Dry State | P700 Photooxidation under Dry State | Inhibition of Rereduction of Photo-oxidized P700 under Dry State | |
| Lichens | |||||||
| Chlorolichen | |||||||
| R. yasudae | 0.85 ± 0.078 | O | Ob | Xb | PSI and PSIIb | Ob | Ob |
| Graphis spp. | n.d. | O | n.d. | Xc | PSIId | Oe | Oe |
| Parmotrema tinctorum | 0.93 ± 0.077 | n.d. | n.d. | n.d. | n.d. | n.d. | n.d. |
| S. sorediiferum | 0.85 ± 0.129 | O | n.d. | X | PSII | n.d. | n.d. |
| Green algae-containing compartments | |||||||
| Cyanobacterial compartment (Cephalodium) | 0.49 ± 0.039 | O | n.d. | O | PSI, PSII, and PBS | Δ (slow and small)e | Oe |
| Cyanolichen | |||||||
| Peltigera degenii | 0.57 ± 0.024 | n.d. | n.d. | n.d. | n.d. | n.d. | n.d. |
| C. subflaccidum | 0.44 ± 0.024 | O | Of | O | PSI, PSII, and PBS | Δ (slow and small) | O |
| Green algae and cyanobacteria | |||||||
| Green algae | |||||||
| Trebouxia sp. | 0.63 ± 0.006 | O | Δb | Xb | PSIIb | n.d. | n.d. |
| Trentepohlia aurea | 0.77 ± 0.143 | O | Of | Xc | PSIId | Oe | Oe |
| Prasiola crispa | 0.69 ± 0.025 | Og | n.d. | Xg | PSIIg | Og | Og |
| Cyanobacteria | |||||||
| N. commune | 0.23 ± 0.039 | Oh | Of | Oi | PSI, PSII, and PBSh | Xi | Oi |
| Scytonema spp. | 0.33 ± 0.035 | n.d. | n.d. | n.d. | n.d. | n.d. | n.d. |
| Stigonema spp. | 0.43 ± 0.018 | n.d. | n.d. | n.d. | n.d. | n.d. | n.d. |
Expressed by the molar concentration equivalent to the ideal sorbitol concentration calculated as in Figure 6. bData from a previous report (Kosugi et al., 2009). cSupplemental Figure S1. dSupplemental Figure S2. eSupplemental Figure S3. fSupplemental Figure S4. gData from a previous report (Kosugi et al., 2010b). hData from a previous report (Satoh et al., 2002). iData from a previous report (Hirai et al., 2004).
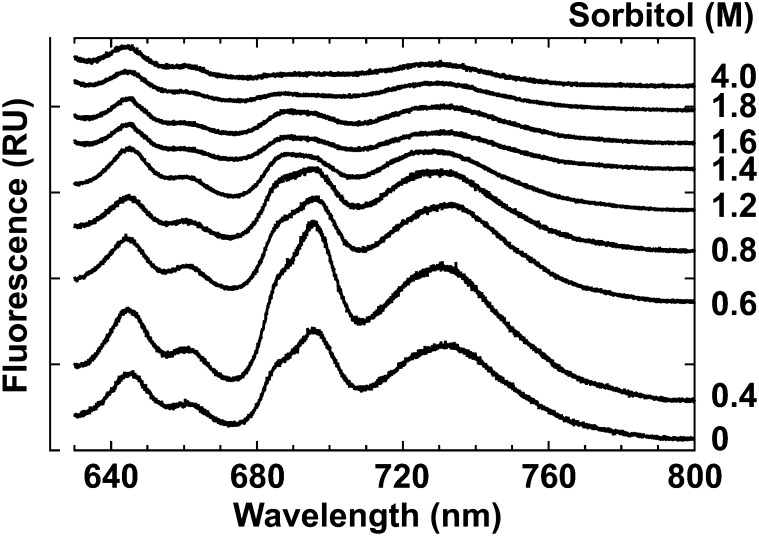
The fluorescence emission spectra of C. subflaccidum at 77 K were influenced by sorbitol concentrations (Fig. 3). PSII fluorescence (695 nm), PSI fluorescence (730 nm), and phycobiliprotein fluorescence (645, 660, and 685 nm) increased when sorbitol was increased to 0.4 m, yet fluorescence decreased when sorbitol reached concentrations greater than 0.4 m (Fig. 3). All fluorescence (except 645 nm) became almost negligible at sorbitol concentrations greater than 1.8 m (Fig. 3). This result is consistent with that of N. commune (Hirai et al., 2004). Similarly, fluorescence emissions for air-dried N. commune and C. subflaccidum were negligible, and PSII fluorescence was considerably more quenched than PSI or phycobiliprotein fluorescence (Table I, column 5).
Figure 3.
Effects of a hypertonic environment on fluorescence emission spectra in C. subflaccidum. The thallus was incubated in different sorbitol concentrations for 30 min, and fluorescence emission spectra were measured at 77 K. RU, Relative units.
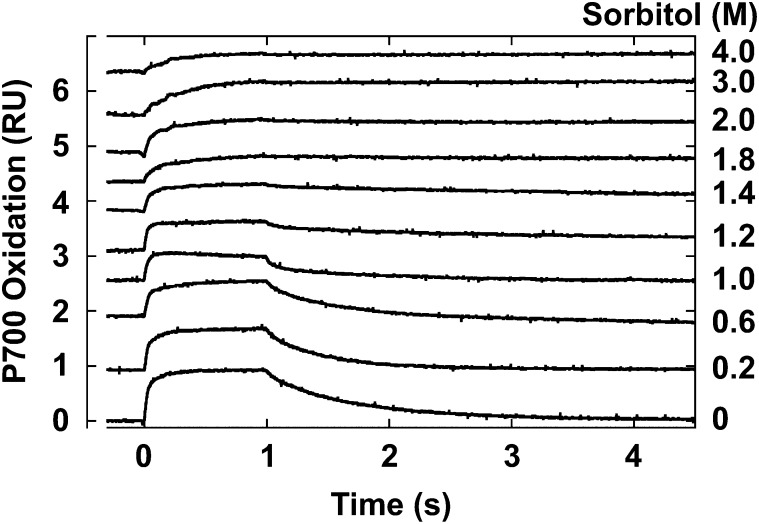
P700 is the chlorophyll dimer reaction center of PSI. Light-induced redox changes of P700 in C. subflaccidum in the presence of 3-(3,4-dichlorophenyl)-1,1-dimethyl urea (DCMU) accorded well with changes in PSII-related activity and fluorescence emission when the sorbitol concentration was increased (Fig. 4). Photooxidation and rereduction of P700 appeared normal if C. subflaccidum was incubated in 0.2 m sorbitol. The rereduction rate of photooxidized P700 decreased markedly at sorbitol concentrations greater than 1 m, while the photooxidation rate decreased at 1.4 m sorbitol, and it was greatly decreased at 3 m sorbitol.
Figure 4.
Effects of a hypertonic environment on P700 redox changes in C. subflaccidum. The thallus was incubated in various sorbitol concentrations for 12 h in the dark with 50 μm DCMU, and light-induced redox changes of P700 were measured. Illumination time was 1 s. RU, Relative units.
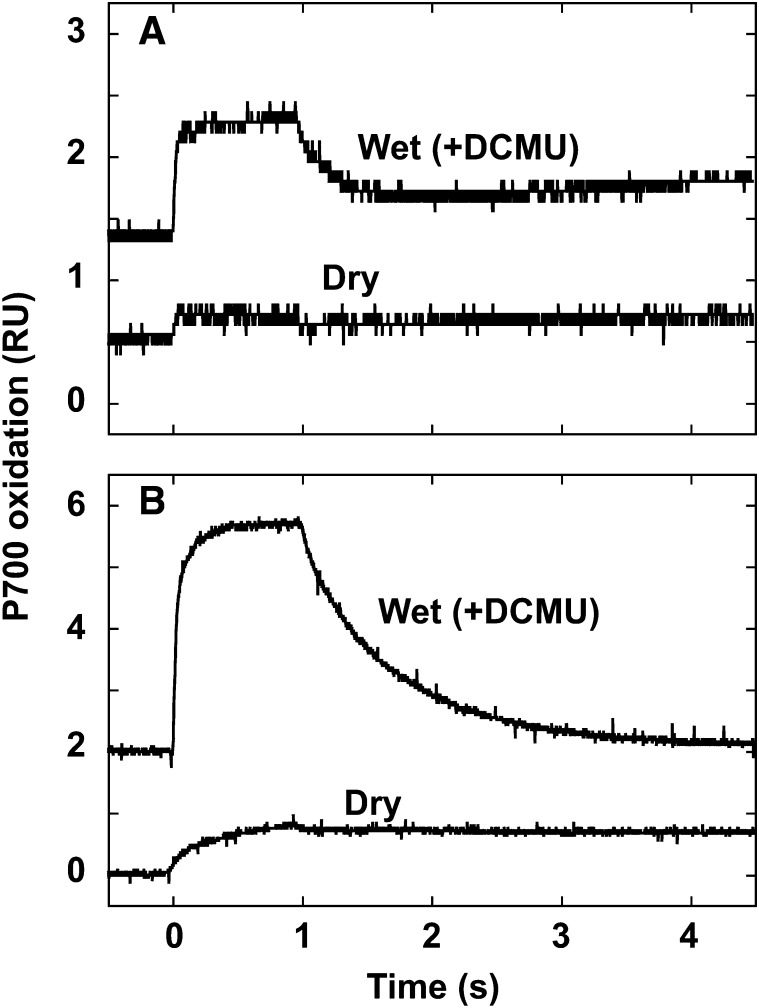
The rereduction of P700 is also caused by cyclic electron flow. A rapid rereduction of P700 was observed in the presence of DCMU in wet N. commune (Fig. 5A) and C. subflaccidum (Fig. 5B), indicating that cyclic electron transport activity was active. Complete inhibition of rereduction in air-dried N. commune (Fig. 5A) and C. subflaccidum (Fig. 5B) indicated that cyclic electron flow, in addition to PSII activity, contributed to the rereduction of P700 under wet conditions. This change in the oxidation-reduction kinetics of P700 (Fig. 5) corresponds well with changes in the light-induced redox change of P700 observed with increasing sorbitol concentrations (Fig. 4), in which photooxidation of P700 was observed in C. subflaccidum under high sorbitol concentrations, as well as for dry chlorolichens (Kosugi et al., 2009). Levels of photooxidized P700 in C. subflaccidum under air-dried and high-sorbitol conditions corresponded with the inhibited photooxidation of P700 in air-dried N. commune (Fig. 5A; Table I, columns 6 and 7).
Figure 5.
Light-induced P700 redox changes in N. commune (A) and C. subflaccidum (B) upon desiccation. Light-induced redox changes of P700 were measured in dry samples and in those rewetted with 50 μm DCMU. Illumination time was 1 s. RU, Relative units.
Cellular Osmotic Pressure in Cyanolichen/Cyanobacteria and Chlorolichen/Green Algae
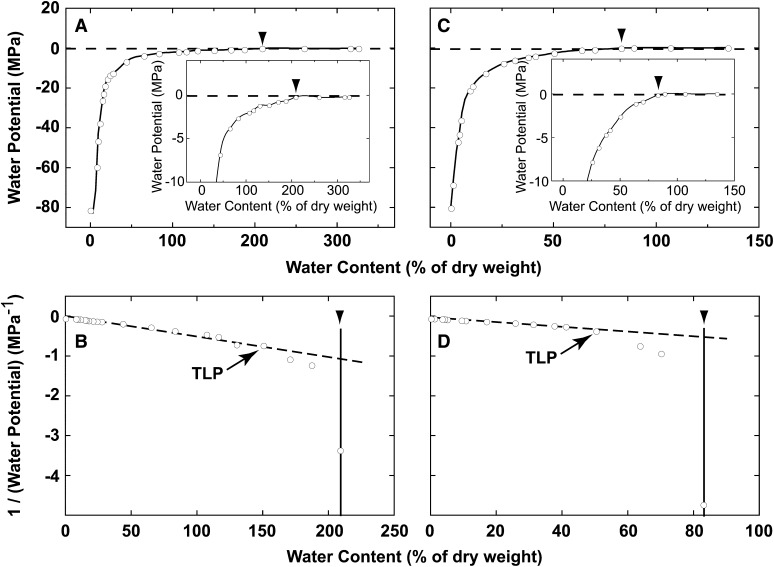
Our data indicated that external osmotic pressure affected photosynthesis in C. subflaccidum and N. commune. However, the sorbitol concentration at which PSII and electron transport activity started to decrease in C. subflaccidum was lower than reported previously for the chlorolichen R. yasudae and its isolated photobiont Trebouxia spp. (Kosugi et al., 2009). To address this discrepancy, we determined the cellular osmotic pressure in fully rehydrated cyanolichen/cyanobacteria and chlorolichen/green algae by measuring water potential during the process of air drying. The water potential started to decrease at a water content of approximately 200% (w/w) in C. subflaccidum (−0.24 MPa; Fig. 6, A, inset, and B).
Figure 6.
Changes in water potential during dehydration of C. subflaccidum (A and B) and R. yasudae (C and D). Reciprocals of calculated ideal water potential values were plotted against the relative amount of water remaining in the colonies (B and D). Arrowheads indicate the initiation of the decrease in water potential. TLP, Turgor loss point (estimated according to the graph).
The ideal water potential was mathematically calculated as described in “Materials and Methods” using the fitting curve depicted in Figure 7. Reciprocal water potential values are plotted against water content for C. subflaccidum (Fig. 6B). The osmotic potential from the extension of the linear regression corresponding to the water content at the initiation of the water potential decrease is calculated at −1.01 (−1/0.99) MPa. The ideal sorbitol concentration that produces this water potential corresponds to 0.44 m (C. subflaccidum; Table I, column 1). This is substantially higher than the solute concentration inside N. commune cells, which is approximately 0.23 m sorbitol (Table I, column 1). The water potential in R. yasudae cells started to decrease with lower water content (80% [w/w]; Figure 6, C and D). The osmotic potential read from the extension of the linear regression of the reciprocal values for ideal water potential was −1.67 (−1/0.60) MPa. The ideal sorbitol concentration corresponding to this water potential was 0.85 m (Table I, column 1).
Figure 7.
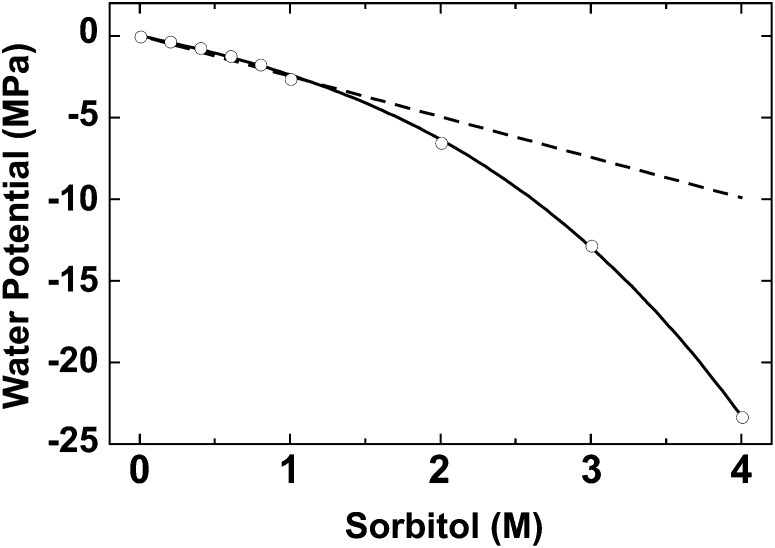
Water potential as a function of sorbitol concentration. Water potential was measured at different sorbitol concentrations. The dashed line represents the dependency of water potential on solute concentration in an ideal solution (iΨ= RTx, where x is the sorbitol concentration and Ψ is the water potential [Eq. 6]).
Ideal solute concentrations equivalent to cellular osmotic pressures under fully hydrated conditions were estimated in Figure 6 and are summarized in Table I (column 1) for lichens, green algae, and cyanobacteria. Interestingly, cellular solute concentrations were similar between some specimens of the same species, despite being harvested from naturally grown colonies at different times. Cellular solute concentrations were lower in cyanolichens (0.505 ± 0.092 m) and cyanobacteria (0.330 ± 0.100 m) than in chlorolichens (0.890 ± 0.056 m) or green algae (0.697 ± 0.070 m).
Photosynthesis and Cellular Osmotic Pressure in a Cephalodia-Possessing Lichen
Because we found a marked difference in cellular osmotic pressures between green algae/chlorolichens and cyanobacteria/cyanolichens, we investigated the importance of cellular osmotic pressure in the cephalodia-possessing lichen S. sorediiferum. It harbors a photobiont green alga in its stem- and branch-like structures and a photobiont cyanobacterium within its cephalodia (Fig. 1F).
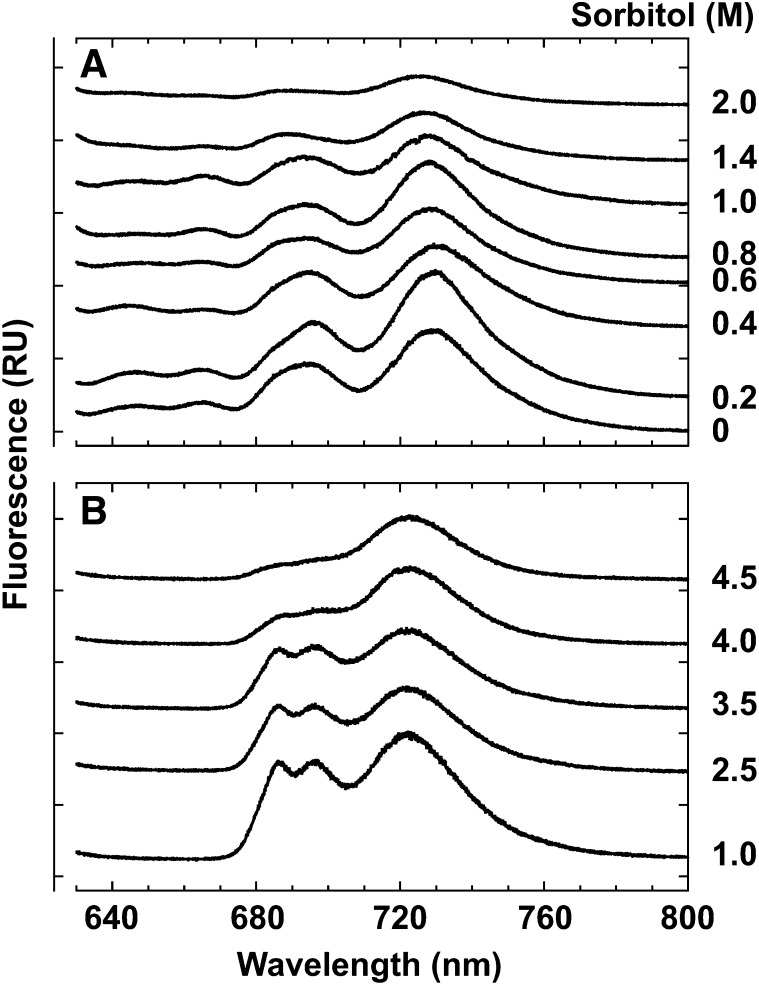
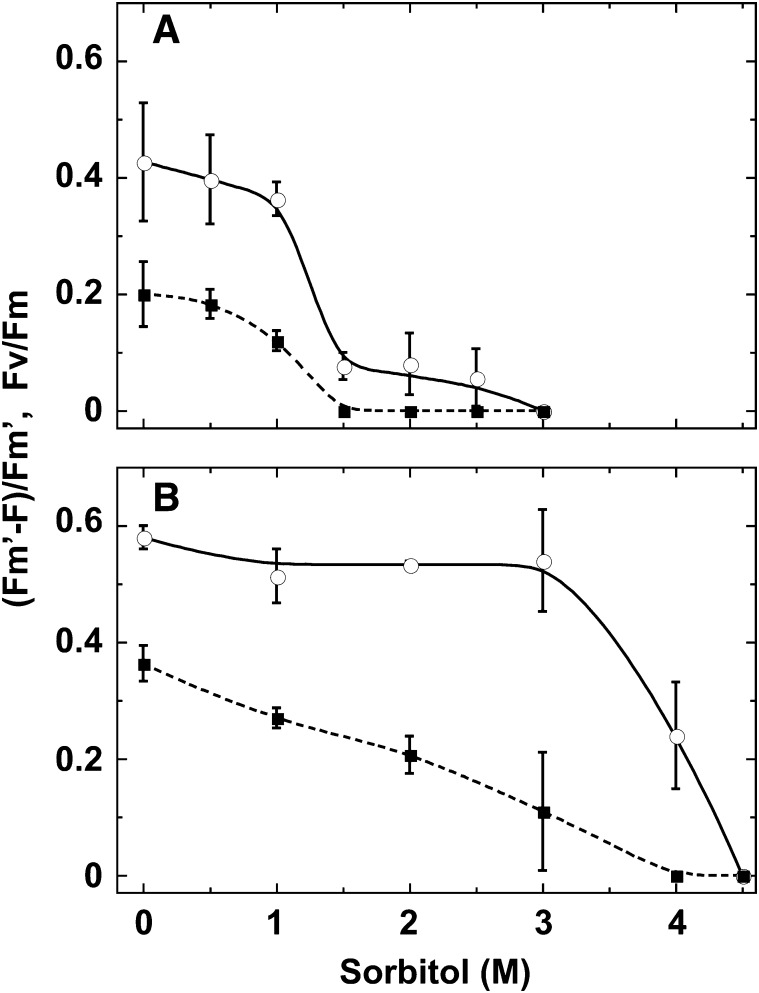
Changes in fluorescence emission spectra at 77 K in S. sorediiferum cephalodia were observed in response to changes in sorbitol concentration (Fig. 8A). In a low sorbitol concentration that mimics wet conditions, cephalodia emitted cyanobacteria-specific phycobiliprotein fluorescence at 645, 665, and 685 nm. Fluorescence from PSI and PSII core complexes was observed peaking at approximately 730 and 685/695 nm, respectively. As with C. subflaccidum and N. commune, fluorescence was high at 0.2 m sorbitol but decreased at higher sorbitol concentrations. At sorbitol concentrations greater than 1.4 m, we observed that fluorescence from phycobiliprotein and PSII core complexes in the cephalodia (cyanobacteria-containing compartment) was low. However, PSI fluorescence remained high and its peak shifted from 730 to 722 nm. This may be attributed to contaminating soredia attached to the surface of the cephalodia that contain green algal cells. [Fm′ − F]/Fm′ values remained steady until the sorbitol concentration reached 0.5 m, after which they decreased gradually to zero at a sorbitol concentration of 1.5 m (Fig. 9A). Fv/Fm values paralleled these results.
Figure 8.
Effects of a hypertonic environment on fluorescence emission spectra at 77 K in cephalodia (A) and green algae-containing compartments (B) of S. sorediiferum. Samples were incubated in different sorbitol concentrations for 30 min (cephalodia) or 1 h (green algae-containing compartments), and fluorescence emission spectra were measured at 77 K. RU, Relative units.
Figure 9.
Effects of a hypertonic environment on PSII and photosynthetic electron flow in cephalodia (A) and green algae-containing compartments (B) of S. sorediiferum. Samples were incubated in different sorbitol concentrations for 30 min (cephalodia) or 1 h (green algae-containing compartments), and PSII activity (Fv/Fm, circles and solid line) and photosynthetic electron flow ([Fm′ − F]/Fm′, squares and dotted line) were measured.
The green algae-containing compartment of S. sorediiferum did not emit phycobiliprotein fluorescence, but PSI and PSII fluorescence was emitted at approximately 722 nm and 685/695 nm, respectively (Fig. 8B). PSI and PSII fluorescence remained similar until the sorbitol concentration reached 3.5 m. At 4 m sorbitol, PSII fluorescence decreased greatly while PSI fluorescence remained high (Fig. 8B). [Fm′ − F]/Fm′ values for the green algae-containing compartments of S. sorediiferum decreased gradually as the sorbitol concentration increased, reaching zero at 4 m sorbitol (Fig. 9B, squares). Fv/Fm values remained nearly constant until the sorbitol concentration reached 3 m and became zero at 4.5 m sorbitol (Fig. 9B, circles). This was markedly higher than the sorbitol concentration observed for cephalodia (4.5 m versus 1.5 m).
Because the sorbitol concentrations at which the intensity of 77K fluorescence and Fv/Fm and [Fm′ − F]/Fm′ started to decrease were markedly different between cephalodia and green algae-containing compartments of S. sorediiferum, we determined the cellular osmotic pressure in their fully rehydrated form. The cellular solute concentration of cephalodia under hydrated conditions was equivalent to a sorbitol concentration of 0.49 m. This was lower than the cellular solute concentration in the green algae-containing compartments (0.85 m sorbitol; Table I, column 1).
Relative Mass Contribution of Both Symbionts in a Cephalodia-Possessing Lichen
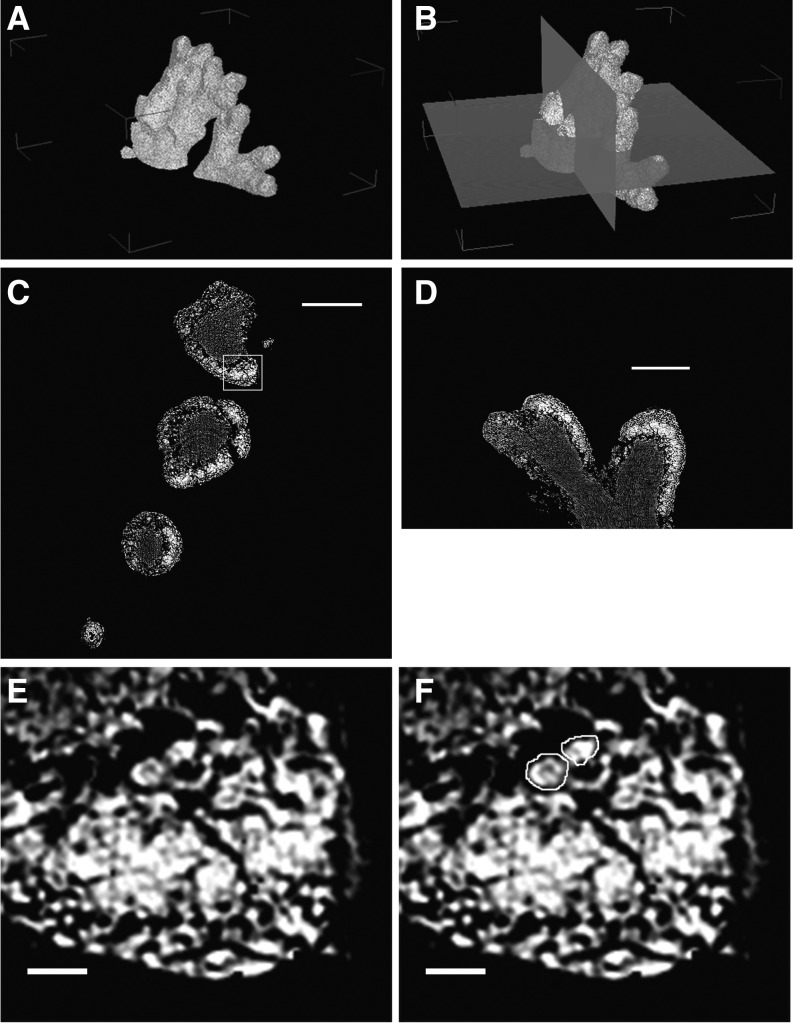
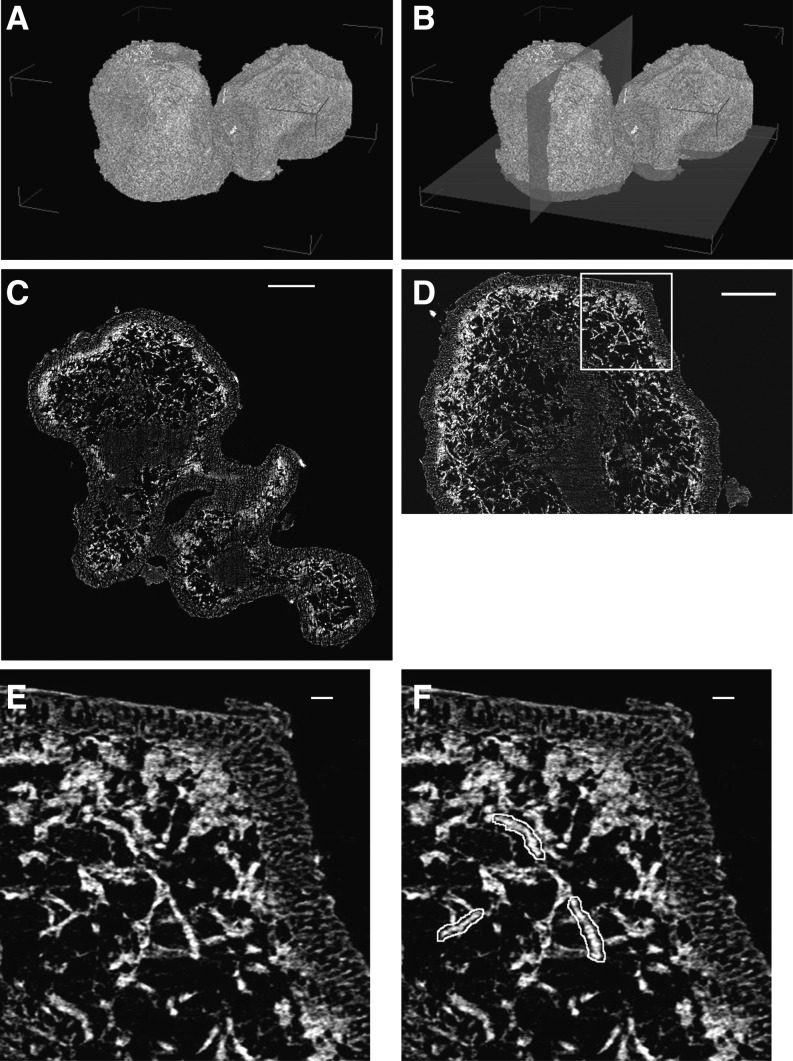
To better understand the contribution of each symbiont in establishing cellular solute concentrations, the relative mass contribution of both S. sorediiferum symbionts was determined with micro x-ray computed tomography (micro-CT). Osmium tetroxide-stained green algae-containing compartments and phosphotungstic acid-stained cephalodia were used for micro-CT analysis. Examples of the resulting reconstructed x-ray two-dimensional (2-D) tomographic slices are shown in Figures 10 (green algae-containing compartments) and 11 (cephalodia). Three-dimensional (3-D) structures were constructed with 900 2-D tomographic slices. The 3-D structures indicated that the central clumps in Figures 10 and 11 were occupied by fungal filaments only, and these were present in high density in both the S. sorediiferum green algae-containing compartments and cephalodia. In addition, the cephalodia were surrounded by a cortex of high-density fungal filaments (Fig. 11, C–E); this corresponded to the hard shell of each cephalodium. Cyanobacterial cells exhibited a beaded appearance, and they were embedded in fungal filaments within the space between the central clumps and the surrounding hard shell (Fig. 11F). Relatively large spaces that did not contain any structures or cells stainable by osmium tetroxide or phosphotungstic acid were observed around the central clumps. The green algae-containing compartments of S. sorediiferum lacked the hard shell-like structure (Fig. 10, C–E). This supports our observations that the green algae-containing compartments had a crumbly texture, and vast empty spaces were located around the central clumps in the cephalodia. In addition, green algal cells were embedded in the fungal filaments that surrounded the central clumps.
Figure 10.
X-ray refraction contrast images of green algae-containing compartments in S. sorediiferum. A, Constructed 3-D structure. B, Constructed 3-D structure with two orthogonal planes that correspond to C and D. C, 2-D slice image corresponding to the x-y plane in B. D, 2-D slice image corresponding to the y-z plane in B. E, Enlarged image of the box in C. F, Same as E, indicating examples of green algal cell images. High-resolution images of C, D, and E are available as Supplemental Figure S5. Bars = 100 µm in C and D and 10 µm in E and F.
Figure 11.
X-ray refraction contrast images of a cephalodium in S. sorediiferum. A, Constructed 3-D structure. B, Constructed 3-D structure with two orthogonal planes that correspond to C and F. C, 2-D slice image corresponding to the x-y plane in B. D, 2-D slice image corresponding to the y-z plane in B. E, Enlarged image of the box in D. F, Same as E, indicating examples of cyanobacterial cell images. High-resolution images of C, D, and E are available as Supplemental Figure S6. Bars = 100 µm in C and D and 10 µm in E and F.
We used 3-D structures (900 slice images, equivalent to 450 µm) to compare the relative mass contribution of photobionts from the whole green algae-containing compartments and the cyanobacteria-containing cephalodia. Because the size of the structure to be analyzed by this method is limited, 1-mm sections of green algae-containing compartments and cephalodia were examined. Relatively small branches of green algae-containing compartments located apart from the basal portion were used, where the relative mass contribution of the medulla comprising fungal filaments is small. Within the green algae-containing compartments situated near the basal portion, the relative mass contribution of the medulla increases and that of the green-algal cells decreases.
The 3-D image of the green algae-containing compartments was separated into three arbitrary parts, and the mean relative contribution of green algal cells was 10.4% (range, 9.27−11.8%; Table II). The lower slice number corresponds to the part farthest from the stem. Cephalodia were separated into four arbitrary parts. The mean relative contribution of cyanobacterial cells was larger than that of the green algae-containing compartments at 17% (range, 12.3−19%; Table II).
Table II. Relative mass contribution of symbionts in S. sorediiferum.
Volumes of fungi and photobionts were calculated using constructed 3-D structures derived from x-ray refraction contrast images. Because of the file size, the structures were arbitrarily separated into three (green algae-containing compartments) or four (cephalodia) parts. The smaller slice number represents the region closest to the stem in the green algae-containing compartments.
| Part | Slice No. | Volume of Fungi Cells | Volume of Photobiont Cells | Ratio of Photobiont Cells |
|---|---|---|---|---|
| µm3 | µm3 | % | ||
| Green algae- containing compartments | 0_299 | 2,049,399 | 209,395.6 | 9.27 |
| 300_599 | 3,756,117 | 387,677.5 | 9.36 | |
| 600_900 | 4,362,145 | 583,441.3 | 11.8 | |
| Total | 10,167,661 | 1,180,514 | 10.4 | |
| 11,348,175 (sum) | ||||
| Cephalodia | 0_449 | 23,229,514 | 5,433,781 | 19.0 |
| 450_599 | 10,175,722 | 1,977,306 | 16.3 | |
| 600_749 | 8,147,873 | 1,702,853 | 17.3 | |
| 750_900 | 9,310,747 | 1,305,469 | 12.3 | |
| Total | 50,863,856 | 10,419,408 | 17.0 | |
| 61,283,264 (sum) | ||||
DISCUSSION
We recently reported a common physiological profile in desiccation-tolerant photosynthetic organisms such as N. commune (Satoh et al., 2002; Hirai et al., 2004), some bryophytes (Nabe et al., 2007), and chlorolichens (Kosugi et al., 2009). First, PSII activity is lost following the loss of photosynthesis. Second, light energies absorbed by PSII complexes are effectively dissipated to heat and then detected as fluorescence quenching. Third, the back reaction within PSI and the cyclic electron flow around PSI are inhibited under drying conditions in the dark. This signifies that oxidized P700 (P700+) cannot be rereduced when the organism is exposed to dry/light conditions. Together, these features are important for avoiding photoinhibition under drying conditions in desiccation-tolerant N. commune (Fukuda et al., 2008).
PSII fluorescence quenching in response to desiccation has been reported previously for chlorolichens (Sigfridsson and Öquist, 1980; Lange et al., 2001) and desiccation-tolerant bryophytes (Heber et al., 2000). Our data confirm that this phenomenon applies to desiccation-tolerant cyanolichens, chlorolichens, and green algae, which is consistent with the report by Lange et al. (1989). The mechanism by which fluorescence is quenched during desiccation has been examined previously (Komura et al., 2006, 2010; Veerman et al., 2007; Miyake et al., 2011; Kosugi et al., 2013). Meanwhile, the mechanism underlying the inability to rereduce P700+ under dry/light conditions in desiccation-tolerant photosynthetic organisms is not well understood. This inability is most likely not caused by inhibition of the PSI reaction center itself. Rather, it is plausible that it may occur via the inhibition of electron transport in the absence of water, since diffusion of soluble electron carriers such as plastocyanin is impossible when the appropriate medium is missing. Therefore, the charge separation of P700 could be optimized to naturally occur when light energy is delivered to the PSI reaction center. As such, the antenna system of PSI in drought-tolerant organisms could transfer light energy even under or after dry/light conditions. Because the redox potential of P700 is much lower than that of P680 in the PSII reaction center (Kato et al., 2009; Nakamura et al., 2011), the formation of reactive oxygen species and the chlorophyll triplet state are not as prominent in PSI. Thus, the long-lived oxidized form of P700 may be less harmful to surrounding microenvironments. The apparent absence of a prominent fluorescence quencher in PSI that would work as an acceptor for excess light energy at ambient temperatures supports this idea. Indeed, P700+ is an efficient quencher for singlet excited states (Nuijs et al., 1986; Weis et al., 1989, 1990).
The previously reported physiological responses to desiccation described above appear similar in the desiccation-tolerant organisms examined in this work. However, we found a prominent difference in cellular solute concentrations between the chlorolichen and the cyanolichen. The cellular solute concentration under fully hydrated conditions was estimated using an extrapolated water potential value based on the physical linear relationship between osmotic potential and solute concentration (Proctor et al., 1998; Hirai et al., 2004). Ideally, the water potential decreases linearly when solute concentration is increased. However, the change in water potential observed when [sorbitol] increased was not ideal; we noted a reduction rate in water potential that surpassed the increase in [sorbitol] (convex upward curve in Fig. 7).
The water potential of a dilute solution is expressed by the following formula:
 |
(1) |
where Ψ is the water potential, R is a gas constant, T is absolute temperature, aw is the activity of water, γw is the activity constant of water, Nw is the relative partial molar concentration of water, Vw is the partial molar volume of water, and Ψp and Ψg are the pressure and gravitational potentials, respectively. Here, Ψg can be ignored in a small lichen body. The value of Ψp equals that of the water potential at turgor loss point. Because Ψp is present, the lines shown in Figure 6, B and D, leave from the linear relationship between the reciprocal of the water potential and the volume of water per solute (relative water content) at a higher water content value.
The molar concentration of pure water is 55.5 m. At this concentration, γw = 1, and the same should hold true for an ideal dilute solution. However, γw varies in nonideal liquid solutions where solute concentration is high or when solute/solvent molecules interact. A highly concentrated sorbitol solution is a nonideal liquid that results in a nonlinear change in the water potential when [sorbitol] is increased (Fig. 7). A similar scenario may be applied to the actual water potential of cells. Cells contain many solutes other than sorbitol that may differentially affect γw. Nonetheless, it is useful to use sorbitol as a model for cellular solute concentration that is extrapolated from measured water potential to compare cellular osmotic pressures. In this work, we mathematically corrected the sorbitol concentration to that of an ideal solute.
The cellular solute concentration under hydrated conditions was lower in the cyanolichen (sorbitol equivalent of 0.6 m) than in the chlorolichen (sorbitol equivalent of 0.9 m). Our data and those of Kosugi et al. (2009) suggest that differences in intracellular solute concentrations are consistent with changes in photosynthesis-related characteristics caused by increasing sorbitol concentrations. The approach used to obtain such findings has been reported previously (Proctor et al., 1998; Hirai et al., 2004). The low osmotic pressure of cyanolichens may be one reason why cyanolichens need water in a liquid state for biological activity (Lange et al., 1986, 2001; Nash et al., 1990; Ahmadjian, 1993). With a low cellular osmotic pressure, cells are unable to take up water from the air even in very humid conditions.
It has been suggested previously that high cellular solute concentrations in chlorolichens serve as resistance to experimentally high sorbitol concentrations (Kosugi et al., 2009). This partly explains the observation that chlorolichens can grow when relative humidity is over 85% (equivalent to a water potential of −21.9 MPa) and, in general, inhabit drier areas than cyanolichens; the latter require water in a liquid state for growth (Nash et al., 1990; Lange et al., 2001). The sorbitol concentration that corresponds to the water potential at a relative humidity of 85% is approximately 4 m. This is in agreement with the sorbitol concentration at which photosynthetic properties in the green algae-containing compartment of S. sorediiferum were apparently suppressed in this study. It is also possible that chlorolichens take up water from the air under highly humid conditions because of the presence of green algal cell walls. To test the hypothesis that higher cellular solute concentrations are responsible for resistance to external high osmotic pressure and, therefore, resistance to dehydration, other lichens should be examined in future studies.
A similar difference in cellular solute concentrations was observed between free-living cyanobacteria and free-living green algae (Table I, column 1). The average corresponding sorbitol concentrations were 0.333 ± 0.080 and 0.830 ± 0.135 m, respectively. We observed that cultured Trebouxia spp. had a lower solute concentration (corresponding to 0.63 m sorbitol) than R. yasudae (corresponding to 0.85 m sorbitol), and this concurs with the data reported by Kosugi et al. (2009; 1 m sorbitol). This may be due to green algae culture conditions, as water was present throughout its cultivation. Under these conditions, [Fm′ − F]/Fm′ decreased at lower sorbitol concentrations (Kosugi et al., 2009).
Mycobionts occupy a large volume of the lichen body, and the photobiont constitutes only 3.4% of the lichen biomass (Kranner et al., 2005). Our data indicate that the relative mass contribution of green algal cells and cyanobacterial cells was 10.4% and 17% in green algae-containing compartments and cyanobacteria-containing cephalodia, respectively. Therefore, we hypothesize that the cellular solute concentration calculated for S. sorediiferum was that of the mycobiont. However, the influences of external [sorbitol] on fluorescence emission in photobionts and the whole thallus are comparable (Kosugi et al., 2009). Together, these data support the idea that photobiont cellular solute concentrations may not differ significantly from those of the thallus.
The cellular osmolarity of lichen thalli can be reasonably assumed to be identical to that of photobionts, since the changes in photosynthesis of lichen and liberated chlorobionts due to the change in water potential accorded very well (Lange et al., 1990). It is evident that photobionts retain the cellular osmolarity of free-living cells even in a lichenized state. Similarly, differing responses of green algae and cyanobacteria to water vapor and carbon isotope discrimination are retained in chlorolichens and cyanolichens (Lange et al., 1988). Although differences in carbon discrimination have been previously discussed at length (Lange et al., 1988), we suggest that cellular osmolarity can explain this phenomenon. We hypothesized that lichenized fungi adjust their cellular osmolarity to that of their symbiotic phototroph. This mechanism is similar to that suggested by Brock (1975), that the stored carbohydrate in the mycobionts may increase internal osmotic pressure to provide moisture to its chlorobionts under hydrated conditions, although the result itself shown by Brock (1975) was not substantiated (Lange et al., 1990). The cephalodia-carrying lichen, S. sorediiferum, was an ideal model organism to test our theory. The cephalodia response to dehydration is similar to that of cyanolichens (Figs. 2 and 3) and terrestrial cyanobacteria (Satoh et al., 2002). The response observed for the green algae-containing compartments of S. sorediiferum was similar to that of previously studied chlorolichens (Kosugi et al., 2009), the aerial green alga T. aurea, and cultured Trebouxia spp. The cellular solute concentration in S. sorediiferum cephalodia was lower than that of the green algae-containing compartments of the same thallus. Thus, the hypothesis that lichen mycobionts adjust their osmotic pressure to that of their photobiont counterparts is supported by our observation that both green algal cells and cyanobacterial cells have close contact with fungal cells in S. sorediiferum.
How two different solute concentrations in the same lichen body are established is an interesting and puzzling question. It could be that morphological differences in cephalodia and green algae-containing compartments underlie this mechanism. The cephalodium is covered by dense fungal cells, and it allows for a small surface area-to-volume ratio. Both may be effective in maintaining higher water potential. Further studies are needed to clarify this conundrum.
CONCLUSION
Photobionts retain the physiological properties of free-living cells even in a lichenized state. For this to occur, mycobionts may adjust their cellular solute concentrations to match those of chlorobionts or cyanobionts. The hypothesis that lichenized fungi create a suitable barrier and habitat for their symbiotic algae to ensure desiccation tolerance challenges the conventional commensalistic view. It is supported by other studies demonstrating that mycobiont-provided arabitol enhances the photoprotection ability of a photobiont under desiccation conditions (Kosugi et al., 2013) and that photobiont tolerance to desiccation/high-light conditions within the lichen body is greater than that of freshly isolated photobionts (Kosugi et al., 2009, 2010a). Furthermore, these results provide fuel for a long-standing debate over why chlorolichens are able to recover and reactivate photosynthetic activity after exposure to highly humid conditions yet cyanolichens are incapable of this feat.
MATERIALS AND METHODS
Biological Material
Ramalina yasudae, Graphis spp., Parmotrema tinctorum, Collema subflaccidum, Scytonema spp., Stigonema spp., Trentepohlia aurea, and Nostoc commune were collected on and around the Harima Campus for Science of the University of Hyogo in Hyogo Prefecture, Japan (35°55′N, 134°26′E). Stereocaulon sorediiferum and Peltigera degenii were collected in Shiso, Hyogo Prefecture, Japan (35°30′N, 134°31′E). The Trebouxia spp. was isolated from R. yasudae by Toshikazu Takahagi and cultivated in malt extract-yeast extract medium containing 2% agar at 25°C in the dark as described previously (Ahmadjian, 1993). Colonies of the terrestrial green alga Prasiola crispa were collected from the Yotsuike Dani gully (69°15′S, 39°45′E), Langhovde, Sôya Coast, Antarctica (Kosugi et al., 2010b).
Dehydration and Rehydration Conditions
Samples were dried at 25°C in the dark for one night in ambient air (humidity, 61%). To achieve identical conditions and states for every sample, collected samples were wetted with NANOpure water (NANOpure; Thermo Fisher Scientific) for 30 min before air drying. Alternatively, samples were subjected to hypertonic treatment by incubation in NANOpure water containing various concentrations of sorbitol until activities reached steady-state levels, for more than 2 h (R. yasudae and Trebouxia spp.), 1 h (Graphis spp., T. aurea, and the green algal part of S. sorediiferum), 30 min (C. subflaccidum and S. sorediiferum cephalodia), and 20 min (N. commune) in the dark before measuring photosynthetic activity. To assess recovery from desiccation, air-dried samples were wetted with NANOpure water for 1 h except Graphis spp. and T. aurea (30 min) and N. commune (24 h).
Water Potential Measurements
Water potential was measured using a WP4-T dewpoint potentiometer (Decagon Devices) at 25°C as described previously (Nabe et al., 2007). Water remaining in dried samples was usually less than 5% (w/w) dry weight. Cellular osmotic pressure under hydrated conditions was estimated as described previously (Hirai et al., 2004) by measuring the pressure-volume curve (Fig. 6; Jachetta et al., 1986; Proctor et al., 1998) with modifications, using the water potential of various sorbitol solutions (Fig. 7). Because the plotted line was convex upward instead of linear, the relationship between water potential and sorbitol concentrations was better suited to the following cubic equation (r2 = 0.9997):
 |
(2) |
where x is the sorbitol concentration. Sorbitol concentrations corresponding to measured water potential for algal and lichen samples were calculated using the above equation. For this purpose, the cubic equation was solved according to the Cardano’s formula:
 |
(3) |
 |
(4) |
 |
(5) |
From the calculated sorbitol concentration, the ideal water potential value (iψ), assuming the ideal sorbitol solution was obtained, was determined using the following equation:
 |
(6) |
where ci is the concentration of each solute. Here, Σci was assumed to be the sorbitol concentration calculated above. The reciprocal of the ideal water potential was plotted against the relative water content. The fitted straight line corresponding to cellular osmotic pressure was extrapolated to obtain an intersection with the initiation of the observed decrease in water potential (Fig. 6). The water potential at this intersection was used to calculate the ideal value of the cellular solute concentration under fully hydrated conditions using Equation 6.
Photosynthetic Activity Measurements
Chlorophyll fluorescence was measured as described previously using either a PAM 101/103 chlorophyll fluorometer (Walz; Yamane et al., 1997) or a mini-PAM chlorophyll fluorometer (Walz; Kosugi et al., 2009). Intensities of the measuring light and the actinic light were 0.17 and 50 μmol photons m−2 s−1, respectively. The intensities of the saturating pulses used to determine Fm and Fm′ were 2,600 μmol photons m−2 s−1 (with PAM 101/103) and 5,600 μmol photons m−2 s−1 (with mini-PAM). The duration of the saturating pulse was 0.8 s, but 1 s for N. commune (Hirai et al., 2004). The mini-PAM fluorometer was used for Graphis spp. and isolated Trebouxia spp.
Light-induced redox changes of P700 were measured with a PAM 101/103 equipped with a dual-wavelength emitter-detector unit (ED-P700DW; Walz). The intensity of the actinic white light was 350 μmol photons m−2 s−1 (Nabe et al., 2007). All measurements were performed in the dark, and care was taken to avoid photooxidation of P700 before measurements were taken.
Fluorescence Emission Spectra Measurements
Steady-state fluorescence emission spectra at 77 K were measured using an H-20 UV monochromator (Jobin Yvon) following the method described previously (Inoue-Kashino et al., 2005).
Micro-CT Using Synchrotron Radiation
The S. sorediiferum thallus was stained with phosphotungstic acid or osmium tetroxide prior to micro-CT analysis. For phosphotungstic acid staining, the thallus (under hydrated conditions) was fixed with 2.5% (w/v) glutaraldehyde in phosphate-buffered saline (PBS) buffer (137 mm NaCl, 8.1 mm Na2HPO4, 2.68 mm KCl, and 1.47 mm KH2HPO4) for 30 min under vacuum by degassing 15 min to infiltrate the solution. Afterward, it was washed three times with PBS buffer, followed by three rinses with distilled, deionized water. The fixed thallus was incubated in a solution containing 2% (w/v) phosphotungstic acid (QuantomiX) for 30 min, rinsed five times with distilled, deionized water, and then air dried. For osmium tetroxide staining, the thallus was fixed as described above, then washed twice with PBS buffer, before incubating for 10 min in PBS. Next, it was incubated in 1% (w/v) osmium tetroxide (TAAB Laboratories Equipment) in PBS buffer for 30 min. After rinsing twice with distilled, deionized water, step-wise dehydration of the specimen was performed with 50% (v/v), 60% (v/v), 70% (v/v), 80% (v/v), 90% (v/v), and two times with 100% (v/v) ethanol (5 min for each concentration). The specimen was incubated in tert-butyl alcohol three times for 15 each min with fresh solvent each time. After solidification of the tert-butyl alcohol at 4°C, the sample was freeze dried.
Simple-projection microtomographic analysis was performed as described previously (Uesugi et al., 2009; Mizutani et al., 2013) at the BL20XU beam line (Suzuki et al., 2004) in SPring-8 (Super Photon Ring-8 GeV; Japan Synchrotron Radiation Research Institute with the approval of the Japan Synchroton Radiation Research Institute [Proposal no. 2010A1596 and no. 2010B1455]). Samples were fixed on the high-precision rotation stage for x-ray irradiation by a small piece of clay. X-ray refraction contrast images were recorded with the AA50 x-ray imaging detector (Hamamatsu Photonics) coupled with a CCD camera (C4880-41S) and an objective lens (CF Plan 20X EPI ELWD; Nikon) using monochromatic x-ray radiation at 8 keV. The CCD camera was used with a 2 × 2 binning mode and a pixel size of 0.5 × 0.5 µm, resulting in 2,000- × 1,312-pixel images. Spatial resolution was approximately 1 µm. The distance from the CCD camera to the sample was 8 mm. The exposure time for each projection was 300 ms, and the number of projections was 900. While the stage turned 180°, x-ray reflection contrast images were captured every 0.2°. The reconstruction of x-ray images to 2-D tomographic slices was performed by the convolution back-projection method (Uesugi et al., 2009), and 3-D structure analysis was performed using computed tomography analysis software (VGStudio MAX; Volume Graphics).
Supplemental Data
The following materials are available in the online version of this article.
Supplemental Figure S1. Effects of a hypertonic environment on PSII and photosynthetic electron flow in Graphis sp. and T. aurea.
Supplemental Figure S2. Fluorescence emission spectra at 77 K under wet or dry conditions in Graphis sp. and T. aurea.
Supplemental Figure S3. P700 redox changes under hypetonic environment in Graphis sp., cephalodium of S. sorediiferum and T. aurea.
Supplemental Figure S4. Changes in PSII and photosynthetic electron flow during air-drying in C. subflaccidum, T. aurea and N. commune.
Supplemental Figure S5. High-resolution images of panels C, D, and E of Figure 10.
Supplemental Figure S6. High-resolution images of panels C, D, and E of Figure 11.
Acknowledgments
We thank Toshikazu Takahagi from the Taisho Junior High School for providing the Trebouxia spp. isolated from R. yasudae. We also thank Dr. Kanae Takahashi from the National History Museum and Institute for the identification of C. subflaccidum and Dr. Takanori Ikenaga of Kagoshima University for help with the phosphotungstic acid staining of S. sorediiferum.
Glossary
- Fv/Fm
maximum photochemical efficiency of PSII in the dark-adapted state
- [Fm′ − F]/Fm′
effective quantum yield of PSII in the light
- DCMU
3-(3,4-dichlorophenyl)-1,1-dimethyl urea
- micro-CT
micro x-ray computed tomography
- 2-D
two-dimensional
- 3-D
three-dimensional
- PBS
phosphate-buffered saline
Footnotes
This work was supported by the Ministry of Education, Culture, Sports, Science, and Technology, Japan (grant nos. Global-COE to K.S. and 18GS0318 to Y.K.).
The online version of this article contains Web-only data.
Articles can be viewed online without a subscription.
References
- Ahmadjian V (1993) The Lichen Symbiosis. John Wiley & Sons, New York [Google Scholar]
- Bergman B, Huss-Danell K. (1983) Ultrastructure of Stigonema in the cephalodia of Stereocaulon paschale. Lichenologist 15: 181–190 [Google Scholar]
- Brock TD. (1975) The effect of water potential on photosynthesis in whole lichens and in their liberated algal components. Planta 124: 13–23 [DOI] [PubMed] [Google Scholar]
- Cowan DA, Green TGA, Wilson AT. (1979) Lichen metabolism. 1. The use of tritium labelled water in studies of anhydrobiotic metabolism in Ramalina celastri and Peltigera polydactyla. New Phytol 82: 489–503 [Google Scholar]
- Fukuda SY, Yamakawa R, Hirai M, Kashino Y, Koike H, Satoh K. (2008) Mechanisms to avoid photoinhibition in a desiccation-tolerant cyanobacterium, Nostoc commune. Plant Cell Physiol 49: 488–492 [DOI] [PubMed] [Google Scholar]
- Genty BE, Briantais JM, Baker NR. (1989) The relationship between the quantum yield of photosynthetic electron transport and quenching of chlorophyll fluorescence. Biochim Biophys Acta 990: 87–92 [Google Scholar]
- Heber U, Bilger W, Bligny R, Lange OL. (2000) Phototolerance of lichens, mosses and higher plants in an alpine environment: analysis of photoreactions. Planta 211: 770–780 [DOI] [PubMed] [Google Scholar]
- Hirai M, Yamakawa R, Nishio J, Yamaji T, Kashino Y, Koike H, Satoh K. (2004) Deactivation of photosynthetic activities is triggered by loss of a small amount of water in a desiccation-tolerant cyanobacterium, Nostoc commune. Plant Cell Physiol 45: 872–878 [DOI] [PubMed] [Google Scholar]
- Hoekstra FA, Golovina EA, Buitink J. (2001) Mechanisms of plant desiccation tolerance. Trends Plant Sci 6: 431–438 [DOI] [PubMed] [Google Scholar]
- Inoue-Kashino N, Kashino Y, Satoh K, Terashima I, Pakrasi HB. (2005) PsbU provides a stable architecture for the oxygen-evolving system in cyanobacterial photosystem II. Biochemistry 44: 12214–12228 [DOI] [PubMed] [Google Scholar]
- Jachetta JJ, Appleby AP, Boersma L. (1986) Use of the pressure vessel to measure concentrations of solutes in apoplastic and membrane-filtered symplastic sap in sunflower leaves. Plant Physiol 82: 995–999 [DOI] [PMC free article] [PubMed] [Google Scholar]
- James PW, Henssen A (1976) The morphological and taxonomic significance of cephalodia. In DH Brown, DL Hawksworth, EH Bailey, eds, Lichenology: Progress and Problems. Academic Press, London, pp 27–79 [Google Scholar]
- Kato Y, Sugiura M, Oda A, Watanabe T. (2009) Spectroelectrochemical determination of the redox potential of pheophytin a, the primary electron acceptor in photosystem II. Proc Natl Acad Sci USA 106: 17365–17370 [DOI] [PMC free article] [PubMed] [Google Scholar]
- Komura M, Shibata Y, Itoh S. (2006) A new fluorescence band F689 in photosystem II revealed by picosecond analysis at 4-77 K: function of two terminal energy sinks F689 and F695 in PS II. Biochim Biophys Acta 1757: 1657–1668 [DOI] [PubMed] [Google Scholar]
- Komura M, Yamagishi A, Shibata Y, Iwasaki I, Itoh S. (2010) Mechanism of strong quenching of photosystem II chlorophyll fluorescence under drought stress in a lichen, Physciella melanchla, studied by subpicosecond fluorescence spectroscopy. Biochim Biophys Acta 1797: 331–338 [DOI] [PubMed] [Google Scholar]
- Kosugi M, Arita M, Shizuma R, Moriyama Y, Kashino Y, Koike H, Satoh K. (2009) Responses to desiccation stress in lichens are different from those in their photobionts. Plant Cell Physiol 50: 879–888 [DOI] [PubMed] [Google Scholar]
- Kosugi M, Kashino Y, Satoh K. (2010a) Comparative analysis of light response curves of Ramalina yasudae and freshly isolated Trebouxia sp. revealed the presence of intrinsic protection mechanisms independent of upper cortex for the photosynthetic system of algal symbionts in lichen. Lichenology 9: 1–10 [Google Scholar]
- Kosugi M, Katashima Y, Aikawa S, Tanabe Y, Kudoh S, Kashino Y, Koike H, Satoh K. (2010b) Comparative study on the photosynthetic properties of Prasiola (Chlorophyceae) and Nostoc (Cyanophyceae) from Antarctic and non-Antarctic sites. J Phycol 46: 466–476 [Google Scholar]
- Kosugi M, Miyake H, Yamakawa H, Shibata Y, Miyazawa A, Sugimura T, Satoh K, Itoh S, Kashino Y. (2013) Arabitol provided by lichenous fungi enhances ability to dissipate excess light energy in a symbiotic green alga under desiccation. Plant Cell Physiol 54: 1316–1325 [DOI] [PubMed] [Google Scholar]
- Kranner I, Cram WJ, Zorn M, Wornik S, Yoshimura I, Stabentheiner E, Pfeifhofer HW. (2005) Antioxidants and photoprotection in a lichen as compared with its isolated symbiotic partners. Proc Natl Acad Sci USA 102: 3141–3146 [DOI] [PMC free article] [PubMed] [Google Scholar]
- Krause GH, Weis E. (1991) Chlorophyll fluorescence and photosynthesis: the basics. Annu Rev Plant Physiol Plant Mol Biol 42: 313–349 [Google Scholar]
- Kurina LM, Vitousek PM. (1999) Controls over the accumulation and decline of a nitrogen-fixing lichen, Stereocaulon vulcani, on young Hawaiian lava flows. J Ecol 87: 784–799 [Google Scholar]
- Lange OL, Bilger W, Rimke S, Schreiber U. (1989) Chlorophyll fluorescence of lichens containing green and blue-green algae during hydration by water vapor uptake and by addition of liquid water. Bot Acta 102: 306–313 [Google Scholar]
- Lange OL, Green TG, Heber U. (2001) Hydration-dependent photosynthetic production of lichens: what do laboratory studies tell us about field performance? J Exp Bot 52: 2033–2042 [DOI] [PubMed] [Google Scholar]
- Lange OL, Green TGA, Ziegler H. (1988) Water status related photosynthesis and carbon isotope discrimination in species of the lichen genus Pseudocyphellaria with green or blue-green photobionts and in photosymbiodemes. Oecologia 75: 494–501 [DOI] [PubMed] [Google Scholar]
- Lange OL, Kilian E, Ziegler H. (1986) Water vapor uptake and photosynthesis of lichens: performance differences in species with green and blue-green algae as phycobionts. Oecologia 71: 104–110 [DOI] [PubMed] [Google Scholar]
- Lange OL, Pfanz H, Kilian E, Meyer A. (1990) Effect of low water potential on photosynthesis in intact lichens and their liberated algal components. Planta 182: 467–472 [DOI] [PubMed] [Google Scholar]
- Longton RE (1988) Biology of Polar Bryophytes and Lichens. Cambridge University Press, Cambridge, UK [Google Scholar]
- Mazur P (1968) Survival of fungi after freezing and desiccation. In GC Ainworth, AL Sussman, eds, The Fungi, Vol 3. Academic Press, London, pp 325–394 [Google Scholar]
- Miyake H, Komura M, Itoh S, Kosugi M, Kashino Y, Satoh K, Shibata Y. (2011) Multiple dissipation components of excess light energy in dry lichen revealed by ultrafast fluorescence study at 5 K. Photosynth Res 110: 39–48 [DOI] [PubMed] [Google Scholar]
- Mizutani R, Taguchi K, Ohtsuka M, Kimura M, Takeuchi A, Uesugi K, Suzuki Y. (2013) X-ray microtomographic visualization of Escherichia coli by metalloprotein overexpression. J Synchrotron Radiat 20: 581–586 [DOI] [PubMed] [Google Scholar]
- Nabe H, Funabiki R, Kashino Y, Koike H, Satoh K. (2007) Responses to desiccation stress in bryophytes and an important role of dithiothreitol-insensitive non-photochemical quenching against photoinhibition in dehydrated states. Plant Cell Physiol 48: 1548–1557 [DOI] [PubMed] [Google Scholar]
- Nakamura A, Suzawa T, Kato Y, Watanabe T. (2011) Species dependence of the redox potential of the primary electron donor P700 in photosystem I of oxygenic photosynthetic organisms revealed by spectroelectrochemistry. Plant Cell Physiol 52: 815–823 [DOI] [PubMed] [Google Scholar]
- Nash TH, III, Reiner A, Demmig-Adams B, Kilian E, Kaiser WM, Lange OL. (1990) The effect of atmospheric desiccation and osmotic water stress on photosynthesis and dark respiration of lichens. New Phytol 116: 269–276 [Google Scholar]
- Nuijs AM, Shuvalov VA, van Gorkom HJ, Plijter JJ, Duysens LNM. (1986) Picosecond absorbance difference spectroscopy on the primary reactions and the antenna-excited states in photosystem I particles. Biochim Biophys Acta 850: 310–318 [Google Scholar]
- Parker J (1968) Drought resistance mechanisms. In TT Kozlowski, ed, Water Deficits and Plant Growth, Vol 1. Academic Press, London, pp 195–234 [Google Scholar]
- Proctor M, Nagy Z, Csintalan Z, Takacs Z. (1998) Water-content components in bryophytes: analysis of pressure-volume relationships. J Exp Bot 49: 1845–1854 [Google Scholar]
- Proctor MCF, Smirnoff N. (2000) Rapid recovery of photosystems on rewetting desiccation-tolerant mosses: chlorophyll fluorescence and inhibitor experiments. J Exp Bot 51: 1695–1704 [DOI] [PubMed] [Google Scholar]
- Satoh K, Hirai M, Nishio J, Yamaji T, Kashino Y, Koike H. (2002) Recovery of photosynthetic systems during rewetting is quite rapid in a terrestrial cyanobacterium, Nostoc commune. Plant Cell Physiol 43: 170–176 [DOI] [PubMed] [Google Scholar]
- Sigfridsson B, Öquist G. (1980) Preferential distribution of excitation energy into photosystem I of desiccated samples of the lichen Cladonia impexa and the isolated lichen-alga Trebouxia pyriformis. Physiol Plant 49: 329–335 [Google Scholar]
- Suzuki Y, Uesugi K, Takimoto N, Fukui T, Aoyama K, Takeuchi A, Takano H, Yagi N, Mochizuki T, Goto S, et al (2004) Construction and commissioning of a 248 m-long beamline with X-ray undulator light source. In T Warwick, J Stöhr, HA Padmore, J Arthur, eds, Synchrotron Radiation Instrumentation: Eighth International Conference on Synchrotron Radiation Instrumentation, AIP Conference Proceedings, Vol 705. AIP Publishing, San Francisco, pp 344–347 [Google Scholar]
- Uesugi K, Takeuchi A, Suzuki Y. (2009) High-definition high-throughput micro-tomography at SPring-8. J Phys Conf Ser 186: 012050 [Google Scholar]
- Veerman J, Vasil’ev S, Paton GD, Ramanauskas J, Bruce D. (2007) Photoprotection in the lichen Parmelia sulcata: the origins of desiccation-induced fluorescence quenching. Plant Physiol 145: 997–1005 [DOI] [PMC free article] [PubMed] [Google Scholar]
- Weis E, Lechtenberg D, Barber J, Schreiber U. (1989) Fluorescence analysis during steady-state photosynthesis. Philos Trans R Soc Lond B Biol Sci 323: 253–268 [Google Scholar]
- Weis E, Lechtenberg D, Krieger A (1990) Physiological control of primary photochemical energy conversion in higher plants. In M Baltscheffsky, ed, Current Research in Photosynthesis. Kluwer Academic Publishers, Dordrecht, The Netherlands, pp 3101–3106 [Google Scholar]
- Yamane Y, Kashino Y, Koike H, Satoh K. (1997) Increases in the fluorescence Fo level and reversible inhibition of photosystem II reaction center by high-temperature treatments in higher plants. Photosynth Res 52: 57–64 [Google Scholar]


