

Abstract
Detailed linkage and recombination rate maps are necessary to use the full potential of genome sequencing and population genomic analyses. We used a custom collared flycatcher 50 K SNP array to develop a high-density linkage map with 37 262 markers assigned to 34 linkage groups in 33 autosomes and the Z chromosome. The best-order map contained 4215 markers, with a total distance of 3132 cm and a mean genetic distance between markers of 0.12 cm. Facilitated by the array being designed to include markers from most scaffolds, we obtained a second-generation assembly of the flycatcher genome that approaches full chromosome sequences (N50 super-scaffold size 20.2 Mb and with 1.042 Gb (of 1.116 Gb) anchored to and mostly ordered and oriented along chromosomes). We found that flycatcher and zebra finch chromosomes are entirely syntenic but that inversions at mean rates of 1.5–2.0 event (6.6–7.5 Mb) per My have changed the organization within chromosomes, rates high enough for inversions to potentially have been involved with many speciation events during avian evolution. The mean recombination rate was 3.1 cm/Mb and correlated closely with chromosome size, from 2 cm/Mb for chromosomes >100 Mb to >10 cm/Mb for chromosomes <10 Mb. This size dependence seemed entirely due to an obligate recombination event per chromosome; if 50 cm was subtracted from the genetic lengths of chromosomes, the rate per physical unit DNA was constant across chromosomes. Flycatcher recombination rate showed similar variation along chromosomes as chicken but lacked the large interior recombination deserts characteristic of zebra finch chromosomes.
Keywords: collared flycatcher, linkage map, recombination rate, SNP array
Introduction
At a time when draft genome sequencing and assembly are practicable for most study organisms (Ellegren 2014), other types of critical genetic information may represent limiting steps in population and evolutionary genetic studies. One such factor is detailed linkage maps and the associated inference of how the rate of recombination varies across the genome (Dumont & Payseur 2008). Linkage maps enable anchoring and ordering of scaffolds along chromosomes (Heliconius Genome Consortium 2012; Huang et al. 2013). This is necessary for making full use of the unprecedented power provided by next-generation sequencing technology, which, in the absence of physical mapping approaches (like BAC-end sequencing and fingerprinting), does not provide chromosome sequences. Moreover, recombination is a critical parameter in governing the degree and nature of intraspecific diversity as well as interspecific divergence. For example, the rate of recombination is expected to correlate positively with local levels of nucleotide diversity (McGaugh et al. 2012; Cutter & Payseur 2013; Campos et al. 2014) and with the rate of adaptive evolution (Presgraves 2005; Campos et al. 2014), and there is an increasing awareness that recombination moulds the evolution of base composition via GC-biased gene conversion (Duret & Arndt 2008; Webster & Hurst 2012). Also, recombination may be a critical factor in shaping the genomic landscape of species differentiation (Butlin 2005; Renaut et al. 2013).
Large pedigrees are needed for the development of linkage maps, and obtaining such samples can be challenging for many nonmodel species. Species that are difficult to breed in captivity and/or to monitor and sample in natural settings, or which have long generation times and/or small litter sizes, are examples of organisms that may be problematic in this context. Unfortunately, this applies to many natural populations of species of relevance in ecological or evolutionary research. However, in natural populations of birds, acquiring pedigree material is greatly facilitated in species that readily accept breeding in artificial nest boxes and display high site fidelity. This is the case for our study species, the collared flycatcher (Ficedula albicollis), and it has also made it to be one of the most well-studied avian models for questions such as life history evolution, quantitative genetics and speciation (Ellegren et al. 1996; Gustafsson et al. 1995; Veen et al. 2001; Qvarnstrom et al. 2006; Saether et al. 2007; Qvarnström et al. 2010; Sætre & Sæther 2010; Ellegren et al. 2012).
Available evidence, notably from chicken G. gallus (ICGSC 2004; Groenen et al. 2009) and zebra finch Taeniopygia guttata (Stapley et al. 2008; Backström et al. 2010a), indicates an unusual heterogeneity in the rate of recombination within avian genomes. One determinant of this variation comes from the fact that bird chromosomes differ considerably in size. Moreover, data from zebra finch and to some extent also chicken show a very strong bias for recombination in larger chromosomes to be concentrated to end regions (Groenen et al. 2009; Backström et al. 2010a). It is not yet known what the underlying mechanism or evolutionary force driving such pattern might be, or whether it is in fact a general feature of bird chromosomes. Another characteristic of avian genomes is an unusual stability of the karyotype (Griffin et al. 2007; Ellegren 2010). The majority of species have about 40 pairs of chromosomes, and interchromosomal rearrangements are rare (Ellegren 2013). For example, only one fusion and one fission event separate the chicken and zebra finch karyotypes despite the fact that these species represent two of the most divergent lineages of contemporary birds (Warren et al. 2010). However, there are indications that intrachromosomal rearrangements occur more frequently (Skinner & Griffin 2012), although the rate and more precise pattern of this remains to be revealed.
Here we present the development of a high-density genetic linkage map of the collared flycatcher based on genotyping with a 50 K (50 000) SNP array in a multi-generation pedigree of >600 birds from a natural population. This effort was motivated from several perspectives. First, having recently generated a draft flycatcher genome assembly (Ellegren et al. 2012), we were keen to confidently be able to place, order and orient scaffolds along chromosomes and thereby arrive at an assembly with essentially continuous chromosome sequences. The strategy for achieving this was based on designing an array with SNPs from the majority of all scaffolds, with the aim to place these onto a linkage map. Second, with the access to an updated genome assembly together with detailed information on recombination fractions between markers, we wanted to investigate the recombination landscape in an avian genome at high resolution. Third, with the access to a short read, shot gun-based genome assembly with unusual continuity, we sought to reveal the character of avian chromosomal evolution by making a high-resolution comparison of flycatcher genome organization with the only two avian genomes physically assembled (using cosmid and BAC clones) and sequenced with Sanger technology, that is chicken (ICGSC 2004) and zebra finch (Warren et al. 2010).
Material and methods
Specimens
Blood samples were collected from collared flycatcher (n = 655) families breeding on the Baltic Sea island Öland (56°44′N 16°40′E) from 2002 to 2011. The pedigree consisted of four generations: 204 individuals in the parental generation and 451 F1–F3 progenies (Supporting information Fig. S1). DNA was extracted from blood samples using a standard proteinase K digestion/phenol–chloroform purification protocol (Sambrook et al. 1989).
Genotyping with a 50 K SNP array
An Illumina 50 K SNP array for collared flycatcher has recently been developed by selecting markers from >10 million SNPs identified in genomic resequencing of 10 unrelated collared flycatchers (from our study population) and 10 pied flycatchers Ficedula hypoleuca (Kawakami et al. 2014). The bulk of markers were chosen based on a number of criteria set to maximize the usefulness in collared flycatchers, including polymorphism level in the sequencing sample, even distribution across the genome as judged by comparative map information vis-à-vis the zebra finch linkage map and, if possible, inclusion of at least two SNPs from all scaffolds >25 kb in a preliminary genome assembly version. Five thousand markers on the array were selected to represent potentially fixed differences between the two sister species and were thus generally less informative for intraspecific analyses.
Genotyping was done with an Illumina iScan instrument. Markers that failed to pass the quality filtering for genotype calling were removed from subsequent analysis. Deviation from Hardy–Weinberg equilibrium (HWE) was tested for in the parental generation using plink version 1.07 (Purcell et al. 2007). After filtering out SNPs deviating from HWE, Mendelian inheritance was inspected for the remaining markers using GenotypeChecker (Paterson & Law 2011). In total, 38 900 markers were polymorphic in the pedigree, of which 37 443 segregated with a minor allele frequency (MAF) >0.05. Among these, there were 845 putative Z-linked markers. The low proportion of loci with rare alleles illustrates the value of selecting markers based on prior information of polymorphism levels, in this case from whole-genome resequencing, in the same population.
The inheritance analysis revealed 89 individuals with at least one marker that did not follow Mendelian patterns. As extra-pair paternity (EPP) is known to occur frequently in the collared flycatcher (Sheldon & Ellegren 1999), individuals with a high proportion of markers deviating from expected Mendelian segregation likely result from EPP. We therefore removed 46 individuals in which >100 markers showed inconsistent inheritance. The remaining 43 individuals (of the 89 individuals with >1 error) had 1–15 markers with Mendelian inconsistency and were retained; however, the inconsistent markers (181 in total) were removed from the subsequent analysis in all individuals. In the end, we used genotype data from 609 individuals and 37 262 markers for linkage analysis. The average number of informative meioses in the pedigree across all markers was 187.
Linkage analysis
A genetic linkage map of collared flycatcher was constructed using an improved version of cri-map 2.503 (Green et al. 1990) developed by Ian Evans and Jill Maddox and implementing the CRI-GEN package provided by Xuelu Liu and Michael Grosz (Monsanto, St. Louis, MO, USA). A detailed account for the different steps in the construction of the map is described in the Supporting information (Appendix S1). These included calculating pairwise LOD scores using TWOPOINT and the formation of linkage groups using AUTOGROUP. BUILD was used for making best-order linkage maps.
An updated genome assembly based on high-density genetic linkage data
Markers incorporated in the genetic map were mapped to ficalb_1.4 with BWA (Li & Durbin 2010). Discrepancies in the form of scaffolds including markers from more than one linkage group were indicative of scaffold chimerism in the assembly and were corrected as described in Supporting information (Appendix S1). The ends of all new scaffolds were scanned for mate-pair reads with their mate on a different scaffold end, representing a means for using mate-pair information that the assembler had failed to automatically integrate in the scaffolding process. This was done separately for each mate-pair library described in Ellegren et al. (2012), which had insert sizes of 2.4, 4.1, 5.1, 18 and 21 kb, respectively, where insert size conservatively was let to define the length of what was considered as the scaffold end. For each end, links were sorted and counted, and the paired scaffold with most hits was considered for possible adjacency. To infer a physical connection between two scaffolds, we then applied a reciprocal criterion requesting that the number of links to the potential neighbour had to be higher than the number of links to the second and third best hit together. We refer to scaffolds connected in this way as super-scaffolds. The new assembly was named ficalb1.5 and is deposited in GenBank under the accession no. AGTO02000000.
Avian karyotypes are notoriously difficult to resolve due to the very large number of minute microchromosomes; most birds have 2n ≈ 80 with the size of about half of the chromosomes <10 Mb. Only the chicken karyotype has been well characterized (Masabanda et al. 2004). This, coupled with the observation of a very high degree of synteny conservation among birds (Ellegren 2013), has led to a convention in avian genome sequencing efforts of numbering chromosomes according to homologous chicken chromosomes, even if this does not exactly match decreasing physical size in the focal species (Warren et al. 2010). Treatment of fusions or fissions can be illustrated by the nomenclature adopted in the zebra finch genome sequencing project (Warren et al. 2010), the second avian genome to be sequenced. For example, chicken chromosome 4 corresponds to two chromosomes in zebra finch, the result of a fusion in the galliform lineage. In zebra finch, these chromosomes are referred to as 4 (the larger) and 4A. We have followed this practice as a useful nomenclature for flycatcher chromosomes, and this was not least motivated by the observation that flycatcher and zebra finch chromosomes were completely syntenic, without strong evidence for interchromosomal rearrangements.
Analyses of chromosomal rearrangements
Ordered and oriented flycatcher scaffolds were concatenated into chromosome sequences with an arbitrary gap size of 5 kb. Repeat-masked flycatcher, zebra finch (taegut3.2.4) and chicken (washuc2) assemblies were aligned with progressiveMauve (Darling et al. 2010) with default settings, one chromosome at the time. Anchors including all three species were extracted from the backbone file and given as input to grimm (Tesler 2002), to be grouped in syntenic blocks with the minimum block size set to 50 kb, unless otherwise stated. mgr (Bourque & Pevzner 2002) was then used for inferring rearrangement events between species, which was essentially only in the form of inversions (see Supporting information Appendix S1).
Flycatcher chromosome sequences were also aligned to zebra finch only with lastz (Harris 2007). Anchors that overlapped in either of the genomes were filtered, saving the longest one only if the alignment score was more than 1.5 times higher than for the anchors it overlapped with. Regions with several ambiguous overlapping anchors with similar length and alignment score were removed completely. The filtered unique anchors were grouped into syntenic blocks with grimm as described above. Unaligned regions between syntenic blocks were considered as break points. To narrow down these regions further, we used cassis (Baudet et al. 2010), which attempts to find the precise break point location by a local realignment strategy. In this way, most break points decreased in size; however, for a few that cassis failed to narrow down, we kept the original break point positions. IntersectBed from bedtools (Quinlan & Hall 2010) was used for extracting overlaps with known repeats and genes. For all rearrangement analyses, we only included flycatcher scaffolds that were confidently both oriented and ordered based on direct evidence from linkage or mate-pair data.
Recombination rate analysis
We estimated recombination rates in 200-kb windows across the flycatcher genome using the updated assembly version as reference. This was done by calculating recombination fractions between all adjacent markers in the best-order linkage map and assigning window-specific estimates based on the weighted average recombination rate for all marker pairs present within, or flanking, a window. We calculated each window's distance to nearest chromosome end, as well as its gene density (proportion of exonic sequence), GC content, repeat content separated into the two classes ‘interspersed repeats’ and ‘microsatellites’ (RepeatMasker; Smit, Hubley, and Green; http://repeatmasker.org), and the presence of previously identified (CCNCCNTNNCCNC and CCTCCCT; Myers et al. 2010) and de novo discovered (see below) sequence motifs associated with high recombination regions. We subsequently omitted all windows spanning a scaffold gap in the genome assembly. This resulted in a set of 4749 windows for which estimates of both recombination rate and the listed genomic parameters were available.
The variables were transformed to reduce skewness in their distributions; recombination rate was log-transformed to base 10 after adding a constant of 1 to preserve zero rate values, chromosome size was log-transformed to base 10, distance to chromosome end was standardized by chromosome size giving values ranging between 0 and 1, and microsatellite density, repeat density, motif density, gene density and GC content were square-root-transformed. For each parameter, we calculated the raw correlation with the recombination rate using the Pearson correlation statistic. We subsequently fitted a multiple linear regression (MLR) model using recombination rate as the response variable to investigate whether the variation could be explained by variation in the candidate explanatory variables. As an initial step, we investigated the relationship among the candidate explanatory variables by cluster analysis based on the pairwise correlations. This revealed that all of the considered genomic features were highly interrelated with each other (Supporting information Fig. S2). In particular, microsatellite and motif density both correlated strongly with chromosome size (r = −0.45 and −0.43, respectively). As small chromosomes only showed limited variation in some of explanatory variables, we focused the analysis on chromosomes larger than 20 Mb.
Correlations between explanatory variables can create biases in regression-like analysis, and inference about causal relationships based on MLR analysis thus needs to be made carefully. Beside standard MLR and pairwise correlation analysis, we thus performed a principal component regression (PCR) analysis using recombination rate as the response variable and the six genomic features as candidate explanatory variables. All regression analyses were performed after Z-transformation of the explanatory variables, which means standardization of the mean value to 0 and of the standard deviation to 1. We also ran MLR and PCR using GC content as response variable as a proxy for the long-term recombination rate, motivated by the previously seen correlation between GC content and recombination in birds (Mugal et al. 2013) and the general idea that long-term recombination rate influences GC content via biased gene conversion (Duret & Arndt 2008).
In a specific test of the relationship between recombination rate and distance to chromosome end, we performed a locally weighted polynomial regression (lowess regression) with a smoothing parameter value of 0.5. Based on the lowess regression, we classified ‘end regions’ as regions <5.5 Mb from the chromosome end, and ‘centric regions’ as regions >5.5 Mb from the chromosome ends (Supporting information Fig. S3). The mean recombination rate was then compared between regions.
To investigate sequence context effects on the recombination rate, we divided the data into ‘hot’ and ‘cold’ recombination regions. The hot regions consisted of the 2.5% (n = 112) marker intervals with highest recombination rate and the cold regions consisted of the 2.5% (n = 112) marker intervals with lowest recombination rate (effectively, the latter translates to the subset of marker pairs with the longest physical distance between markers without any evidence for recombination in the pedigree). We used these categories and searched for 6 to 10-bp sequence motif enrichment in hot regions using the homer2 de novo option in homer 4.2 (Heinz et al. 2010). As suggested by Heinz et al. (2010), we applied a stringent significance threshold for enrichment of (10−20) and removed complete redundancies.
Results
A high-density linkage map of the collared flycatcher genome
Linkage analysis first mapped 731 markers to unique positions on 31 linkage groups in a preframework map with the stringent threshold of LOD > 5. The iterative addition of markers by pairwise linkage scoring between preframework markers and the remaining 36 531 markers subsequently assigned a total of 33 627 markers to 34 different linkage groups, including the three new linkage groups Fal34–Fal36. We then ordered markers within linkage groups, and the resulting framework map (marker order supported by LOD > 3.0) was composed of 2456 ordered markers with a total genetic distance of 3256 cm and a mean genetic distance between adjacent markers of 1.37 cm (±1.68 SD; Table 1). We included additional SNPs in this map by stepwise lowering the LOD threshold down to LOD > 0.1 (see Supporting information Appendix S1), providing a best-order map containing 4302 markers and spanning 3256 cm in autosomes and 161 cm in the Z chromosome (Table 1, Fig. 1, Supporting information Fig. S4). The mean genetic distance between adjacent markers in the best-order map was 0.69 cm (±1.10 SD). Finally, there were 33 627 markers at this stage that were assigned to one of the linkage groups but not placed on the best-order map. Of these, 31 867 unmapped markers were located in scaffolds containing best-order markers; therefore, their physical locations could be inferred. When these markers were forced to be included in the map based on their physical position in the respective scaffolds, 76% of markers (24 231) had zero genetic distance with already mapped best-order markers. The total genetic distance of the forced order map was inflated with 13% (3690 cm), likely at least in part due to small errors in marker order (Table 1). The mean genetic distance between adjacent markers in this forced map was 0.12 cm (±0.73 SD).
Table 1.
Number of mapped SNP markers and total genetic distance of each chromosomes of the collared flycatcher
| Number of markers | Framework map (cm) | Best-order map (cm) | Forced map (cm) | |||||||||
|---|---|---|---|---|---|---|---|---|---|---|---|---|
| Chrom. | Framework map | Best-order map | Forced map | Average | Female | Male | Average | Female | Male | Average | Female | Male |
| 1 | 147 | 341 | 2247 | 252.8 | 238.5 | 266.9 | 246.2 | 231.1 | 261.6 | 261.9 | 248.4 | 276.5 |
| 1A | 166 | 317 | 1976 | 204.9 | 188.8 | 220.4 | 206.1 | 189.3 | 224.2 | 227.5 | 202.8 | 256.5 |
| 2 | 172 | 301 | 1608 | 325.9 | 314.4 | 335.1 | 316.1 | 307.8 | 323.4 | 364.7 | 343.4 | 391.7 |
| 3 | 123 | 180 | 1518 | 232.5 | 224.7 | 240.8 | 225.9 | 214.4 | 237.0 | 243.4 | 236.1 | 252.0 |
| 4 | 58 | 102 | 363 | 168.6 | 166.7 | 170.4 | 167.2 | 164.3 | 169.9 | 151.2 | 146.4 | 155.1 |
| 4A | 100 | 158 | 1498 | 81.7 | 74.0 | 89.5 | 80.3 | 73.2 | 88.2 | 117.4 | 109.6 | 127.1 |
| 5 | 95 | 199 | 1389 | 168.4 | 157.3 | 181.3 | 170.4 | 156.6 | 185.1 | 199.5 | 175.3 | 226.2 |
| 6 | 87 | 138 | 1022 | 125.4 | 119.1 | 131.9 | 121.3 | 115.9 | 126.5 | 121.7 | 115.8 | 128.1 |
| 7 | 101 | 203 | 1209 | 122.0 | 118.4 | 125.7 | 122.5 | 119.1 | 128.9 | 214.4 | 141.3 | 299.5 |
| 8 | 91 | 116 | 752 | 95.7 | 94.4 | 98.7 | 96.0 | 93.1 | 99.3 | 126.2 | 122.4 | 131.3 |
| 9 | 104 | 184 | 1207 | 96.8 | 90.0 | 103.8 | 96.6 | 90.0 | 103.5 | 116.2 | 110.0 | 123.4 |
| 10 | 97 | 160 | 1529 | 93.2 | 93.7 | 93.3 | 94.0 | 91.2 | 97.5 | 106.7 | 106.9 | 106.8 |
| 11 | 95 | 160 | 1593 | 84.0 | 72.6 | 95.2 | 81.0 | 68.9 | 93.6 | 101.8 | 106.2 | 99.9 |
| 12 | 79 | 138 | 1072 | 83.5 | 70.1 | 97.0 | 84.7 | 71.2 | 99.6 | 90.8 | 82.6 | 100.4 |
| 13 | 39 | 65 | 451 | 85.5 | 86.3 | 84.5 | 87.8 | 87.0 | 86.1 | 86.6 | 90.9 | 81.8 |
| 14 | 95 | 132 | 1227 | 88.1 | 83.3 | 92.1 | 87.6 | 82.5 | 92.3 | 95.3 | 90.1 | 101.2 |
| 15 | 88 | 146 | 1149 | 60.6 | 55.9 | 65.6 | 59.3 | 54.1 | 65.2 | 64.2 | 56.7 | 72.7 |
| 17 | 108 | 146 | 1169 | 74.8 | 58.3 | 93.1 | 73.8 | 58.1 | 90.4 | 77.5 | 60.3 | 96.7 |
| 18 | 70 | 128 | 1115 | 79.2 | 76.3 | 81.5 | 79.7 | 78.9 | 79.6 | 88.8 | 82.9 | 95.6 |
| 19 | 66 | 126 | 1163 | 55.8 | 59.9 | 51.3 | 58.0 | 59.5 | 56.6 | 57.8 | 59.3 | 56.5 |
| 20 | 75 | 129 | 1257 | 52.5 | 55.5 | 48.6 | 53.7 | 56.1 | 51.1 | 54.4 | 57.4 | 51.0 |
| 21 | 39 | 64 | 695 | 46.6 | 46.0 | 46.8 | 48.3 | 48.6 | 47.9 | 48.8 | 48.7 | 49.0 |
| 22 | 15 | 32 | 44 | 51.0 | 60.2 | 42.3 | 53.2 | 56.0 | 50.5 | 51.0 | 53.8 | 48.6 |
| 23 | 45 | 96 | 929 | 47.1 | 51.7 | 41.8 | 49.1 | 53.2 | 44.7 | 50.2 | 52.6 | 47.6 |
| 24 | 71 | 98 | 1149 | 50.6 | 49.2 | 52.0 | 50.5 | 51.3 | 50.2 | 54.7 | 51.3 | 58.6 |
| 25 | 12 | 22 | 60 | 46.2 | 43.7 | 51.0 | 47.9 | 45.6 | 53.0 | 50.0 | 48.5 | 54.0 |
| 26 | 48 | 81 | 950 | 46.7 | 50.7 | 41.6 | 46.3 | 48.1 | 43.2 | 88.5 | 98.0 | 79.6 |
| 27 | 42 | 73 | 534 | 74.9 | 69.4 | 83.6 | 73.5 | 68.0 | 82.2 | 85.1 | 80.6 | 97.7 |
| 28 | 24 | 39 | 188 | 48.9 | 49.9 | 49.2 | 48.2 | 49.3 | 49.5 | 66.2 | 72.3 | 60.4 |
| LGE22 | 16 | 32 | 38 | 52.3 | 52.1 | 51.6 | 53.3 | 53.0 | 53.6 | 49.8 | 43.5 | 55.8 |
| Fal34 | 2 | 94 | 10 | 12.1 | 31.0 | 6.9 | 16.3 | 20.7 | 11.9 | 15.4 | 19.1 | 11.5 |
| Fal35 | 5 | 8 | 8 | 36.8 | 35.5 | 39.3 | 37.2 | 34.7 | 39.6 | 36.6 | 34.7 | 39.0 |
| Fal36 | 2 | 5 | 5 | 2.9 | 0 | 5.6 | 9.7 | 6.5 | 13.8 | 9.7 | 6.5 | 13.8 |
| Total* | 2377 | 4213 | 31124 | 3148 | 3038 | 3278 | 3142 | 2997 | 3300 | 3574 | 3354 | 3846 |
| Z | 79 | 89 | 743 | 107.7† | — | 161.6 | 107.5† | — | 161.2 | 115.9† | — | 173.9 |
| Total‡ | 2456 | 4302 | 31 867 | 3256 | 3038 | 3440 | 3249 | 2997 | 3461 | 3690 | 3354 | 4020 |
Autosomes.
Sex-average genetic distance for chromosome Z calculated as male genetic distance * 2/3.
Autosomes plus Z chromosome.
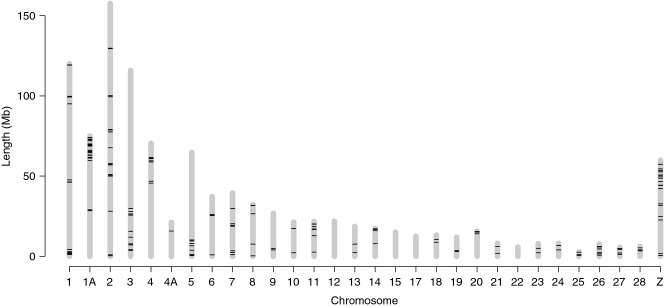
Fig. 1.

A genetic linkage map of the collared flycatcher genome. The horizontal bars on each chromosome or linkage group represent mapped SNP markers based on best-order map. The scale bar to the left shows the lengths of linkage groups as measured in Kosambi cm. A more detailed map with marker names is presented as Supporting information Fig. 4.
A second-generation assembly of the flycatcher genome
The draft assembly of the collared flycatcher genome (version ficalb_1.4; Ellegren et al. 2012) lacks unambiguous information on the order and orientation of scaffolds along most chromosomes. For example, as the draft assembly was based on a coarse linkage map, scaffold ordering had in many cases to be based on indirect information from the assumption of conserved synteny relative to the zebra finch genome. In addition, 55% of the scaffolds remained unanchored to linkage groups/chromosomes. With the aid of the new linkage map, we were able to anchor, order and orient scaffolds corresponding to 95.7% (1.013 Gb) of the final 1.058 Gb assigned to chromosomes (Table 2). We then constructed super-scaffolds by scanning scaffold ends for mate-pair links to all other scaffolds, assigned as well as unassigned, resulting in the incorporation of 43 previously unassigned and mostly small scaffolds (mean size of 68.2 kb, a total of 2.9 Mb) into the assembly. For another 40 scaffolds (mean size 660 kb, 26.4 Mb in total) that had only been indirectly placed in the assembly based on information on the location of homologous sequence in zebra finch, we could confirm ordering and confirm or establish orientation. Finally, and importantly, links were established between adjacent scaffolds for 210 of the 394 gaps in the assembly (285 of a total of 437 gaps after the inclusion of the 43 previously unassigned short scaffolds). As the mate-pair libraries from which these links were established had insert sizes of 2–20 kb, this indicates the maximum size of the gaps. In no case, did we find evidence for links between scaffolds that were not placed immediately adjacent to each other, strongly validating the overall accuracy of the assembly.
Table 2.
Number of ordered and oriented scaffolds assigned to each collared flycatcher chromosome in the ficalb1.5 assembly version. Also shown is assembly size of homologous chromosomes of flycatcher, zebra finch and chicken
| Collared flycatcher | |||||||
|---|---|---|---|---|---|---|---|
| Chromosome | Scaffolds | Super-scaffolds | Singleton scaffolds* | Not oriented scaffolds | Size (Mb) | Zebra finch (Mb) | Chicken (Mb) |
| 1 | 43 | 6 | 3 | 1 | 119.8 | 119.6† | 201.0 |
| 1A | 38 | 8 | 6 | 2 | 74.8 | 73.7 | — |
| 2 | 35 | 8 | 3 | 1 | 157.4 | 156.4 | 154.9 |
| 3 | 28 | 6 | 5 | 1 | 115.7 | 112.6 | 113.7 |
| 4 | 26 | 4 | 4 | 1 | 70.3 | 69.8 | 94.2 |
| 4A | 5 | 2 | 1 | 1 | 21.2 | 20.7 | — |
| 5 | 22 | 5 | 5 | 0 | 64.6 | 62.4 | 62.2 |
| 6 | 11 | 2 | 1 | 0 | 37.2 | 36.3 | 37.4 |
| 7 | 14 | 3 | 0 | 0 | 39.3 | 39.8 | 38.4 |
| 8 | 12 | 3 | 0 | 0 | 32.0 | 28.0 | 30.7 |
| 9 | 7 | 3 | 0 | 0 | 26.8 | 27.2 | 25.6 |
| 10 | 11 | 2 | 0 | 21.3 | 20.8 | 22.6 | |
| 11 | 5 | 2 | 1 | 0 | 21.7 | 21.4 | 21.9 |
| 12 | 11 | 2 | 1 | 0 | 21.9 | 21.6 | 20.5 |
| 13 | 6 | 2 | 2 | 0 | 18.6 | 17.0 | 18.9 |
| 14 | 2 | 1 | 0 | 0 | 17.4 | 16.4 | 15.8 |
| 15 | 1 | 0 | 1 | 0 | 14.9 | 14.4 | 13.0 |
| 16 | 0 | 0 | 0 | 0 | — | <0.01 | 0.43 |
| 17 | 4 | 2 | 0 | 0 | 12.4 | 11.6 | 11.2 |
| 18 | 13 | 1 | 1 | 1 | 13.1 | 11.2 | 10.9 |
| 19 | 6 | 2 | 0 | 0 | 11.9 | 11.6 | 9.9 |
| 20 | 8 | 2 | 1 | 0 | 15.6 | 15.7 | 14.0 |
| 21 | 5 | 1 | 2 | 1 | 8.1 | 6.0 | 7.0 |
| 22 | 8 | 3 | 1 | 3 | 5.7 | 3.4 | 3.9 |
| 23 | 5 | 1 | 0 | 0 | 7.9 | 6.2 | 6.0 |
| 24 | 4 | 1 | 0 | 0 | 8.0 | 8.0 | 6.4 |
| 25 | 19 | 3 | 2 | 1 | 2.7 | 1.3 | 2.0 |
| 26 | 6 | 1 | 2 | 1 | 7.6 | 4.9 | 5.1 |
| 27 | 19 | 4 | 2 | 7 | 5.5 | 4.6 | 4.8 |
| 28 | 12 | 3 | 0 | 3 | 6.1 | 5.0 | 4.5 |
| LGE22‡ | 10 | 3 | 3 | 4 | 2.1 | 0.9 | 0.9 |
| Fal34 | 4 | 1 | 1 | 4 | 0.11§ | — | — |
| Fal35 | 0 | 0 | 0 | 7 | 0¶ | — | — |
| Fal36 | 1 | 0 | 1 | 3 | 0.18** | ||
| Z | 32 | 8 | 5 | 7 | 59.7 | 74.6 | 72.9 |
| Total | 1042 | 1023 | 1031 | ||||
Scaffolds which could not be joined to other scaffolds in the super-scaffolding process.
1.1 Mb from the tentative chromosome 1B in zebra finch has been added to 1A of this species.
In the most recent chicken genome assembly (Galgal4), the full name of this linkage group is LGE22C19W28_E50C23.
Fal34 has an assembly size of 0.29 Mb when including un-oriented scaffolds.
Fal35 has an assembly size of 0.32 Mb when including un-oriented scaffolds.
Fal36 has an assembly size of 0.46 Mb when including un-oriented scaffolds.
The new assembly (ficalb1.5) has an N50 super-scaffold size of 20.2 Mb (17.4 Mb if including singleton scaffolds) and covers 33 autosomes and the Z chromosome (Table 2, Supporting information Fig. S5). The great majority of chromosomes are nearly fully covered by 1–5 super-scaffolds, that is not far from continuous chromosome sequences; four chromosomes do in fact correspond to a single super-scaffold and one to a single scaffold (Table 2). The assembly includes sequence data for four microchromosomes that are not represented by defined chromosomes in the chicken assembly (which has sequence data from chromosomes 1–28 and 32). One of these, including 2.1 Mb of flycatcher sequence and covering a genetic distance of 53 cm, has sequence homology to chicken linkage group LGE22. The other three (Fal34 with 16 cm, Fal35 with 37 cm and Fal36 with 10 cm) show no sequence homology to assembled sequence from the chicken genome. The linkage map did not have the same high degree of resolution for the Z chromosome as for autosomes due to the fact that only male meioses were informative. This led to a higher proportion of scaffolds that were not ordered and/or oriented, and as such scaffolds were not included in our final assembly, this likely explains why the flycatcher Z chromosome assembly was shorter (59.7 Mb) than that of chicken (74.6 Mb) and zebra finch (72.9 Mb).
In the end, after addition of new scaffolds and scaffold orientation by linkage data and mate-pair linking, the ordered and oriented sequences constitute 98.6% (1.042 Gb) of the scaffolds assigned to chromosomes. Of the total assembly also including unassigned scaf-folds (1.116 Gb), 93.4% of the sequence was anchored, ordered and oriented along chromosomes. This represents a considerable improvement compared to the previous assembly (596 Mb or 56.5% anchored; Table 3).
Table 3.
Summary assembly statistics for the second-generation assembly version of the collared flycatcher genome (ficalb1.5; present study) and the previous ficalb_1.4 version (Ellegren et al. 2012)
| ficalb_1.4 | ficalb1.5 | |||
|---|---|---|---|---|
| # Scaffolds | Size (Mb) | # Scaffolds | Size (Mb) | |
| Ordered and oriented | 67 | 596 | 441 | 1042 |
| Ordered | 67 | 224 | 46 | 15 |
| Inferred | 164 | 182 | 2 | 0 |
| Unassigned | 21 467 (109) | 114 (73) | 21 354 (73) | 59 (23) |
| Total | 21 765 (404) | 1116 (1076) | 21 843 (451) | 1116 (1075) |
All data from scaffolds >200 bp are included, which explains the large number of unassigned scaffolds and the large total number of scaffolds. Data for scaffolds >100 kb are shown in parentheses; note that excluding scaffolds <100 kb has little influence on total assembly size. ‘Inferred’ means scaffolds indirectly assigned to chromosomes based on conserved synteny with zebra finch.
Highly conserved DNA content of avian chromosomes
The high degree of genome coverage coupled with the unusual continuity in scaffolded sequence along each chromosome gives unprecedented power and resolution to study the rate and pattern of chromosomal rearrangements during avian evolution. We made whole-genome alignments of flycatcher, chicken and zebra finch, inferred syntenic blocks >50 kb in size and identified chromosomal rearrangements. Despite the two lineages split ≈40 million years (My) ago (Nabholz et al. 2011), flycatcher and zebra finch chromosomes are entirely syntenic without clear-cut evidence of interchromosomal rearrangements (see Supporting information Fig. S6 for a comment on the tentative chromosome 1B in zebra finch), witnessing on the rather extreme karyotypic stability of birds. The flycatcher assembly confirms the only two clear cases of interchromosomal rearrangement distinguishing the chicken and zebra finch karyotypes. First, flycatcher and zebra finch have two chromosomes, chromosomes 1 (≈120 Mb) and 1A (≈75 Mb), which correspond to the single chromosome 1 of chicken (201 Mb), a result of a fission in the passeriform lineage. Second, chicken chromosome 4 (94 Mb) corresponds in both flycatcher and zebra finch to two chromosomes, chromosomes 4 (≈70 Mb) and 4A (≈21 Mb), resulting from a fusion in the galliform lineage.
The assembly sizes of individual chromosomes were remarkably similar among chicken, zebra finch and flycatcher (Table 2), and did not differ by more than 2.5 Mb in size for 26 of 29 autosomes. As a consequence, the total amount of sequence assigned to chromosomes was nearly identical in the three bird species (1.02–1.04 Gb), again testifying on an overall evolutionary stasis of avian chromosomes. We note that, exactly like for chicken and zebra finch, flycatcher chromosome 16 was difficult to sequence and assemble. The reason for the difficulty in sequencing and/or assembling this avian chromosome is to our knowledge not known.
Frequent intrachromosomal rearrangements during avian evolution
The evolutionary stability in the size and content of avian chromosomes stands in sharp contrast to frequent changes in the genomic organization within chromosomes (intrachromosomal rearrangements). We found a total of 343 inversions, which can explain the current organization of chromosomal segments in chicken, zebra finch and flycatcher (Table 4). As expected, most of these (203) can be traced back to the long lineage connecting chicken and the common ancestor of flycatcher and zebra finch in an unrooted tree. The number of rearrangements in the flycatcher and zebra finch lineages was 61 and 79, respectively, and can be readily seen in circular visualization of sequence homologies between the two species (Fig. 2). Based on these numbers, we estimate the rate of inversion at 1.5 (flycatcher lineage), 2.0 (zebra finch) and 1.7 (chicken-passeriform ancestor) events per My. This corresponds to rates of 0.0014–0.0019/My/Mb. We note that all three genome assemblies used for making this inference are based on genetic linkage data.
Table 4.
Number of intrachromosomal rearrangements (inversions) per chromosome in three avian lineages detected with a resolution of 50-kb synteny blocks
| Chromosome | Chicken | Zebra finch | Flycatcher |
|---|---|---|---|
| 1 + 1A | 29 | 11 | 18 |
| 2 | 9 | 10 | 6 |
| 3 | 18 | 6 | 4 |
| 4 + 4A | 33 | 5 | 2 |
| 5 | 11 | 3 | 3 |
| 6 | 8 | 1 | 0 |
| 7 | 4 | 5 | 1 |
| 8 | 6 | 1 | 1 |
| 9 | 5 | 1 | 0 |
| 10 | 2 | 0 | 1 |
| 11 | 8 | 4 | 0 |
| 12 | 6 | 1 | 0 |
| 13 | 3 | 0 | 0 |
| 14 | 6 | 1 | 1 |
| 15 | 4 | 1 | 0 |
| 17 | 0 | 1 | 0 |
| 18 | 4 | 2 | 0 |
| 19 | 2 | 1 | 0 |
| 20 | 5 | 1 | 2 |
| 21 | 4 | 2 | 0 |
| 22 | 3 | 0 | 0 |
| 23 | 5 | 2 | 0 |
| 24 | 5 | 2 | 0 |
| 25 | 0 | 0 | 4 |
| 26 | 4 | 2 | 3 |
| 27 | 2 | 2 | 3 |
| 28 | 7 | 2 | 1 |
| Z | 10 | 12 | 6 |
| Total | 203 | 79 | 61 |
Fig. 2.

Comparative circular visualization of the organization of homologous chromosomes in collared flycatcher and zebra finch. Collared flycatcher is shown to the left, zebra finch to the right. Scale is indicated on the zebra finch side of plots, in Mb.
The size of inversions was biased towards the lower end of detectable events (Supporting information Fig. S7), with median size of 3.34 Mb (chicken), 2.62 Mb (zebra finch) and 0.78 Mb (flycatcher). With the propensity for inversions to be short, it was clear that many events would have been missed with lower assembly continuity and at higher thresholds for minimum size of syntenic blocks. This was confirmed when we increased block size to 100, 250 kb or 1 Mb to make inference about the number of rearrangements (Supporting information Table S1); the total number of rearrangements decreased from 343 at the resolution of 50 kb to 87 at the resolution of 1 Mb. Accordingly, the estimated rates of inversion decreased from 1.5–2.0 to 0.2–0.5/My. This highlights the importance of the level of resolution for characterization of chromosome rearrangements.
Another way of quantifying the inversion rate is to also take the amount of inverted sequence into account. The total length of all inversions was 476.1 Mb (49.1% of the aligned sequence), 299.2 Mb (30.2%) and 265.4 Mb (26.3%) in the chicken-passeriform ancestor, zebra finch and flycatcher lineage, respectively. This gives inversion rates of 4.0, 7.5 and 6.6 Mb inverted DNA per My, respectively. Note that these numbers are based on the amount of unique sequence involved in rearrangements; the sequence of nested inversions was only considered once. Also note that the rate estimates cannot be expected to increase linearly with time as, with a constant rate of rearrangement, the amount of sequence not yet inverted will decrease over time. This may explain the lower rate estimate for the long chicken-passeriform ancestor branch.
We next examined chromosomal break points and sought to elucidate their characteristics. Here we used pairwise alignments between flycatcher and zebra finch to obtain higher resolution (due to the shorter evolutionary distance). One hundred sixty-five break point regions were identified, with a median size of 2.4 kb for measurable regions (see below; Supporting information Fig. S8). Of these, 28 regions were reused twice (17%). There was a very strong association between the location of scaffold junctions in the flycatcher assembly and chromosomal break points. If the 165 break points would have been randomly distributed in the genome, we should have expected to find <1 to coincide with the location of scaffold junctions. However, we observed 42 scaffold junctions inside break points, clearly showing that some regions of the genome are both resistant to sequence assembly and prone to chromosomal mutation.
The distribution of break points across the genome was nonrandom with clusters of multiple inversion events interspersed with large chromosomal regions of structural stasis (Fig. 3). There was a propensity for break points to be located towards the ends of chromosomes, with a significant deviation from a uniform distribution along chromosomes (Supporting information Fig. S9; goodness-of-fit test, chi-square = 22.46, d.f. = 9, P < 0.05). Moreover, there was a negative correlation between chromosome size and the rate of inversion per Mb (Wilcoxon's test, z = 6.06, P < 0.001). Furthermore, several genomic parameters differed significantly between break point regions and the rest of genome, including recombination rate (mean 5.83 vs. 3.25 cm/Mb, z = 5.74, P = 4.8 × 10⁻⁹), GC content (mean 0.513 vs. 0.416, z = 11.28, P = 1.6 × 10⁻²⁹) and repeat density (mean 0.221 vs. 0.096, z = 4.79, P = 8.4 × 10⁻⁷).
Fig. 3.
Genomic distribution of break point regions. Resolution is 50 kb synteny blocks in pairwise whole-genome alignments of flycatcher and zebra finch.
Recombination rate variation
With a high-density linkage map and a genome assembly with a high degree of sequence continuity along chromosomes, it is possible to obtain detailed recombination rate estimates across the flycatcher genome. We divided the genome into 200-kb windows and obser-ved a mean sex-averaged recombination rate of 3.1 ± 4.1 cm/Mb across windows. The genomic landscape of recombination was highly heterogeneous, with two major, large-scale trends of recombination rate variation. First, the mean recombination rate was considerably higher for small chromosomes than for large chromosomes (Table 5, Fig. 4). The rate was in excess of 10 cm/Mb for chromosomes <10 Mb; for the new linkage group Fal35, with only 230 kb of assembled sequence (and a genetic distance of 36.8 cm), recombination reached an extreme estimated rate of 160 cm/Mb. For the three chromosomes >100 Mb, the rate was uniformly ≈2.0 cm/Mb, while for chromosome size classes in the range of 10–100 Mb, recombination rate was intermediate and increased with decreasing chromosome size.
Table 5.
Mean (and standard deviation, SD) sex-average recombination rate per chromosome for different autosomal size categories. Also shown are recombination rates after 50 cm (corresponding to one obligate recombination event per chromosome) has been subtracted from the genetic length of each chromosome
| Recombination rate (cm/Mb) | Recombination rate (cm/Mb) after subtracting 50 cm | ||||
|---|---|---|---|---|---|
| Chromosomal size category | n | Mean | SD | Mean | SD |
| >100 Mb | 3 | 2.0 | 0.0 | 1.6 | 0.1 |
| 50–100 Mb | 3 | 2.7 | 0.3 | 2.0 | 0.3 |
| 25–50 Mb | 4 | 3.2 | 0.2 | 1.7 | 0.2 |
| 10–25 Mb | 11 | 4.5 | 0.9 | 1.5 | 0.7 |
| <10 Mb | 9 | 11.1 | 6.9 | —* | —* |
Most of these chromosomes have a genetic distance of <50 cm.
Fig. 4.
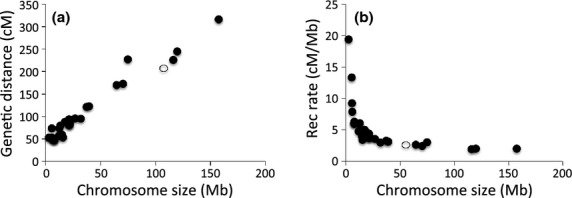
The relationship (a) between the genetic distance (cm) and the chromosome size (Mb) and (b) between recombination rate (cm/Mb) and the chromosome size (Mb) in the best-order map of the collared flycatcher genome. Open and filled circles are the Z chromosome and autosomes, respectively.
It is interesting to note that the effect of chromosome size on rate of recombination gradually diminished with increasing chromosome size. In fact, if subtracting 50 cm from the length of each linkage group (reflecting one obligate interchromatid crossing-over per chromosome, see Discussion) before calculating the chromosome-average recombination rate as map length divided by physical size, the rate of recombination seemed largely independent of chromosome size (Table 5) and increased with 1.5–2.0 cm for every Mb of increased physical size. In addition, it could also be noted from Fig. 4 that the mean recombination rate of the Z chromosome (2.7 cm/Mb over 60 Mb) as measured in male meiosis was very similar to that of similarly sized autosomes (chromosomes 1A, 4 and 5, sized 65–75 Mb, have a mean recombination rate of 2.7 cm/Mb).
Second, there was a significant increase in recombination rate towards chromosome ends, a pattern consistent irrespective of chromosome size (Fig. 5). For instance, the average recombination rate in the ends, defined as the distal 5.5 Mb of each chromosome end (see Material and methods and Supporting information Fig. S3 for motivation) of chromosomes 1–6 was 5.7 cm/Mb, while the internal regions of these chromosomes had a mean rate of 2.3 cm/Mb. Similarly, the average recombination rate at chromosome ends and interior regions of smaller chromosomes 7–28 was 7.0 and 2.4 cm/Mb, respectively.
Fig. 5.
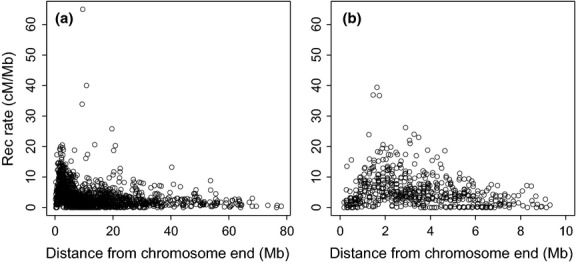
Scatter plot showing the recombination rate as a function of distance to chromosome end for (a) chromosomes >20 Mb and (b) chromsomes <20 Mb.
The total map length was on average 10% longer in males than females (3300 and 2997 cm in the best-order autosomal map, respectively; Wilcoxon's test for matched pair of windows, V = 104, P = 0.002). There was limited regional variation in sex-specific recombination rates (Supporting information Fig. S10); however, chromosomes 17 and 27 made exceptions by showing marked differences between the sexes in 2–3 Mb regions (Fig. 6; Table 1). To test whether these differences were repeatable, we divided the pedigree into six subsets of individuals (n = 100 each) and estimated sex-specific recombination rates in each subset. In chromosome 27, all six subsets showed larger total genetic distance in males (total genetic distance = 34.2∼76.4 cm in females and 81.0∼129.0 cm in males), and in chromosome 17, five of six subsets showed larger total genetic distance in males (total genetic distance = 59.1∼85.5 cm in females and 76.4∼89.9 cm in males). This suggests that there is a true signal of sex differences in recombination rate in these chromosomes.
Fig. 6.
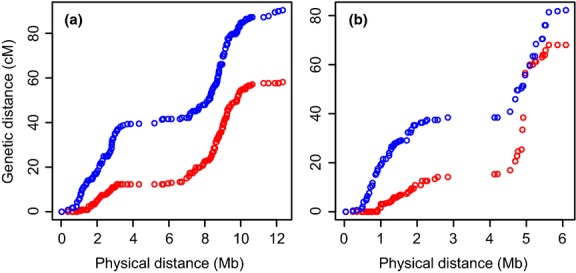
Sex-specific relationships between the genetic (cm) and the physical (Mb) distance in the best-order map of collared flycatcher chromosomes 17 (a) and 27 (b). Red and blue circles indicate the female- and male-specific genetic map, respectively.
In order to search for sequence motifs potentially associated with high recombination rates, we partitioned the rate between all marker pairs into two extreme classes, representing the regions with the 2.5% highest (‘hot regions’) and 2.5% lowest (‘cold regions’) rates. The previously described (Myers et al. 2008; Winckler et al. 2005) sequence motifs CCNCCNTNNCCNC and CCTCCCT associated with high recombination were both present at higher density (2.1 and 1.6 times, respectively) in the hot regions than in the cold regions, although this was not statistically significant. We also searched for enrichment of previously unidentified sequence motifs in hot regions, and, after correcting for redundancy and multiple testing, we found evidence for enrichment of six different sequence motifs 6–9 bp long: GATGAGATG, AATCAATC, GAAGGAGA, CCATATC, GGATCC and TCGAGG (Supporting information Table S2).
Several genomic parameters have previously been shown to be associated with recombination rate variation in other organisms (Coop & Przeworski 2007; Webster & Hurst 2012; Cutter & Payseur 2013). Focusing on chromosomes >20 Mb, we found significant pairwise correlations between recombination rate and chromosome size, distance to chromosome end (as shown for all chromosomes, described above), microsatellite density, sequence motif density and gene density (Table 6). To disentangle the relative effect of each of these parameters, we performed MLR analysis and PCR analysis using recombination rate as response variable. This showed that microsatellite density, motif density and distance to chromosome end explained most of the variation in recombination rate, while the impact of chromosome size, gene density and interspersed repeat density was of minor importance (Table 6). The relative limited effect of chromosome size was probably related to the fact that we only analysed chromosomes >20 Mb (see Discussion). The PCR further allowed us to disentangle two independent effects (PC I and PC II), which contributed separately to the variation in recombination rate (Table 6, Fig. 7). Distance to chromosome end clustered together with microsatellite and motif density in PC I. Chromosome size built the main contribution to PC II, which points towards an independent effect of chromosome size on the recombination rate.
Table 6.
Estimates (Est) and statistical significance (P-value) of multi-linear regression (MLR) analysis for six candidate explanatory variables of variation in recombination rate and GC content, respectively
| Recombination | GC content | |||||||
|---|---|---|---|---|---|---|---|---|
| Parameter | Est | P-value | r2 | PCR (%) | Est | P-value | r2 | PCR (%) |
| Distance to end | −0.069 | <10−15 | −0.37 | 5.37 | −0.048 | <10−15 | −0.42 | 12.21 |
| Chromosome size | −0.036 | <10−15 | −0.21 | 1.89 | −0.037 | <10−15 | −0.37 | 9.34 |
| Microsatellites | 0.002 | 0.67 | 0.23 | 5.75 | 0.107 | <10−15 | 0.58 | 13.21 |
| Repeat density | −0.001 | 0.81 | 0.01 | 2.60 | −0.059 | <10−15 | −0.11 | 10.24 |
| Motif density | 0.061 | <10−15 | 0.38 | 5.78 | 0.133 | <10−15 | 0.65 | 15.40 |
| Gene density | 0.022 | 9.0·10−9 | 0.09 | 0.78 | 0.073 | <10−15 | 0.29 | 5.52 |
| Total | 22.2 | 65.5 | ||||||
Included in the table is also the raw Pearson's pairwise correlation coefficient (r2) between each explanatory variable and recombination rate, and the amount of variation explained by each explanatory variable according to the principal component regression (PCR). Data are from chromosomes >20 Mb.
Fig. 7.
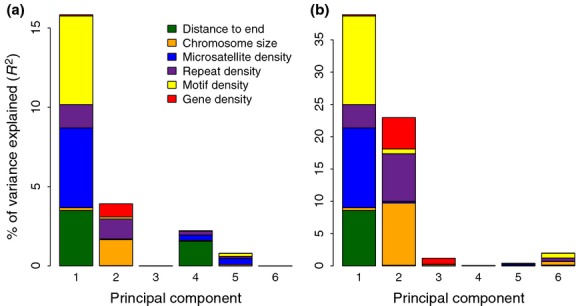
Barplot showing the fractions explained by each parameter in the principal component regression analysis with (a) recombination and (b) GC content as response variables. In each analysis, the proportional contribution of each explanatory variable was very similar, but the total amount of the variance explained was higher when using the GC content as a response variable (notice the difference in scaling of the y-axis).
Recombination rate conservation
A broad-scale overview of the recombination landscape in flycatcher compared to zebra finch and chicken is given in Fig. 8, which depicts the relationship between physical position and cumulative genetic map length for each chromosome. Clearly, the flycatcher landscape is more similar to that in chicken than to that in zebra finch. Although all three species show an increased recombination rate towards chromosome ends, this trend is much more pronounced in the zebra finch than in the other two species. This difference is reinforced by the very low rate of recombination in the interior regions of zebra finch chromosomes.
Fig. 8.

The relationship between the genetic (cm) and the physical (Mb) distance in the best-order map of the collared flycatcher genome (blue circle, this study), zebra finch (orange square, Backström et al. 2010a) and chicken (black cross, Groenen et al. 2009). For comparison purposes, chromosomes 1 and 4 in chicken were split into two chromosomes, corresponding, respectively, to chromosomes 1 and 1A, and chromosomes 4 and 4A, based on the zebra finch genome. Data were not available for chromosomes 2, 21, 22, 24, 26, 27 and 28 in zebra finch.
As recombination impacts the patterns of local base composition in avian genomes via GC-biased gene conversion (Mugal et al. 2013), GC content might be a good indicator of long-term global recombination rate variation. A correlation between GC content and current recombination rate might thus be indicative of long-term conservation in recombination rate varia-tion across the genome. This was indeed observed (r = 0.47, P < 10−15; Supporting information Fig. S11). In the light of this, we repeated the calculations of pairwise correlation, MLR and PCR using GC content as the response variable. MLR showed that motif density and microsatellite density explained most of the variation in GC content, followed by distance to chromosome end and chromosome size (Table 6). PCR showed that variation in GC content was explained by two major principal components, PC I was composed primarily of motif density, microsatellite density and distance to chromosome end while PC II was composed of chromosome size, repeat density and gene density (Table 6). This trend was thus consistent with the variation in pedigree-based recombination rate estimates. In fact, when recombination rate and GC content were used as a combined response variable, more than a half of the variation was explained by these variables.
Discussion
We have capitalized on the power of contemporary DNA sequencing technology to develop a high-resolution genetic map of the collared flycatcher genome. This allowed the construction of an improved genome assembly and downstream analyses of recombination rate variation and chromosomal evolution at high resolution. High-throughput sequencing was critical in the process of map construction for at least two reasons. First, markers for the map were well distributed across the genome. This owes to the fact that we had a draft assembly of the flycatcher genome, constructed using high-throughput sequencing but without physical mapping tools such as BAC or fosmid clones, from which suitably distributed markers could be selected. Second, the availability of polymorphism data from whole-genome resequencing of population samples meant that we could select highly variable markers. We also capitalized on new technology for the development of a genetic map with unusually high marker density in a nonmodel organism by performing array-based SNP genotyping using a custom 50 K SNP array, purposely developed for this endeavour (Kawakami et al. 2014).
By integrating high-density linkage map data with scaffold sequences from the draft genome assembly, we obtained a significantly improved assembly of the collared flycatcher genome. The assembly has 98.5% of the anchored sequence ordered and oriented along chromosomes and a super-scaffold N50 size of 20.2 Mb. It covers 33 autosomes and the Z chromosome, which compares well with the two Sanger-sequenced avian genomes [chicken: 28 autosomes with >0.1 Mb of assembled sequence (ICGSC 2004); zebra finch: 31 autosomes with >0.1 Mb of assembled sequence (Warren et al. 2010)].
The karyotype of collared flycatcher has not been characterized. For 25 other bird species of the order Passeriformes, chromosome number is in the range of 2n = 72–84, with 19 species showing 2n = 78–80 (which is also the most common number across the whole class of Aves; Gregory 2011). This could suggest that there are at most 5–6 small chromosomes for which we still have not anchored scaffolds to linkage groups. Compared to a random process of marker selection for genotyping, an informed strategy of using SNPs from the vast majority of all scaffolds was of obvious benefit for linkage-based scaffold ordering and orientation. Together, this illustrates that it is feasible to obtain a de novo assembly of a vertebrate genome with nearly continuous chromosome sequences, without additional genomic resources or molecular tools. The latter represents the default situation for essentially all nonmodel organisms.
A ‘core’ avian genome
It is known that birds show less variation in genome size than other amniote lineages (Griffin et al. 2007; Ellegren 2010). However, it is remarkable that with flycatcher now added to the avian genomes so far sequenced at high sequence continuity, all have assemblies of ≈1.10 Gb, with 1.02–1.04 Gb assigned to chromosomes (ICGSC 2004; Dalloul et al. 2010; Warren et al. 2010; Huang et al. 2013; Shapiro et al. 2013). Moreover, the amount of sequence assigned to syntenic chromosomes showed very limited variation among species (Table 2). This indicates that the overall DNA content of birds is highly conserved across divergent lineages, although there may be occasional genome size expansions from increased transposon activity in certain lineages (Organ & Edwards 2011). Cytometric estimates of total DNA content of birds vary more, between 1 and 2 pg and with the majority in the range 1.2–1.5 pg (1 pg ≈ 0.98 Gb; Gregory 2011). However, these estimates have been obtained by several different methods and are sensitive to calibration, experimental error and gender. For chicken, recent estimates tend to converge at 1.20–1.25 pg (Mendonca et al. 2010). It thus remains to be seen from other species how much genome size actually varies across birds; it may very well be that the variation is even more limited than previously indicated by cytometry.
The rate of chromosomal evolution in birds
It is clear that the avian karyotype has remained largely stable during the evolution of modern birds (Griffin et al. 2007; Ellegren 2010), which is in sharp contrast to frequent interchromosomal rearrangements occurring during, for example, mammalian evolution (Murphy et al. 2005). However, it is less clear whether the rate of intrachromosomal rearrangements also varies among vertebrate lineages and whether avian chromosomes are slowly evolving also in this respect. Quantitative analyses have largely been lacking, and comparisons among taxa are sensitive to methodology and resolution. Our data demonstrate that the rate of inversion in the sampled avian lineages (1.5–2.0 inversion per My) is similar to many mammalian lineages analysed with the same algorithms and resolution (Supporting information Table S3). In fact, if one takes into account that the DNA content of avian genomes is generally <50% of that of mammalian genomes, the rate of inversions per Mb is higher in the sampled avian lineages than in many mammals, like primates (Zhao & Bourque 2009). Thus, a stable avian karyotype does not translate into an overall stability of the organization within bird chromosomes.
Variation in the rate of inversion from 1.5 events per My (flycatcher lineage) to 2.0 events per My (zebra finch) gives some indication that there is rate variation among avian lineages for intrachromosomal rearrangements, just as there is substitution rate variation; for example, for the two avian orders in focus here, the substitution rate in Passeriformes is higher than in Galliformes (Nam et al. 2010; Nabholz et al. 2011). There are rare examples of avian species/families with unusually small (2n = 40–50) or large (2n = 130–140) number of chromosomes (Gregory 2011), and it will be interesting to see whether the dynamic karyotype evolution (with fusions and fissions) in these lineages is associated with a high rate of intrachromosomal rearrangements.
Birds have less repetitive DNA than other amniotes, with a repeat content of the avian genomes so far sequenced of ≈10% (ICGSC 2004; Dalloul et al. 2010; Warren et al. 2010; Ellegren et al. 2012). It has been tempting to associate the karyotypic stability of birds with the low repeat content under the scenario that fewer (transposable) repeats provide less opportunity for nonallelic homologous recombination (Burt et al. 1999). However, why then would the rate of inversion be at least as high in birds as in repeat-rich mammalian genomes? One explanation could be that the role of repeats in mediating chromosomal mutations differs between inversions and interchromosomal rearrangements, such as translocations or fusions/fissions. However, there is strong evidence for the involvement of transposable elements in generating inversions, consistent with our observation of increased repeat density in avian intrachromosomal break points (Kidd et al. 2008; Lee et al. 2008; Zhao & Bourque 2009). Moreover, repetitive sequences such as gene duplicates, gene clusters or other forms of segmental duplications (Armengol et al. 2003; Bailey et al. 2004; Zhao & Bourque 2009) are frequently found at sites of break points, including in birds (Dalloul et al. 2010; Völker et al. 2010). This suggests that karyotypic evolution is unrelated to repeat density and that the conserved chromosome structure so characteristic for birds owes to other factors. Perhaps the mechanisms of chromosome replication, recombination or segregation at avian meiosis are less prone to interchromosomal rearrangements in the first place. Alternatively, the negative fitness effects of such mutations could be more severe than in other vertebrate lineages, meaning that they are to a larger extent removed by selection in birds.
It is interesting to note that despite a stable karyotype, there has been a dynamic process of sequences changing their relative position within chromosomes during avian evolution. For example, since the split of flycatcher and zebra finch lineages 40 My ago, 25–30% of all sequence has been repositioned by inversions. This provides an unusual opportunity to compare molecular evolutionary parameters between sequences that have remained in the same chromosomal position for a long time and sequences that have become integrated into another context of the genomic landscape, yet remaining on the same chromosome. This includes aspects such as the evolution of base composition, substitution rates and recombination rates.
Characteristics of chromosomal break points
Previous work has suggested that chromosomal break points are reused during evolution, representing hot spot regions for chromosome instability (Pevzner & Tesler 2003; Larkin et al. 2009; Skinner & Griffin 2012). However, the case for evolutionary reuse of break points is an issue of discussion (Sankoff & Trinh 2005; Peng et al. 2006; Alekseyev & Pevzner 2007) and may in the end be a matter of resolution (Becker & Lenhard 2007; Larkin et al. 2009; Attie et al. 2011). Still, our results demonstrate a concentration of break points to certain regions of the avian genome with 17% of break point regions being reused. Observations of independently occurring rearrangements at approximately the same chromosomal position in different avian lineages have generally been made with much lower resolution than applied herein (Griffin et al. 2007; Kemkemer et al. 2009; Dalloul et al. 2010; Völker et al. 2010; Skinner & Griffin 2012), and cannot unambiguously distinguish between reuse of sites or regions. Our data point at the former as the observed break points were generally small (median size 2.4 kb).
Molecular evolutionary analyses often reveal that several genomic parameters are interrelated. Similarly, we found several parameters to correlate with the location of chromosomal break points in the flycatcher–zebra finch comparison, including recombination rate, distance to chromosome end, chromosome size, repeat density and GC content. Although it is difficult to dissect the causal relationships between these correlations, we note that recombination events as well as chromosome rearrangements are initiated by the formation of double-strand breaks (DSBs; Baudat et al. 2013). An association between recombination rate and chromosomal break points has been independently demonstrated in a comparison of the chicken and turkey genomes (Völker et al. 2010).
The role of chromosome rearrangements during avian evolution
Chromosomal speciation models posit that rearrangements distinguishing diverging populations will promote speciation via underdominance (due to fitness reduction of unbalanced gametes in heterozygotes; White 1973; Rieseberg 2001) or by reducing interspecific recombination in the rearranged regions hindering gene flow and facilitating the build-up of genetic incompatibilities (Noor et al. 2001; Navarro & Barton 2003; Coyne & Orr 2004; Kirkpatrick & Barton 2006). Genomic rearrangements may also be important for local adaptation by bringing functionally related loci together (Yeaman 2013). Empirical evidence that suppressed recombination in regions of inversions is associated with speciation is accumulating in both animals and plants (Hoffmann & Rieseberg 2008; Nachman & Payseur 2012). However, there are so far only few, if any, well-documented examples of inversions contributing to speciation in birds. On the other hand, inversion polymorphisms associated with distinct phenotypic differences have been detected, like a nearly 100 Mb inversion in one of the macrochromosomes of the white-throated sparrow (Zonotrichia albicollis) associated with a suite of traits including behavioural phenotypes (Thorneycroft 1966; Thomas et al. 2008).
Diversification rates are likely to differ over time, and estimating speciation rates is notoriously difficult, even for the most recent divergences. Speciation durations in both mammals and birds may entail at least 2 million years on average (Avise et al. 1998; Coyne & Orr 2004), and the loss of hybrid fertility in birds may be of the order of millions of years (Price & Bouvier 2002; Fitzpatrick 2004). We thus note that the observed rate of intrachromosomal rearrangements (1.5–2.0/My) has been sufficiently high for inversions to potentially play a significant role in the build-up of reproductive incompatibility in birds. We encourage further research on the genetics of speciation in birds that specifically seek to address this question.
Recombination rates in the flycatcher genome
The considerable variation in chromosome size in avian genomes is associated with systematic variation in chromosome-specific recombination rates: recombination rate shows a clear increase with decreasing chromosome size (ICGSC 2004; Stapley et al. 2008; Backström et al. 2010a). There is evidence from several organisms of one obligate crossing-over per chromosome, often thought to be necessary for proper segregation of chromosomes at meiosis (Fledel-Alon et al. 2009; Wang et al. 2012). The observation that the intercept of a linear correlation between flycatcher chromosome size and genetic length was at ≈50 cm (Fig. 4a) shows that a genetic distance of 50 cm applies regardless of the size of chromosomes and leads to very high rates of recombination per physical unit of DNA. This is entirely consistent with our observations: both MLR and PCR showed that chromosome size had a strong impact on the rate of recombination. When 50 cm was subtracted from the genetic length of each chromosome (reflecting the genetic length accrued by one crossing-over), we found that recombination rate was nearly constant across chromosomes and thus independent of chromosome size. This would suggest that the number of additional recombination events per chromosome solely reflects variation in chromosome size and need not be related to inherent differences among chromosomes in the rate of recombination per physical unit of DNA.
Many species across different groups of organisms are heterochiasmic; that is, they show genome-wide differences in the sex-specific rates of recombination (Burt et al. 1991; Lenormand 2003; Lenormand & Dutheil 2005). The observation of on average 10% higher recombination in flycatcher males than in females is in line with the idea that suppressed sex chromosome recombination in the heterogametic sex somehow ‘spill over’ on autosomes, to reduce the genome-wide rate of recombination in that sex (Burt et al. 1991). However, there are exceptions to this and there are also several alternative explanations to why sex differences in recombination evolve (Otto & Lenormand 2002; Lenormand 2003; Hansson et al. 2005). One interesting possibility is that epistatic interactions between loci can favour the spread of sexually antagonistic alleles when recombination differs between males and females (Mank 2009; Connallon & Clark 2010; Wyman & Wyman 2013). Under this scenario, one could potentially expect localized regions with pronounced sex differences in the rate of recombination, such as on flycatcher chromosomes 17 and 27 in collared flycatcher and as chromosomes 9 and 19 in humans (Kong et al. 2010), as candidate regions under sexually antagonistic selection.
The recombination rate of the Z chromosome (2.7 cm/Mb) was essentially identical to that of similarly sized autosomes. Birds have female heterogamety (males ZZ, females ZW), so the Z chromosome does not recombine in females, with exception of the pseudoautosomal region, and the estimated rate comes from male meiosis only. The effective recombination rate of the Z chromosome is thus 2/3 × 2.7 = 1.8 cm/Mb (not ½ × 2.7 as two of the three potentially transmitted Z chromosome per breeding pair will recombine, Lohmueller et al. 2010). Moreover, this is independent of any difference in the effective population size of males and females, and of the female-to-male breeding ratio. Sex chromosomes are often considered as hot spots for speciation, that is the large-X effect (Coyne & Orr 2004) or Coyne's rule (Turelli & Moyle 2007). One of several explanations for this is that the rate of recombination of the X/Z chromosome is lower than of autosomes due to reduced recombination in the heterogametic sex, thereby facilitating the maintenance of combinations of diverged gene variants (see Qvarnstrom & Bailey 2008). However, our quantitative analysis shows that the effective recombination rate of the Z chromosome is not much different from the sex-averaged rate of the three largest chromosomes (2.0 cm/Mb), which encompass more than 35% of the flycatcher genome. If generally applicable, this would suggest that the large-X effect mainly attributes to other factors, such as dominance (Coyne & Orr 2004).
The unusual heterogeneity in the rate of recombination in avian genomes, in particular the high rate of recombination in microchromosomes, will impact on several aspects of molecular ecological and molecular evolutionary analyses. For example, higher marker densities will be required for detection of linkage in regions with high recombination rate in QTL mapping and genome-wide association studies. However, when this is done, causative loci are likely to be in closer physical vicinity to assayed markers in those high recombination rate regions than in low recombination rate regions. Another aspect is that a heterogeneous recombination landscape can provide increased power in detecting correlations between the rate of recombination and genomic parameters potentially associated with recombination. For example, recombination rate is expected to correlate with both nucleotide diversity and the rate of protein evolution, in the latter case related to the efficacy of selection (Webster & Hurst 2012). Much focus is currently put on the question whether Hill–Robertson interference – the counteracting effect on genetic variation at linked sites by selection – is mainly caused by selective sweeps for advantageous alleles or background selection against slightly deleterious mutations (Campos et al. 2014). Avian genomic data may be useful in resolving this issue, by comparing sequence evolution in regions with markedly different recombination rates.
Conservation of rates and patterns of recombination
Comparative studies provide evidence for a phylogenetic signal in recombination rate variation among species (i.e. conservation of recombination rates; Dumont & Payseur 2008, 2011; Smukowski & Noor 2011; Segura et al. 2013). In line with this, we previously found that the rate of recombination in orthologous regions of the chicken and zebra finch genomes was correlated (Backström et al. 2010a). The strong correlation between GC content and flycatcher recombination rate seen in the present study is consistent with long-term conservation of the recombination landscape in birds, with GC-biased gene conversion driving GC content in regions of high recombination. However, there is also evidence from other studies that the total amount of recombination can vary among related species, or even subspecies (Dumont et al. 2011). For example, the length of the human genetic map is more than two times longer than that of mouse and rat (Jacob et al. 1995; Dietrich et al. 1996; Cox et al. 2009), although genome size is only 10% larger in humans than in rodents. With one obligate crossing-over per chromosome or chromosome arm (Pardo-Manuel de Villena & Sapienza 2001), variation in number of chromosomes or number of chromosome arms can explain at least part of the variation in total amount of recombination among species, as is the case in the comparison of primates and rodents. We found that the total amount of recombination in flycatcher was 200% of that of zebra finch despite both species belonging to the same order of birds and their karyotypes probably being very similar. In contrast, the amount of recombination in flycatcher was similar to that in the more distantly related chicken (Groenen et al. 2009); chicken and flycatcher lineages diverged about 80 My ago (Nabholz et al. 2011). Our data thus point both at long-term conservation in the amount of avian recombination and that there can be relatively short-term changes.
Domestication may select for increased recombination by favouring the generation of new haplotypes and new gene combinations in the face of drastically changed selection pressures (Burt & Bell 1987; Ross-Ibarra 2004). It has been hypothesized that this could explain the higher total amount of recombination in chicken (and turkey, which appears similar to chicken with respect to recombination, Aslam et al. 2010) than in zebra finch (Backström et al. 2010a; van Oers et al. 2014). However, with similar recombination rates in chicken and flycatcher, our data do not support this hypothesis. If anything, the fact that zebra finch linkage map data come from birds held in captivity for many generations does not support increased recombination as a response to artificial selection. It has also been suggested that passerine birds would have lower recombination rates than galliforms (van Oers et al. 2014), a view tentatively supported by low-density linkage map data from some species (Åkesson et al. 2007; Hansson et al. 2009; Jaari et al. 2009; van Oers et al. 2014). This might be true although it was not supported by our data as both flycatcher and zebra finch belong to the order Passeriformes. In general, we caution against taking interpretations from low-density linkage maps of species without an assembled genome sequence too far. With increased recombination rate towards chromosome ends, which might not necessarily be covered in linkage maps based on random markers, and by an additional 50 cm added to the total map length for every inclusion of another microchromosome, low-density linkage maps may grossly underestimate the total amount of recombination.
Although homologous chromosomes of flycatcher and chicken are differently organized due to inversions, the broad-scale recombination landscape in these two distantly related birds was similar (Fig. 8). This stands in sharp contrast to the recombination landscape in zebra finch. Large zebra finch chromosomes are characterized by the presence of extensive recombination desserts spanning the most of the interior parts of these chromosomes, not seen in flycatcher (Stapley et al. 2008; Backström et al. 2010a). As much as 80% of the total amount of recombination is concentrated on the 20% distal parts of several large chromosomes. Although there is an increase in recombination rate towards the ends of chromosomes in flycatcher and chicken, this effect is far from as dramatic as in zebra finch (Supporting information Table S4). As far as we aware of, it is not known what factors may affect differences in the distribution of crossing-over events along chromosomes in birds. It could be noted that the Prdm9 gene, which plays a critical role in mammalian recombination, appears to be lacking in avian genomes (Ponting 2011).
Perspectives and conclusions
Developments in the use of genetic approaches for addressing ecological and evolutionary questions in Ficedula flycatchers well illustrate the overall developments in the field of molecular ecology and provide a timeline for its progress. For the Ficedula system, this began about 25 years ago with the analysis of allozymes and restriction fragment length polymorphisms of pied flycatcher mtDNA (Gelter et al. 1989; Tegelstrom & Gelter 1990), and was soon followed by the introduction of microsatellite (Ellegren 1991, 1992) and DNA fingerprinting markers (Gelter & Tegelstrom 1992; Ratti et al. 1995). Questions at this time were mainly related to behavioural ecology, like the fitness return of EPP, but also focused on speciation and hybridization. It also included tests of sex allocation theory, using PCR-based approaches for molecular sexing (Ellegren et al. 1996; Sheldon & Ellegren 1996). DNA sequencing of flycatcher mtDNA came into use around year 2000 (Saetre et al. 2001) and provided phylogenetic perspectives and increased resolution for the detection of hybridization between flycatcher species. This was subsequently augmented with the use of nuclear single-nucleotide polymorphisms, SNPs (Primmer et al. 2002), and opened a venue for studying gene flow, introgression and population structure in further detail (Saetre et al. 2003; Borge et al. 2005; Lehtonen et al. 2009). In the mid of the last decade, genetic mapping efforts of flycatchers began and introduced a genomic perspective, although the genome itself was considered only far away in the horizon (Backström et al. 2006, 2008, 2010b). However, the tremendous power offered by next-generation sequencing technology meant that a draft sequence of the collared flycatcher genome could be presented in 2012 (Ellegren et al. 2012), providing novel insights into genomic divergence during lineage splitting. Moreover, this provided a platform for genome-wide studies of gene expression (Uebbing et al. 2013) and flycatcher population history (Nadachowska-Brzyska et al. 2013). Furthermore, recent proteomic analysis suggests that functional genomic studies are on their way (Leskinen et al. 2012). All in all, this makes Ficedula flycatcher a prime model organism in molecular ecology.
This study provides a genome assembly with nearly continuous chromosome sequences and a detailed genetic map of the flycatcher genome. Together, this information allowed us to conclude that the highly conserved nature of the avian karyotype stands in sharp contrast to the observation of frequent intrachromosomal rearrangements during avian evolution. The rate of these rearrangements is high enough for inversions to potentially have been involved with many events of speciation. We envision that this idea could be tested by mapping inversion events onto a phylogeny of closely related species of birds. Moreover, we found significant variation in the rate of recombination across the genome and concluded that the large effect of chromosome size could mainly be explained by obligate recombination events per chromosome. Surprisingly, the overall level and patterns of flycatcher recombination were more similar to chicken than to the more closely related zebra finch.
We recently showed that the genomic landscape of divergence between pied and collared flycatchers is characterized by the presence on numerous ‘differentiation islands’, with markedly higher FST than in the genomic background (Ellegren et al. 2012). This observation was based on data from whole-genome resequencing of a relatively limited number of individuals of each species. A direction that now should be taken is to sequence multiple sympatric and allopatric populations of both species, and with these, data integrate information on recombination rate variation across the genome. This would allow addressing whether differentiation islands in multiple population comparisons coincide with recombination cold-spot regions. Such association would be compatible with a scenario of incidental islands where selection at linked sites locally reduces the effective population size and thereby enhances the rate of lineage sorting. Essentially, this means distinguishing a scenario of genomic islands of speciation from a scenario of genomic islands and speciation, quoting Turner & Hahn (2010).
Acknowledgments
Financial support was obtained from the European Research Council, a Knut and Alice Wallenberg Scholar Grant and the Swedish Research Council. Genotyping was performed by the SNP&SEQ Technology Platform, Science for Life Laboratory at Uppsala University, and a national infrastructure supported by the Swedish Research Council (VR-RFI) and the Knut and Alice Wallenberg Foundation.
Data accessibility
ficalb1.5 assembly version of the collared flycatcher genome: GenBank AGTO02000000. SNP markers used in the array: dbSNP ss_974710772–974751664. Individual genotypes used for linkage analysis: Dryad doi:10.5061/dryad.v0v83.
Supporting information
Additional supporting information may be found in the online version of this article
Fig. S1 Overview of the collared flycatcher pedigree structure used for linkage analysis.
Fig. S2 Correlation dendrogram of the six genomic parameters used as candidate explanatory variables for variation in recombination rate.
Fig. S3 Relationship between the recombination rate and distance to chromosome end (both log10 scaled).
Fig. S4 Best-order linkage map of the collared flycatcher genome.
Fig. S5 Super-scaffolds and singleton scaffolds in the collared flycatcher genome assembly version ficalb1.5.
Fig. S6 Schematic illustration of syntenic relationships between chicken (white), flycatcher (blue) and zebra finch (black) chromosomes.
Fig. S7 Size distribution of inversion events.
Fig. S8 Size distribution of breakpoint regions between syntenic blocks of 50 kb in pairwise whole-genome alignment of flycatcher and zebra finch.
Fig. S9 Number of inversion events in relation to the relative distance to chromosome end detected at a resolution of 50 kb syntenic blocks in pairwise whole-genome alignment of flycatcher and zebra finch.
Fig. S10 The relationship between the genetic (cm) and the physical (Mb) distance in the best-order map of the collared flycatcher genome.
Fig. S11 The relationship between GC-content and recombination rate after Z-transformation of log-transformed variables.
Table S1 Number and rate (events per million years) of intrachromosomal rearrangements (inversions) in three avian lineages in relation to the size of minimum synteny block size considered.
Table S2 The number of occurrences per kb (real numbers within parentheses) of all six significantly enriched sequence motifs in the regions with highest (hot regions; 792 952 bp) and lowest recombination rate (cold regions; 39 730 478 bp).
Table S3 Rate of inversion in different avian and mammaliana lineages.
Table S4 Mean recombination rate (cm/Mb) in distal (<15 Mb from chromosome ends) and central parts (>15 Mb from chromosome ends) of chromosomes larger than 50 Mb in three bird species.
Appendix S1 Supplementary methods.
References
- Åkesson M, Hansson B, Hasselquist D, Bensch S. Linkage mapping of AFLP markers in a wild population of great reed warblers: importance of heterozygosity and number of genotyped individuals. Molecular Ecology. 2007;16:2189–2202. doi: 10.1111/j.1365-294X.2007.03290.x. [DOI] [PubMed] [Google Scholar]
- Alekseyev MA, Pevzner PA. Are there rearrangement hotspots in the human genome? PLoS Computational Biology. 2007;3:e209. doi: 10.1371/journal.pcbi.0030209. [DOI] [PMC free article] [PubMed] [Google Scholar]
- Armengol LS, Pujana MA, Cheung J, Scherer SW, Estivill X. Enrichment of segmental duplications in regions of breaks of synteny between the human and mouse genomes suggest their involvement in evolutionary rearrangements. Human Molecular Genetics. 2003;12:2201–2208. doi: 10.1093/hmg/ddg223. [DOI] [PubMed] [Google Scholar]
- Aslam M, Bastiaansen J, Crooijmans R, et al. A SNP based linkage map of the turkey genome reveals multiple intrachromosomal rearrangements between the turkey and chicken genomes. BMC Genomics. 2010;11:647. doi: 10.1186/1471-2164-11-647. [DOI] [PMC free article] [PubMed] [Google Scholar]
- Attie O, Darling A, Yancopoulos S. The rise and fall of breakpoint reuse depending on genome resolution. BMC Bioinformatics. 2011;12:S1. doi: 10.1186/1471-2105-12-S9-S1. [DOI] [PMC free article] [PubMed] [Google Scholar]
- Avise JC, Walker D, Johns GC. Speciation durations and Pleistocene effects on vertebrate phylogeography. Proceedings of the Royal Society of London. Series B: Biological Sciences. 1998;265:1707–1712. doi: 10.1098/rspb.1998.0492. [DOI] [PMC free article] [PubMed] [Google Scholar]
- Backström N, Brandstrom M, Gustafsson L, et al. Genetic mapping in a natural population of collared flycatchers (Ficedula albicollis): conserved synteny but gene order rearrangements on the avian Z chromosome. Genetics. 2006;174:377–386. doi: 10.1534/genetics.106.058917. [DOI] [PMC free article] [PubMed] [Google Scholar]
- Backström N, Karaiskou N, Leder EH, et al. A gene-based genetic linkage map of the collared flycatcher (Ficedula albicollis) reveals extensive synteny and gene-order conservation during 100 million years of avian evolution. Genetics. 2008;179:1479–1495. doi: 10.1534/genetics.108.088195. [DOI] [PMC free article] [PubMed] [Google Scholar]
- Backström N, Forstmeier W, Schielzeth H, et al. The recombination landscape of the zebra finch Taeniopygia guttata genome. Genome Research. 2010a;20:485–495. doi: 10.1101/gr.101410.109. [DOI] [PMC free article] [PubMed] [Google Scholar]
- Backström N, Palkopoulou E, Qvarnstrom A, Ellegren H. No evidence for Z-chromosome rearrangements between the pied flycatcher and the collared flycatcher as judged by gene-based comparative genetic maps. Molecular Ecology. 2010b;19:3394–3405. doi: 10.1111/j.1365-294X.2010.04742.x. [DOI] [PubMed] [Google Scholar]
- Bailey J, Baertsch R, Kent W, Haussler D, Eichler E. Hotspots of mammalian chromosomal evolution. Genome Biology. 2004;5:R23. doi: 10.1186/gb-2004-5-4-r23. [DOI] [PMC free article] [PubMed] [Google Scholar]
- Baudat F, Imai Y, de Massy B. Meiotic recombination in mammals: localization and regulation. Nature Reviews Genetics. 2013;14:794–806. doi: 10.1038/nrg3573. [DOI] [PubMed] [Google Scholar]
- Baudet C, Lemaitre C, Dias Z, et al. Cassis: detection of genomic rearrangement breakpoints. Bioinformatics. 2010;26:1897–1898. doi: 10.1093/bioinformatics/btq301. [DOI] [PMC free article] [PubMed] [Google Scholar]
- Becker T, Lenhard B. The random versus fragile breakage models of chromosome evolution: a matter of resolution. Molecular Genetics and Genomics. 2007;278:487–491. doi: 10.1007/s00438-007-0287-0. [DOI] [PubMed] [Google Scholar]
- Borge T, Lindroos K, Nadvornik P, Syvänen AC, Saetre GP. Amount of introgression in flycatcher hybrid zones reflects regional differences in pre and post-zygotic barriers to gene exchange. Journal of Evolutionary Biology. 2005;18:1416–1424. doi: 10.1111/j.1420-9101.2005.00964.x. [DOI] [PubMed] [Google Scholar]
- Bourque G, Pevzner PA. Genome-scale evolution: reconstructing gene orders in the ancestral species. Genome Research. 2002;12:26–36. [PMC free article] [PubMed] [Google Scholar]
- Burt A, Bell G. Mammalian chiasma frequencies as a test of two theories of recombination. Nature. 1987;326:803–805. doi: 10.1038/326803a0. [DOI] [PubMed] [Google Scholar]
- Burt A, Bell G, Harvey PH. Sex-differences in recombination. Journal of Evolutionary Biology. 1991;4:259–277. [Google Scholar]
- Burt DW, Bruley C, Dunn IC, et al. The dynamics of chromosome evolution in birds and mammals. Nature. 1999;402:411–413. doi: 10.1038/46555. [DOI] [PubMed] [Google Scholar]
- Butlin RK. Recombination and speciation. Molecular Ecology. 2005;14:2621–2635. doi: 10.1111/j.1365-294X.2005.02617.x. [DOI] [PubMed] [Google Scholar]
- Campos JL, Halligan DL, Haddrill PR, Charlesworth B. The relation between recombination rate and patterns of molecular evolution and variation in Drosophila melanogaster. Molecular Biology and Evolution. 2014;31:1010–1028. doi: 10.1093/molbev/msu056. [DOI] [PMC free article] [PubMed] [Google Scholar]
- Connallon T, Clark AG. Sex linkage, sex-specific selection, and the role of recombination in the evolution of sexually dimorphic gene expression. Evolution. 2010;64:3417–3442. doi: 10.1111/j.1558-5646.2010.01136.x. [DOI] [PMC free article] [PubMed] [Google Scholar]
- Consortium HG. Butterfly genome reveals promiscuous exchange of mimicry adaptations among species. Nature. 2012;487:94–98. doi: 10.1038/nature11041. [DOI] [PMC free article] [PubMed] [Google Scholar]
- Coop G, Przeworski M. An evolutionary view of human recombination. Nature Reviews Genetics. 2007;8:23–34. doi: 10.1038/nrg1947. [DOI] [PubMed] [Google Scholar]
- Cox A, Ackert-Bicknell CL, Dumont BL, et al. A new standard genetic map for the laboratory mouse. Genetics. 2009;182:1335–1344. doi: 10.1534/genetics.109.105486. [DOI] [PMC free article] [PubMed] [Google Scholar]
- Coyne JA, Orr HA. Speciation. Sunderland, Massachusetts: Sinauer Associates, Inc; 2004. [Google Scholar]
- Cutter AD, Payseur BA. Genomic signatures of selection at linked sites: unifying the disparity among species. Nature Reviews Genetics. 2013;14:262–274. doi: 10.1038/nrg3425. [DOI] [PMC free article] [PubMed] [Google Scholar]
- Dalloul RA, Long JA, Zimin AV, et al. Multi-platform next-generation sequencing of the domestic turkey Meleagris gallopavo: genome assembly and analysis. PLoS Biology. 2010;8:e1000475. doi: 10.1371/journal.pbio.1000475. [DOI] [PMC free article] [PubMed] [Google Scholar]
- Darling AE, Mau B, Perna NT. progressiveMauve: multiple genome alignment with gene gain, loss and rearrangement. PLoS ONE. 2010;5:e11147. doi: 10.1371/journal.pone.0011147. [DOI] [PMC free article] [PubMed] [Google Scholar]
- Dietrich WF, Miller J, Steen R, et al. A comprehensive genetic map of the mouse genome. Nature. 1996;380:149–152. doi: 10.1038/380149a0. [DOI] [PubMed] [Google Scholar]
- Dumont BL, Payseur BA. Evolution of the genomic rate of recombination in mammals. Evolution. 2008;62:276–294. doi: 10.1111/j.1558-5646.2007.00278.x. [DOI] [PubMed] [Google Scholar]
- Dumont BL, Payseur BA. Evolution of the genomic recombination rate in murid rodents. Genetics. 2011;187:643–657. doi: 10.1534/genetics.110.123851. [DOI] [PMC free article] [PubMed] [Google Scholar]
- Dumont BL, White MA, Steffy B, Wiltshire T, Payseur BA. Extensive recombination rate variation in the house mouse species complex inferred from genetic linkage maps. Genome Research. 2011;21:114–125. doi: 10.1101/gr.111252.110. [DOI] [PMC free article] [PubMed] [Google Scholar]
- Duret L, Arndt PF. The impact of recombination on nucleotide substitutions in the human genome. PLoS Genetics. 2008;4:e1000071. doi: 10.1371/journal.pgen.1000071. [DOI] [PMC free article] [PubMed] [Google Scholar]
- Ellegren H. DNA typing of museum birds. Nature. 1991;354:113. doi: 10.1038/354113a0. [DOI] [PubMed] [Google Scholar]
- Ellegren H. Polymerase chain reaction (PCR) analysis of microsatellites—a new approach to studies of genetic relationships in birds. Auk. 1992;109:886–895. [Google Scholar]
- Ellegren H. Evolutionary stasis: the stable chromosomes of birds. Trends in Ecology & Evolution. 2010;25:283–291. doi: 10.1016/j.tree.2009.12.004. [DOI] [PubMed] [Google Scholar]
- Ellegren H. The evolutionary genomics of birds. Annual Review of Ecology, Evolution, and Systematics. 2013;44:239–259. [Google Scholar]
- Ellegren H. Genome sequencing and population genomics in non-model organisms. Trends in Ecology & Evolution. 2014;29:51–63. doi: 10.1016/j.tree.2013.09.008. [DOI] [PubMed] [Google Scholar]
- Ellegren H, Gustafsson L, Sheldon BC. Sex ratio adjustment in relation to paternal attractiveness in a wild bird population. Proceedings of the National Academy of Sciences of the United States of America. 1996;93:11723–11728. doi: 10.1073/pnas.93.21.11723. [DOI] [PMC free article] [PubMed] [Google Scholar]
- Ellegren H, Sméds L, Burri R, et al. The genomic landscape of species divergence in Ficedula flycatchers. Nature. 2012;491:756–760. doi: 10.1038/nature11584. [DOI] [PubMed] [Google Scholar]
- Fitzpatrick BM. Rates of evolution of hybrid inviability in birds and mammals. Evolution. 2004;58:1865–1870. doi: 10.1111/j.0014-3820.2004.tb00471.x. [DOI] [PubMed] [Google Scholar]
- Fledel-Alon A, Wilson DJ, Broman K, et al. Broad-scale recombination patterns underlying proper disjunction in humans. PLoS Genetics. 2009;5:e1000658. doi: 10.1371/journal.pgen.1000658. [DOI] [PMC free article] [PubMed] [Google Scholar]
- Gelter HP, Tegelstrom H. High-frequency of extra-pair paternity in Swedish pied flycatchers revealed by allozyme electrophoresis and DNA fingerprinting. Behavioral Ecology and Sociobiology. 1992;31:1–7. [Google Scholar]
- Gelter HP, Tegelstrom H, Stahl G. Allozyme similarity between the pied and collared flycatchers (Aves, Ficedula-hypoleuca and Ficedula-albicollis. Hereditas. 1989;111:65–72. [Google Scholar]
- Green P, Falls K, Crook S. Documentation for CRIMAP, Version 2.4. St. Louis, Missouri: Washington Univ. School of Medicine; 1990. [Google Scholar]
- Gregory TR. 2011. Animal genome size database. Available from http://www.genomesize.com.
- Griffin DK, Robertson LBW, Tempest HG, Skinner BM. The evolution of the avian genome as revealed by comparative molecular cytogenetics. Cytogenetic and Genome Research. 2007;117:64–77. doi: 10.1159/000103166. [DOI] [PubMed] [Google Scholar]
- Groenen MAM, Wahlberg P, Foglio M, et al. A high-density SNP-based linkage map of the chicken genome reveals sequence features correlated with recombination rate. Genome Research. 2009;19:510–519. doi: 10.1101/gr.086538.108. [DOI] [PMC free article] [PubMed] [Google Scholar]
- Gustafsson L, Qvarnström A, Sheldon BC. Trade-offs between life-history traits and a secondary sexual character in male collared flycatchers. Nature. 1995;375:311–313. [Google Scholar]
- Hansson B, Akesson M, Slate J, Pemberton JM. Linkage mapping reveals sex-dimorphic map distances in a passerine bird. Proceedings of the Royal Society B: Biological Sciences. 2005;272:2289–2298. doi: 10.1098/rspb.2005.3228. [DOI] [PMC free article] [PubMed] [Google Scholar]
- Hansson B, Ljungqvist M, Dawson DA, et al. Avian genome evolution: insights from a linkage map of the blue tit (Cyanistes caeruleus. Heredity. 2009;104:67–78. doi: 10.1038/hdy.2009.107. [DOI] [PubMed] [Google Scholar]
- Harris RS. Pennsylvania State University; 2007. Improved pairwise alignment of genomic DNA. PhD Thesis. [Google Scholar]
- Heinz S, Benner C, Spann N, et al. Simple combinations of lineage-determining transcription factors prime cis-regulatory elements required for macrophage and B cell identities. Molecular Cell. 2010;38:576–589. doi: 10.1016/j.molcel.2010.05.004. [DOI] [PMC free article] [PubMed] [Google Scholar]
- Hoffmann AA, Rieseberg LH. Revisiting the impact of inversions in evolution: from population genetic markers to drivers of adaptive shifts and speciation? Annual Review of Ecology Evolution and Systematics. 2008;39:21–42. doi: 10.1146/annurev.ecolsys.39.110707.173532. [DOI] [PMC free article] [PubMed] [Google Scholar]
- Huang Y, Li Y, Burt DW, et al. The duck genome and transcriptome provide insight into an avian influenza virus reservoir species. Nature Genetics. 2013;45:776–783. doi: 10.1038/ng.2657. [DOI] [PMC free article] [PubMed] [Google Scholar]
- ICGSC. Sequence and comparative analysis of the chicken genome provide unique perspectives on vertebrate evolution. Nature. 2004;432:695–716. doi: 10.1038/nature03154. [DOI] [PubMed] [Google Scholar]
- Jaari S, Li M-H, Merila J. A first-generation microsatellite-based genetic linkage map of the Siberian jay (Perisoreus infaustus): insights into avian genome evolution. BMC Genomics. 2009;10:1. doi: 10.1186/1471-2164-10-1. [DOI] [PMC free article] [PubMed] [Google Scholar]
- Jacob HJ, Brown DM, Bunker RK, et al. A genetic linkage map of the laboratory rat, Rattus norvegicus. Nature Genetics. 1995;9:63–69. doi: 10.1038/ng0195-63. [DOI] [PubMed] [Google Scholar]
- Kawakami T, Backström N, Burri R, et al. Estimation of linkage disequilibrium and interspecific gene flow in Ficedula flycatchers by a newly developed 50 k SNP array. Molecular Ecology Resources. 2014 doi: 10.1111/1755-0998.12270. doi: 10.1111/1755-0998.12270. [DOI] [PMC free article] [PubMed] [Google Scholar]
- Kemkemer C, Kohn M, Cooper D, et al. Gene synteny comparisons between different vertebrates provide new insights into breakage and fusion events during mammalian karyotype evolution. BMC Evolutionary Biology. 2009;9:84. doi: 10.1186/1471-2148-9-84. [DOI] [PMC free article] [PubMed] [Google Scholar]
- Kidd JM, Cooper GM, Donahue WF, et al. Mapping and sequencing of structural variation from eight human genomes. Nature. 2008;453:56–64. doi: 10.1038/nature06862. [DOI] [PMC free article] [PubMed] [Google Scholar]
- Kirkpatrick M, Barton N. Chromosome inversions, local adaptation and speciation. Genetics. 2006;173:419–434. doi: 10.1534/genetics.105.047985. [DOI] [PMC free article] [PubMed] [Google Scholar]
- Kong A, Thorleifsson G, Gudbjartsson DF, et al. Fine-scale recombination rate differences between sexes, populations and individuals. Nature. 2010;467:1099–1103. doi: 10.1038/nature09525. [DOI] [PubMed] [Google Scholar]
- Larkin DM, Pape G, Donthu R, et al. Breakpoint regions and homologous synteny blocks in chromosomes have different evolutionary histories. Genome Research. 2009;19:770–777. doi: 10.1101/gr.086546.108. [DOI] [PMC free article] [PubMed] [Google Scholar]
- Lee J, Han K, Meyer TJ, Kim H-S, Batzer MA. Chromosomal inversions between human and chimpanzee lineages caused by retrotransposons. PLoS ONE. 2008;3:e4047. doi: 10.1371/journal.pone.0004047. [DOI] [PMC free article] [PubMed] [Google Scholar]
- Lehtonen PK, Laaksonen T, Artemyev AV, et al. Geographic patterns of genetic differentiation and plumage colour variation are different in the pied flycatcher (Ficedula hypoleuca. Molecular Ecology. 2009;18:4463–4476. doi: 10.1111/j.1365-294X.2009.04364.x. [DOI] [PubMed] [Google Scholar]
- Lenormand T. The evolution of sex dimorphism in recombination. Genetics. 2003;163:811–822. doi: 10.1093/genetics/163.2.811. [DOI] [PMC free article] [PubMed] [Google Scholar]
- Lenormand T, Dutheil J. Recombination difference between sexes: a role for haploid selection. PLoS Biology. 2005;3:e63. doi: 10.1371/journal.pbio.0030063. [DOI] [PMC free article] [PubMed] [Google Scholar]
- Leskinen PK, Laaksonen T, Ruuskanen S, Primmer CR, Leder EH. The proteomics of feather development in pied flycatchers (Ficedula hypoleuca) with different plumage coloration. Molecular Ecology. 2012;21:5762–5777. doi: 10.1111/mec.12073. [DOI] [PubMed] [Google Scholar]
- Li H, Durbin R. Fast and accurate long-read alignment with Burrows-Wheeler transform. Bioinformatics. 2010;26:589–595. doi: 10.1093/bioinformatics/btp698. [DOI] [PMC free article] [PubMed] [Google Scholar]
- Lohmueller KE, Degenhardt JD, Keinan A. Sex-averaged recombination and mutation rates on the X chromosome: a comment on Labuda et al. The American Journal of Human Genetics. 2010;86:978–980. doi: 10.1016/j.ajhg.2010.03.021. [DOI] [PMC free article] [PubMed] [Google Scholar]
- Mank JE. The evolution of heterochiasmy: the role of sexual selection and sperm competition in determining sex-specific recombination rates in eutherian mammals. Genetical Research. 2009;91:355–363. doi: 10.1017/S0016672309990255. [DOI] [PubMed] [Google Scholar]
- Masabanda JS, Burt DW, O'Brien PCM, et al. Molecular cytogenetic definition of the chicken genome: the first complete avian karyotype. Genetics. 2004;166:1367–1373. doi: 10.1534/genetics.166.3.1367. [DOI] [PMC free article] [PubMed] [Google Scholar]
- McGaugh SE, Heil CSS, Manzano-Winkler B, et al. Recombination modulates how selection affects linked sites in Drosophila. PLoS Biology. 2012;10:e1001422. doi: 10.1371/journal.pbio.1001422. [DOI] [PMC free article] [PubMed] [Google Scholar]
- Mendonca MAC, Carvalho CR, Clarindo WR. DNA content differences between male and female chicken (Gallus gallus domesticus) nuclei and Z and W chromosomes resolved by image cytometry. Journal of Histochemistry & Cytochemistry. 2010;58:229–235. doi: 10.1369/jhc.2009.954727. [DOI] [PMC free article] [PubMed] [Google Scholar]
- Mugal CF, Arndt PF, Ellegren H. Twisted signatures of GC-biased gene conversion embedded in an evolutionary stable karyotype. Molecular Biology and Evolution. 2013;30:1700–1712. doi: 10.1093/molbev/mst067. [DOI] [PMC free article] [PubMed] [Google Scholar]
- Murphy WJ, Larkin DM, van der Wind AE, et al. Dynamics of mammalian chromosome evolution inferred from multispecies comparative maps. Science. 2005;309:613–617. doi: 10.1126/science.1111387. [DOI] [PubMed] [Google Scholar]
- Myers S, Freeman C, Auton A, Donnelly P, McVean G. A common sequence motif associated with recombination hot spots and genome instability in humans. Nature Genetics. 2008;40:1124–1129. doi: 10.1038/ng.213. [DOI] [PubMed] [Google Scholar]
- Myers S, Bowden R, Tumian A, et al. Drive against hotspot motifs in primates implicates the PRDM9 gene in meiotic recombination. Science. 2010;327:876–879. doi: 10.1126/science.1182363. [DOI] [PMC free article] [PubMed] [Google Scholar]
- Nabholz B, Künstner A, Wang R, Jarvis E, Ellegren H. Dynamic evolution of base composition: causes and consequences in avian phylogenomics. Molecular Biology and Evolution. 2011;28:2197–2210. doi: 10.1093/molbev/msr047. [DOI] [PMC free article] [PubMed] [Google Scholar]
- Nachman MW, Payseur BA. Recombination rate variation and speciation: theoretical predictions and empirical results from rabbits and mice. Philosophical Transactions of the Royal Society B-Biological Sciences. 2012;367:409–421. doi: 10.1098/rstb.2011.0249. [DOI] [PMC free article] [PubMed] [Google Scholar]
- Nadachowska-Brzyska K, Burri R, Olason PI, et al. Demographic divergence history of pied flycatcher and collared flycatcher inferred from whole-genome re-sequencing data. PLoS Genetics. 2013;9:e1003942. doi: 10.1371/journal.pgen.1003942. [DOI] [PMC free article] [PubMed] [Google Scholar]
- Nam K, Mugal C, Nabholz B, et al. Molecular evolution of genes in avian genomes. Genome Biology. 2010;11:R68. doi: 10.1186/gb-2010-11-6-r68. [DOI] [PMC free article] [PubMed] [Google Scholar]
- Navarro A, Barton NH. Chromosomal speciation and molecular divergence–accelerated evolution in rearranged chromosomes. Science. 2003;300:321–324. doi: 10.1126/science.1080600. [DOI] [PubMed] [Google Scholar]
- Noor MAF, Grams KL, Bertucci LA, Reiland J. Chromosomal inversions and the reproductive isolation of species. Proceedings of the National Academy of Sciences of the United States of America. 2001;98:12084–12088. doi: 10.1073/pnas.221274498. [DOI] [PMC free article] [PubMed] [Google Scholar]
- van Oers K, Santure AW, De Cauwer I, et al. Replicated high-density genetic maps of two great tit populations reveal fine-scale genomic departures from sex-equal recombination rates. Heredity. 2014;112:307–316. doi: 10.1038/hdy.2013.107. [DOI] [PMC free article] [PubMed] [Google Scholar]
- Organ CL, Edwards SV. Major events in avian genome evolution. In: Dyke G, Kaiser G, Organ C, Edwards S, editors. Living Dinosaurs: The Evolutionary History of Modern Birds. Chichester, UK: John Wiley & Sons Ltd; 2011. pp. 325–337. [Google Scholar]
- Otto SP, Lenormand T. Resolving the paradox of sex and recombination. Nature Reviews Genetics. 2002;3:252–261. doi: 10.1038/nrg761. [DOI] [PubMed] [Google Scholar]
- Pardo-Manuel de Villena F, Sapienza C. Recombination is proportional to the number of chromosome arms in mammals. Mammalian Genome. 2001;12:318–322. doi: 10.1007/s003350020005. [DOI] [PubMed] [Google Scholar]
- Paterson T, Law A. Genotypechecker: an interactive tool for checking the inheritance consistency of genotyped pedigrees. Animal Genetics. 2011;42:560–562. doi: 10.1111/j.1365-2052.2011.02183.x. [DOI] [PubMed] [Google Scholar]
- Peng Q, Pevzner PA, Tesler G. The fragile breakage versus random breakage models of chromosome evolution. PLoS Computational Biology. 2006;2:e14. doi: 10.1371/journal.pcbi.0020014. [DOI] [PMC free article] [PubMed] [Google Scholar]
- Pevzner P, Tesler G. Human and mouse genomic sequences reveal extensive breakpoint reuse in mammalian evolution. Proceedings of the National Academy of Sciences of the United States of America. 2003;100:7672–7677. doi: 10.1073/pnas.1330369100. [DOI] [PMC free article] [PubMed] [Google Scholar]
- Ponting CP. What are the genomic drivers of the rapid evolution of PRDM9? Trends in Genetics. 2011;27:165–171. doi: 10.1016/j.tig.2011.02.001. [DOI] [PubMed] [Google Scholar]
- Presgraves DC. Recombination enhances protein adaptation in Drosophila melanogaster. Current Biology. 2005;15:1651–1656. doi: 10.1016/j.cub.2005.07.065. [DOI] [PubMed] [Google Scholar]
- Price TD, Bouvier MM. The evolution of F1 postzygotic incompatibilities in birds. Evolution. 2002;56:2083–2089. [PubMed] [Google Scholar]
- Primmer CR, Borge T, Lindell J, Saetre GP. Single-nucleotide polymorphism characterization in species with limited available sequence information: high nucleotide diversity revealed in the avian genome. Molecular Ecology. 2002;11:603–612. doi: 10.1046/j.0962-1083.2001.01452.x. [DOI] [PubMed] [Google Scholar]
- Purcell S, Neale B, Todd-Brown K, et al. PLINK: a tool set for whole-genome association and population-based linkage analyses. American Journal of Human Genetics. 2007;81:559–575. doi: 10.1086/519795. [DOI] [PMC free article] [PubMed] [Google Scholar]
- Quinlan AR, Hall IM. BEDTools: a flexible suite of utilities for comparing genomic features. Bioinformatics. 2010;26:841–842. doi: 10.1093/bioinformatics/btq033. [DOI] [PMC free article] [PubMed] [Google Scholar]
- Qvarnstrom A, Bailey RI. Speciation through evolution of sex-linked genes. Heredity. 2008;102:4–15. doi: 10.1038/hdy.2008.93. [DOI] [PubMed] [Google Scholar]
- Qvarnstrom A, Brommer JE, Gustafsson L. Testing the genetics underlying the co-evolution of mate choice and ornament in the wild. Nature. 2006;441:84–86. doi: 10.1038/nature04564. [DOI] [PubMed] [Google Scholar]
- Qvarnström A, Rice AM, Ellegren H. Speciation in Ficedula flycatchers. Philosophical Transactions of the Royal Society B-Biological Sciences. 2010;365:1841–1852. doi: 10.1098/rstb.2009.0306. [DOI] [PMC free article] [PubMed] [Google Scholar]
- Ratti O, Hovi M, Lundberg A, Tegelstrom H, Alatalo RV. Extra-pair paternity and male characteristics in the pied flycatcher. Behavioral Ecology and Sociobiology. 1995;37:419–425. [Google Scholar]
- Renaut S, Grassa CJ, Yeaman S, et al. Genomic islands of divergence are not affected by geography of speciation in sunflowers. Nature Communications. 2013;4:1827. doi: 10.1038/ncomms2833. [DOI] [PubMed] [Google Scholar]
- Rieseberg LH. Chromosomal rearrangements and speciation. Trends in Ecology and Evolution. 2001;16:351–358. doi: 10.1016/s0169-5347(01)02187-5. [DOI] [PubMed] [Google Scholar]
- Ross-Ibarra J. The evolution of recombination under domestication: a test of two hypotheses. The American Naturalist. 2004;163:105–112. doi: 10.1086/380606. [DOI] [PubMed] [Google Scholar]
- Saether SA, Saetre G-P, Borge T, et al. Sex chromosome-linked species recognition and evolution of reproductive isolation in flycatchers. Science. 2007;318:95–97. doi: 10.1126/science.1141506. [DOI] [PubMed] [Google Scholar]
- Sætre GP, Sæther SA. Ecology and genetics of speciation in Ficedula flycatchers. Molecular Ecology. 2010;19:1091–1106. doi: 10.1111/j.1365-294X.2010.04568.x. [DOI] [PubMed] [Google Scholar]
- Saetre GP, Borge T, Lindell J, et al. Speciation, introgressive hybridization and nonlinear rate of molecular evolution in flycatchers. Molecular Ecology. 2001;10:737–749. doi: 10.1046/j.1365-294x.2001.01208.x. [DOI] [PubMed] [Google Scholar]
- Saetre GP, Borge T, Lindroos K, et al. Sex chromosome evolution and speciation in Ficedula flycatchers. Proceedings of the Royal Society B-Biological Sciences. 2003;270:53–59. doi: 10.1098/rspb.2002.2204. [DOI] [PMC free article] [PubMed] [Google Scholar]
- Sambrook J, Fritsch EF, Maniatis T. Molecular Cloning: A Laboratory Manual. 2nd edn. New York, New York: Cold Spring Harbour Laboratory Press; 1989. [Google Scholar]
- Sankoff D, Trinh P. Chromosomal breakpoint reuse in genome sequence rearrangement. Journal of Computational Biology. 2005;12:812–821. doi: 10.1089/cmb.2005.12.812. [DOI] [PubMed] [Google Scholar]
- Segura J, Ferretti L, Ramos-Onsins S, et al. Evolution of recombination in eutherian mammals: insights into mechanisms that affect recombination rates and crossover interference. Proceedings of the Royal Society B-Biological Sciences. 2013;280:20131945. doi: 10.1098/rspb.2013.1945. [DOI] [PMC free article] [PubMed] [Google Scholar]
- Shapiro MD, Kronenberg Z, Li C, et al. Genomic diversity and evolution of the head crest in the rock pigeon. Science. 2013;339:1063–1067. doi: 10.1126/science.1230422. [DOI] [PMC free article] [PubMed] [Google Scholar]
- Sheldon BC, Ellegren H. Offspring sex and paternity in the collared flycatcher. Proceedings of the Royal Society B-Biological Sciences. 1996;263:1017–1021. [Google Scholar]
- Sheldon B, Ellegren H. Sexual selection resulting from extrapair paternity in collared flycatchers. Animal Behaviour. 1999;57:285–298. doi: 10.1006/anbe.1998.0968. [DOI] [PubMed] [Google Scholar]
- Skinner BM, Griffin DK. Intrachromosomal rearrangements in avian genome evolution: evidence for regions prone to breakpoints. Heredity. 2012;108:37–41. doi: 10.1038/hdy.2011.99. [DOI] [PMC free article] [PubMed] [Google Scholar]
- Smukowski CS, Noor MAF. Recombination rate variation in closely related species. Heredity. 2011;107:496–508. doi: 10.1038/hdy.2011.44. [DOI] [PMC free article] [PubMed] [Google Scholar]
- Stapley J, Birhead TR, Burke T, Slate J. A linkage map of the zebra finch Taeniopygia guttata provides new insights into avian genome evolution. Genetics. 2008;179:651–667. doi: 10.1534/genetics.107.086264. [DOI] [PMC free article] [PubMed] [Google Scholar]
- Tegelstrom H, Gelter HP. Haldane rule and sex biased gene flow between 2 hybridizing flycatcher species (Ficedula-albicollis and F-hypoleuca, Aves, Muscicapidae) Evolution. 1990;44:2012–2021. doi: 10.1111/j.1558-5646.1990.tb04307.x. [DOI] [PubMed] [Google Scholar]
- Tesler G. GRIMM: genome rearrangements web server. Bioinformatics. 2002;18:492–493. doi: 10.1093/bioinformatics/18.3.492. [DOI] [PubMed] [Google Scholar]
- Thomas JW, Cáceres M, Lowman JJ, et al. The chromosomal polymorphism linked to variation in social behavior in the white-throated sparrow (Zonotrichia albicollis) is a complex rearrangement and suppressor of recombination. Genetics. 2008;179:1455–1468. doi: 10.1534/genetics.108.088229. [DOI] [PMC free article] [PubMed] [Google Scholar]
- Thorneycroft HB. Chromosomal polymorphism in white-throated sparrow Zonotrichia albicollis (Gmelin) Science. 1966;154:1571–1572. doi: 10.1126/science.154.3756.1571. [DOI] [PubMed] [Google Scholar]
- Turelli M, Moyle LC. Asymmetric postmating isolation: Darwin's corollary to Haldane's rule. Genetics. 2007;176:1059–1088. doi: 10.1534/genetics.106.065979. [DOI] [PMC free article] [PubMed] [Google Scholar]
- Turner TL, Hahn MW. Genomic islands of speciation or genomic islands and speciation? Molecular Ecology. 2010;19:848–850. doi: 10.1111/j.1365-294X.2010.04532.x. [DOI] [PubMed] [Google Scholar]
- Uebbing S, Kunstner A, Makinen H, Ellegren H. Transcriptome sequencing reveals the character of incomplete dosage compensation across multiple tissues in flycatchers. Genome Biology and Evolution. 2013;5:1555–1566. doi: 10.1093/gbe/evt114. [DOI] [PMC free article] [PubMed] [Google Scholar]
- Veen T, Borge T, Griffith SC, et al. Hybridization and adaptive mate choice in flycatchers. Nature. 2001;411:45–50. doi: 10.1038/35075000. [DOI] [PubMed] [Google Scholar]
- Völker M, Backström N, Skinner BM, et al. Copy number variation, chromosome rearrangement, and their association with recombination during avian evolution. Genome Research. 2010;20:503–511. doi: 10.1101/gr.103663.109. [DOI] [PMC free article] [PubMed] [Google Scholar]
- Wang J, Fan HC, Behr B, Quake SR. Genome-wide single-cell analysis of recombination activity and de novo mutation rates in human sperm. Cell. 2012;150:402–412. doi: 10.1016/j.cell.2012.06.030. [DOI] [PMC free article] [PubMed] [Google Scholar]
- Warren WC, Clayton DF, Ellegren H, et al. The genome of a songbird. Nature. 2010;464:757–762. doi: 10.1038/nature08819. [DOI] [PMC free article] [PubMed] [Google Scholar]
- Webster MT, Hurst LD. Direct and indirect consequences of meiotic recombination: implications for genome evolution. Trends in Genetics. 2012;28:101–109. doi: 10.1016/j.tig.2011.11.002. [DOI] [PubMed] [Google Scholar]
- White MJD. Animal Cytology and Evolution. Cambridge: Cambridge University Press; 1973. [Google Scholar]
- Winckler W, Myers SR, Richter DJ, et al. Comparison of fine-scale recombination rates in humans and chimpanzees. Science. 2005;308:107–111. doi: 10.1126/science.1105322. [DOI] [PubMed] [Google Scholar]
- Wyman MJ, Wyman MC. specific recombination rates and allele frequencies affect the invasion of sexually antagonistic variation on autosomes. Journal of Evolutionary Biology. 2013;26:2428–2437. doi: 10.1111/jeb.12236. [DOI] [PubMed] [Google Scholar]
- Yeaman S. Genomic rearrangements and the evolution of clusters of locally adaptive loci. Proceedings of the National Academy of Sciences of the United States of America. 2013;110:E1743–E1751. doi: 10.1073/pnas.1219381110. [DOI] [PMC free article] [PubMed] [Google Scholar]
- Zhao H, Bourque G. Recovering genome rearrangements in the mammalian phylogeny. Genome Research. 2009;19:934–942. doi: 10.1101/gr.086009.108. [DOI] [PMC free article] [PubMed] [Google Scholar]
Associated Data
This section collects any data citations, data availability statements, or supplementary materials included in this article.
Supplementary Materials
Fig. S1 Overview of the collared flycatcher pedigree structure used for linkage analysis.
Fig. S2 Correlation dendrogram of the six genomic parameters used as candidate explanatory variables for variation in recombination rate.
Fig. S3 Relationship between the recombination rate and distance to chromosome end (both log10 scaled).
Fig. S4 Best-order linkage map of the collared flycatcher genome.
Fig. S5 Super-scaffolds and singleton scaffolds in the collared flycatcher genome assembly version ficalb1.5.
Fig. S6 Schematic illustration of syntenic relationships between chicken (white), flycatcher (blue) and zebra finch (black) chromosomes.
Fig. S7 Size distribution of inversion events.
Fig. S8 Size distribution of breakpoint regions between syntenic blocks of 50 kb in pairwise whole-genome alignment of flycatcher and zebra finch.
Fig. S9 Number of inversion events in relation to the relative distance to chromosome end detected at a resolution of 50 kb syntenic blocks in pairwise whole-genome alignment of flycatcher and zebra finch.
Fig. S10 The relationship between the genetic (cm) and the physical (Mb) distance in the best-order map of the collared flycatcher genome.
Fig. S11 The relationship between GC-content and recombination rate after Z-transformation of log-transformed variables.
Table S1 Number and rate (events per million years) of intrachromosomal rearrangements (inversions) in three avian lineages in relation to the size of minimum synteny block size considered.
Table S2 The number of occurrences per kb (real numbers within parentheses) of all six significantly enriched sequence motifs in the regions with highest (hot regions; 792 952 bp) and lowest recombination rate (cold regions; 39 730 478 bp).
Table S3 Rate of inversion in different avian and mammaliana lineages.
Table S4 Mean recombination rate (cm/Mb) in distal (<15 Mb from chromosome ends) and central parts (>15 Mb from chromosome ends) of chromosomes larger than 50 Mb in three bird species.
Appendix S1 Supplementary methods.
Data Availability Statement
ficalb1.5 assembly version of the collared flycatcher genome: GenBank AGTO02000000. SNP markers used in the array: dbSNP ss_974710772–974751664. Individual genotypes used for linkage analysis: Dryad doi:10.5061/dryad.v0v83.