

Abstract
Brain activity observed at many spatiotemporal scales exhibits a 1/f-like power spectrum, including neuronal membrane potentials, neural field potentials, noninvasive electroencephalography, magnetoencephalography and functional magnetic resonance imaging signals. A 1/f-like power spectrum is indicative of arrhythmic brain activity that does not contain a predominant temporal scale (hence, “scale-free”). This characteristic of scale-free brain activity distinguishes it from brain oscillations. While scale-free brain activity and brain oscillations coexist, our understanding of the former remains very limited. Recent research has shed light on the spatiotemporal organization, functional significance and potential generative mechanisms of scale-free brain activity, as well as its developmental and clinical relevance. A deeper understanding of this prevalent brain signal should provide new insights and analytical tools for cognitive neuroscience.
A student entering neuroscience today might learn about the irregular, Poisson-like firing in cortical pyramidal neurons on the one hand, and the plethora of brain oscillations on the other hand. Both are well-established neuroscience phenomena: the former from single- or multi- unit recordings of neuronal spiking, the latter from recordings of brain electrical field potentials such as local field potentials (LFP), electroencephalography (EEG) and magnetoencephalography (MEG). Why is it that one modality has emphasized irregular patterns of neural activity, while the other has emphasized oscillatory patterns? In fact, regular, rhythmic neuronal firing patterns do exist in cortical excitatory neurons; they are just less common [1-3] (Fig. 1A). Irregular, arrhythmic (see Glossary) field potential activity patterns also exist (Fig. 1B), and actually account for the majority of the signal power recorded in LFP/EEG/MEG experiments (Fig. 1C), but are much less studied than brain oscillations. In this article I will focus on what we currently know about this prevalent, arrhythmic component of brain field potentials, and identify several urgent questions in this research field.
Figure 1. Example rhythmic and arrhythmic activity in neuronal firing and field potentials.
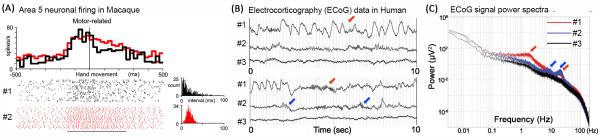
(A) Activity of two neurons in macaque Area 5 around motor responses. Top: Trial-averaged spike rate histogram; the two neurons exhibit similar firing rates. Bottom: Each tick mark in the raster corresponds to a single spike. 1-sec-long data from 20 trials are shown for each neuron. Right: Inter-spike interval (ISI) histograms for these two neurons within the time window indicated by the horizontal line. Neuron #1 exhibits an ISI histogram approximating an exponential distribution – a signature of an arrhythmic, Poisson process. Neuron #2 displays a peaked ISI distribution – an indication of rhythmic, regular firing. Adapted from Maimon and Assad (2009) [3]. (B) Raw activity traces from three ECoG electrodes in a neurosurgical patient. Electrodes #1 and #2 were over the left frontal cortex, electrode #3 over left temporal cortex. Data were recorded using DC-coupled amplifier with a 500-Hz sampling rate. Two 10-sec-long segments are shown. Arrows point to examples of oscillations. (C) Power spectra for the three electrodes shown in B, averaged over 83-min recording during the waking state. The spectra are presented in log-log scale, under which a power-law distribution ( P ∝ 1/ f β ) manifests as a roughly straight line ( log P ∝ −β log f ). Scale-free brain activity refers to the irregular, arrhythmic brain activity contributing to this “1/f slope” of the power spectrum. Arrows point to peaks in the power spectra corresponding to brain oscillations. Panels B and C are adapted from He et al. (2010) [9].
Brain Oscillations vs. Scale-free Brain Activity
Brain oscillations are recurring patterns of brain activity that follow a particular temporal beat. For example, the first discovered EEG rhythm, the occipital alpha wave, proceeds at roughly 10 cycles per second [4]. Thus, brain oscillations are most easily identified in the frequency domain, as their power spectra contain peaks at the corresponding frequency ranges (arrows in Fig. 1C). There are a number of brain oscillations at different frequency ranges, each with their own underlying mechanisms and functional roles [5-8].
At the same time, it is well known that the power spectrum of brain electrical field potentials contains a predominant “1/f” component; that is, power tends to fall off with increasing frequency following a power-law function: P ∝ 1/ fβ, where P is power, f is frequency, and β is a parameter (typically in the range of 0 ~ 3) named the “power-law exponent”. A power-law function is indicative of scale-invariance (see Glossary), which suggests that no particular time scale or frequency dominates the dynamics. Hence, the brain activity contributing to this 1/f slope in the power spectrum is devoid of periodicity (i.e., being arrhythmic; see Box 1). Accordingly, we have recently named it “scale-free brain activity” in reference to its scale-invariant nature [9]. (Note that white noise, including Poisson firing patterns, is a special case of arrhythmic activity, in which case β equals 0 and power is constant across different frequencies.) A power-law distribution of the power spectrum is characteristic of the temporal dynamics of brain activity at many different observational levels: It has been described in the fluctuations of neuronal membrane potentials [10, 11], LFP [12] and invasive EEG (i.e., electrocorticography, ECoG) signals [9, 13-15], scalp-EEG and MEG recordings [16], and functional magnetic resonance imaging (fMRI) signals [17-19] (see Box 2). In addition, the amplitude fluctuations of narrow-band brain oscillations in EEG/MEG recordings exhibit prevalent scale-free dynamics [20]. A power-law distribution has also been reported in the statistics of neurotransmitter release [21] and neuronal firing [22], where it has been more controversial (e.g., [1-3, 11, 23]). Lastly, fluctuations of human behavioral output such as reaction time, hit rate and force have often been found to exhibit a 1/f-like power spectrum as well [24-28].
Box 1. Could Scale-free Brain Activity Be Produced by the Sum of Many Oscillations?
Could a 1/f-type power spectrum be the result of a summation over many narrow-band oscillations, where the amplitude of an oscillation is inversely proportional to its frequency? While mathematically possible (indeed, it is the basis of Fourier transform), in the context of the brain, such a perfect line-up of many generators at each frequency with a perfectly scaled amplitude would seem to be magic instead of biological reality. In particular, we know that when oscillations do exist, they often manifest as “bumps” on top of the 1/f slope in the power spectrum (see Fig. 1B-C). In addition, because oscillations come and go, such a “summation” account would require averaging over long periods of time to produce a 1/f-type power spectrum. In a previous paper [9], we showed that even with data records as short as 20 seconds, reproducible 1/f-type power spectrum, as well as the oscillatory bumps on top of it, can be discerned. Overwhelming results now suggest that the more parsimonious and biologically realistic framework is that there are two types of brain activity that coexist: the broadband, arrhythmic activity and the narrow-band, rhythmic oscillations.
Box 2. Power laws: How good is good enough?
The power-law distribution is undoubtedly one of the most controversial topics in the recent history of modern science [36, 37, 82]. This is partly because it has been claimed to exist in a very wide array of systems, such as earthquakes, finance and solar flares – to name but a few, sometimes without critical examination [83]. The power-law distribution has been used to describe three different types of functions. Unfortunately, the discussions of power laws have often lumped them together indiscriminately. These functions include:
1) Probability function (i.e., normalized histogram), which describes the frequency/occurrence of a variable x as a function of its size or rank k: Px(k) ∝ 1/kβ. Examples of this category include the famous Zipf’s law and neuronal avalanches [79].
2) The relationship between two variables: y ∝ xβ. A well-known example of this class of power laws is the allometric scaling law in biology, where a biological variable (Y) scales as a function of body mass (M): Y ∝ Mβ[84].
3) The temporal or spatial power spectrum: P(f) ∝ 1/fβ. In the case of the temporal power spectrum, a power-law distribution is indicative of scale-free dynamics [37] – the subject of this Review. In the case of the spatial power spectrum, a power-law distribution is indicative of fractal geometry [85], such as the shape of coastlines and mountain ranges and the famous Mandelbrot set.
There have been two extremes of attitude toward power laws. On the one hand, a school of physicists were eager to seek a universal law of nature and saw the power-law distribution as a signature that unites everything and provides an opportunity for deriving a law that explains “how the nature works” [36]. Under this mind set, a simple model that produced a power-law distribution was sometimes implicated as explaining all power-law distributions across widely different systems. However, as has been stressed here and elsewhere, diverse generative mechanisms can give rise to an identical power-law distribution [9, 82, 86]. Moreover, in the case of scale-free dynamics, an identical power spectrum between two signals does not imply that they share other, higher-order statistical structures [9]. On the other hand, perhaps due to the “universal” quality that was erroneously attached to the power-law distribution, many biologists including neuroscientists have reacted negatively towards it. Thus, it is often considered that the “1/f noise” is unspecific and could arise from instrument noise. However, several studies carefully controlling for instrument noise found that it is orders of magnitude smaller in power than the recorded brain activity, and resembles white noise much more [9, 59]. Although rigorous statistical assessment of the power-law distribution was not carried out in all reports of such a phenomenon, a previous study applying goodness-of-fit test and model comparisons [83] to the fMRI signal power spectrum found that the power-law model was viable and provided better fit to the empirical data than alternative models such as exponential and log-normal functions [17]. Lastly, given the diverse mechanisms that can give rise to a power-law distribution, attaching a “power-law” label may not be that important after all: biological data are messy and may never exhibit a curve as precise as the blackbody radiation. However, correctly characterizing the distribution of the data is important if it may shed light on the properties and mechanisms of the signal under study. For example, the tripartite shape of the human ECoG power spectrum suggest that different network and cellular mechanisms may contribute to different frequency ranges (see Modeling the power spectrum of ECoG and LFP activity). In this sense, “scale-free” is a phenomenological, instead of mechanistic, definition. In conclusion, overwhelming data now suggest that both brain oscillations and arrhythmic brain activity do exist, and a theoretical framework that accommodates their co-existence is sorely needed.
In a power spectrum, brain oscillations appear as bumps on top of this 1/f slope (Fig. 1C) (the bumps may be difficult to detect in a log-log plot if the amplitude of brain oscillations is much smaller than that of the 1/f slope at the corresponding frequency range). For decades, brain activity contained in the “1/f” slope has been deemed unimportant and was often removed from analyses in order to emphasize brain oscillations. However, in recent years, increasing evidence suggests that scale-free brain activity contributes actively to brain functioning. Computational modeling work has further shed light on how the irregular, Poisson firing of cortical pyramidal neurons might combine in a recurrent network to contribute to the distinctive “1/f” shape of the brain field potential power spectrum. Initial evidence has also emerged suggesting changes in scale-free brain activity during development [29, 30], sleep [31], and under various neurological and psychiatric disorders [32-35]. These recent advances argue that contrary to being a form of noise, scale-free brain activity in non-invasive recordings such as EEG and MEG provides a window onto the population activity of the cortical pyramidal neurons.
Scale-free Brain Activity is Not Unstructured Noise
1/f-type temporal dynamics are prevalent not only in the nervous system, but also in nature at large [36, 37]. The ubiquity of scale-free dynamics in a wide variety of systems was often taken as evidence that these dynamics lack functional specificity, as exemplified by the colloquial name “1/f noise.” To a large extent, the historical neglect of scale-free brain activity is due to this deflationary interpretation of scale-free dynamics. However, it is important to keep in mind that the power spectrum is only a second-order statistic; similarity of the power spectrum does not indicate similarity in higher-order statistics beyond the power spectrum. In other words, diverse generative mechanisms in a variety of systems can give rise to scale-free dynamics with very similar power spectral shape, but the fine structures within these dynamics may differ across systems, providing clues about the underlying generative mechanisms [9].
To illustrate this point, in a previous study [9], we examined higher-order statistics of human ECoG signals during the awake, resting state (continuous recordings for 19 ~ 83 min), as well as continuous earth seismic waves (Univ. of Nevada, Reno seismic network, for ~4 months) and stock market fluctuations (daily price of Dow-Jones index for ~80 years). All three signals exhibited a power spectrum close to the form of P ∝ 1/f2. For lack of an established meaningful index of higher-order statistics in the context of scale-free dynamics, we borrowed an approach from the field of brain oscillations – nested frequencies [38], which characterizes the dependence between the phase of a low-frequency component and the amplitude of a high-frequency component. This approach revealed prominent nested-frequency patterns within all three types of signals, which were absent in a simulated random walk that shared an identical power spectrum. Interestingly, nested-frequency patterns were systematically different between brain activity, earth waves and stock market: While the preferred phase (see Glossary) of nested-frequency patterns within brain ECoG signals concentrated around 0 and ±π (corresponding to the peak and trough of the low-frequency fluctuation, respectively), those in earth seismic waves concentrated around ±π/2 (corresponding to upward and downward shifts in seismic activity). By contrast, there was no dominant preferred phase in stock market fluctuations. These results suggest that despite very similar power spectral shape (power-law scaling with an exponent β ≈ 2), the arrhythmic ECoG signal, the earth seismic waves, and the stock market fluctuations each contain specific higher-order statistical structures that differ from each other. These analyses provided the first clues that, contrary to the negative connotations of the term “1/f noise,” scale-free brain activity contains rich, specific temporal structures.
Beyond Nested Frequencies
Nonetheless, what do these nested-frequency patterns in scale-free dynamics mean? Nested-frequency analysis necessitates filtering the broadband signal in different frequency ranges and extracting the phase and power of a lower- and a higher-frequency band, respectively. While it is straightforward to characterize the phase and power corresponding to rhythmic brain oscillations, the interpretation of phase and power extracted from filtered arrhythmic signals requires more caution. Although we avoided narrow-band filters with steep roll-off, which are prone to ringing artifacts in the time domain (see Supplementary Note in [9]), an intuitive interpretation of this finding remained elusive.
Indications of the potential mechanisms of these results emerged when the surface Laplacian transform was applied to ECoG data before nested-frequency analysis was carried out. Under Laplacian transform, the signal from each electrode is subtracted by the mean of its four nearest neighbors, such that the transformed signal represents local vertical current flux and approximates transcortical recording (i.e., cortical-surface recording referenced to the underlying white matter) [39]. By contrast, in our previous analysis and other studies on nested frequencies in ECoG signals [9, 38, 40, 41], an average-reference or bipolar montage was used, whereby the polarity of the transformed signal depends heavily on the activity of the reference. Interestingly, after Laplacian transform, the preferred phase in most nested-frequency pairs clustered only around ±π (as opposed to the original finding of preferred phases around 0 and ±π), corresponding to the trough of the low-frequency fluctuation (Fig. 2A). The exceptions are 1-Hz and <0.5Hz bands (Fig. 2A, two leftmost columns), where the preferred phase was between 0 and π, i.e., on the negative shift, consistent with known physiology of the slow cortical potentials (SCPs) represented in this frequency range [39, 42-44]. This pattern was similar during slow-wave sleep (not shown), except that the preferred phase in the SCP range moved close to 0 (corresponding to the peak of the low-frequency fluctuation), which was likely due to the contamination by up-and-down states (UDS) during deep sleep (for the difference between UDS and SCP see Supplementary Note 3 in Ref [39]). The concentration of preferred phase around ±π after Laplacian transform can be explained by negative field potential transients (nFPs) observed in the raw ECoG signals (Fig. 2B). In the frequency domain, these sharp negative transients produce realignment of phase at ±π across many frequencies and, simultaneously, increase of power across many frequencies (as demonstrated in Refs [45, 46]), thereby producing nested-frequency patterns with preferred phase around ±π. Strikingly, a similar time-domain-based account can be provided for the nested-frequency patterns in earth seismic waves. Seismic waves are dominated by step functions due to the collision of tectonic plates [47] which, in the frequency domain, would realign the phase of many different frequencies at ±π/2.
Figure 2. Nested frequencies (i.e., cross-frequency phase-amplitude coupling) in human waking ECoG data under Laplacian transform.
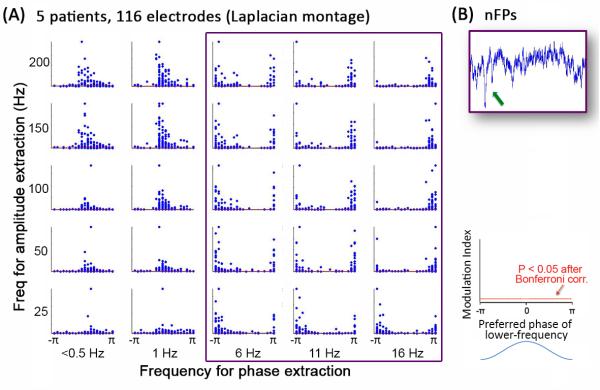
The Laplacian transform subtracts the signal from an electrode by the average of its nearest neighbors, and thus represents local vertical current flux. (A) Nested-frequency patterns across 116 electrodes in five patients. Phase was extracted from the 0.003 ~ 0.5 Hz band (leftmost column), and four frequency bands centered at 1, 6, 11, and 16 Hz. Amplitude was extracted from five frequency bands centered at 25, 50, 100, 150, and 200 Hz. Filters with a smooth roll-off were used (for filter characteristics see Supplementary Note in Ref [9]). For each frequency pair, the subplot shows a scatter-plot of all electrodes, each represented by one dot. The ordinate value plots the cross-frequency coupling strength as assessed by the modulation index [9, 38]. The red horizontal line (very close to the x-axis) indicates the significance level (p < 0.05 after Bonferroni correction). The abscissa value plots the preferred phase of the lower frequency, i.e., the phase of the lower-frequency fluctuation at which the amplitude of the higher frequency is largest. Data are the same as published in He et al. (2010) [9], except that the Laplacian transform, instead of an average reference, was used. For frequency pairs indicated by the magenta rectangle, preferred phases clustered around ±π, indicating that negative sharp transients in the time domain (B) may contribute to the nested frequencies. (B) An example of raw ECoG activity trace containing the appearance of negative field potential transients (nFPs) (arrow), which may underlie the nested-frequency patterns for phases > 1 Hz (magenta rectangle in A).
In summary, the above considerations illustrate an account of the nested frequencies based on time-domain waveforms that have more straightforward mechanistic explanations. Broadly speaking, with the exception of event-related potential (ERP) analyses, the standard interpretation of continuous neuroelectrical data has been dominated by frequency-domain methods that decompose a broadband signal into many different frequency bands. In the case of a genuine brain oscillation (e.g., [48]), such an approach is straightforward, effective and intuitive. However, this approach is often applied to broadband brain activity without first assessing the occurrence of brain oscillations, in which case any extracted narrow-band signals may have no real biological underpinning whatsoever (see, e.g., Supplementary Note in Ref [9]). In this context, it is especially enlightening to ponder that the artificiality of using a series of sinusoids to reconstruct any time series may have played a large role in Lagrange’s rejection of Fourier’s paper in 1807. It took Fourier some 15 years to eventually publish his work [49] – a fact that should bring some measure of perspective and consolation to present-day scientists. Since classic signal processing methods were developed in engineering fields with the goal of analyzing narrow-band oscillations [49], going forward, development of time- and/or frequency- domain-based methods to capture the fine structures within arrhythmic, broadband signals will likely prove fruitful in the investigation of scale-free brain activity (for an example see Ref [46]).
Functional Significance of Scale-free Brain Activity
Research on the functional roles of scale-free brain activity is just beginning. Nonetheless, there are several tantalizing lines of evidence suggesting that it may be intimately related to brain functioning.
First, the broadband (roughly 5 ~ 200 Hz) power of LFPs has been shown to correlate tightly with population neuronal firing rates in both human and macaque [14, 46]. Ray and Maunsell [46] presented an impressive dissociation between scale-free brain activity and brain oscillation in the same frequency range, using LFPs recorded from the primary visual cortex (V1) of awake macaques. As they increased the size of the visual stimulus, both population firing rate and broadband power in the gamma frequency range decreased, while the power of narrow-band gamma oscillation increased. Hence, in this context, the broadband, arrhythmic activity, but not gamma oscillation, correlated with neuronal firing rate. Given the tight relationship between broadband power and population firing rate, it might not come as a surprise that broadband power, especially in the gamma frequency range (30 ~ 200 Hz) where it is less obscured by prominent oscillations in the theta, alpha and beta ranges, demonstrates remarkable task specificity across a diverse range of tasks, including visual stimulation [50], finger movement [51], speech production [52], movie viewing [53] and default-mode functions such as autobiographical judgment [54, 55].
Second, multiple studies have demonstrated that the steepness of the 1/f-like power spectrum, quantified by the power-law exponent β, can be modulated by sensory stimuli or task performance. A study using intracellularly recorded membrane potentials in cat V1 found that the power-law exponent in the high-frequency range (75 ~ 200 Hz) could be modulated by the spatial and temporal correlation statistics of the visual input [11]. Using ECoG recordings in humans, it was observed that the power-law exponent β in the low-frequency SCP range (<4 Hz) decreased during a visual detection task of unpredictable stimuli [9]. Since the power spectrum is equivalent to the Fourier transform of the autocovariance function (“Wiener-Khinchin theorem”), a reduced power-law exponent indicates shorter/weaker autocorrelation in the time domain. Speculatively, this reduction of temporal autocorrelation (i.e., redundancy) in the ECoG signals during task may be consistent with the need for more efficient online information processing.
Third, given the correlation between SCP and fMRI signals [39, 42, 56, 57], it is reassuring that a similar phenomenon was observed in the fMRI signal, namely that the power-law exponent β decreases during performance of a visual detection task as compared with rest [17]. Interestingly, this change was found in both activated and deactivated brain regions, suggesting reduction of temporal autocorrelation in both. This finding has recently been extended to a working memory task: As cognitive load was enhanced, the power-law exponent was further reduced (Chang, He & Duyn, HBM meeting, 2012), paralleling a similar observation in the fluctuations of human behavioral performance [58]. The whole-brain coverage of fMRI further allowed elucidation of the variation of β across brain networks, which was found to be largest in the default network, saliency network and visual cortices, and smallest in subcortical and motor regions [17, 30]. Interestingly, the brain regions with a larger β were also more expensive in their glucose metabolism [17]. These results suggest that the degree of autocorrelation within fMRI signals varies across resting-state networks and seems to increase with higher resting metabolism.
Lastly, as mentioned earlier, the amplitude fluctuations of brain oscillations also exhibit scale-free temporal dynamics [20, 59]. Recently, intriguing evidence has emerged showing that across subjects, the scaling exponent of EEG/MEG signal amplitude fluctuations correlated with the scaling exponent of behavioral output [26, 27]. These observations extended the behavioral correlations of scale-free brain activity from the within-individual to the across-individual domain.
Generative Mechanisms of Scale-free Brain Activity
What are the generative mechanisms of scale-free brain activity? In this section, I will first focus on existing computational modeling studies on the power spectral shape of invasively recorded LFP and ECoG signals, and then describe the discrepancy of the power-law exponent observed across modalities (ECoG/LFP vs. EEG, MEG and fMRI) and the intriguing questions posed by these findings.
Modeling the power spectrum of ECoG and LFP activity
Studies investigating the power spectrum of ECoG and LFP signals have reported very similar values for the power-law exponent, which is typically in the range of 2 ~ 3 [9, 12, 13, 15]. Similar power-law exponents were also found in the power spectrum of neuronal membrane potential fluctuations [10, 11]. In particular, two studies using human ECoG, focusing on the relatively low (from <0.01 to 100 Hz) [9] and relatively high (10 ~ 500 Hz) [13] frequency ranges respectively, have reported strikingly similar exponents in the middle-frequency range: β = 2.44 in the range of 1 ~ 100 Hz in the first study, and β = 2.46 in the range of 15 ~ 80 Hz in the second study. The close alignment of these numbers exemplifies the robustness of the power-law distribution.
In addition to this middle-frequency range, Miller et al. [13] found a transition to β ≈ 4 in the high-frequency range above 75 Hz, suggesting that power declines faster with increasing frequency in this range. They proposed a simple model that can explain the power spectral shape, which utilizes the convolution of two exponentially decaying functions representing, respectively, the post-synaptic current and the membrane leak. An exponentially decaying function (see Glossary) in the time domain is characterized by a “Lorentzian” function in the frequency domain of the form: P ≈ constant for f << f0; and P ∝ 1/f2 for f >> f0, where f0 is the “knee” frequency. The “knee” frequency is directly related to the time constant (τ, see Glossary) of the exponential decay such that f0 = 1/ (2πτ). Recalling that convolution in the time domain is equivalent to multiplication in the frequency domain, the resulted power spectrum from this model is thus the multiplication of two Lorentzian’s, following the form: P ≈ constant for f << f1; P ∝ 1/f2 for f1 << f << f2; and P ∝ 1/f4 for f >> f2, where f1 and f2 are two “knee” frequencies determined by the time constants.
Determining the locations of f1 and f2 may shed light on the underlying generative mechanisms of arrhythmic brain activity. While Miller et al. found f2 to be around 75 Hz, their data do not reveal the location of f1 in the lower frequency range. This information is provided in the study by He et al. [9], which found f1 to be around 1~2 Hz. Together, these results suggest the existence of two time constants: one around 2~3 ms, another around 100 ms. At present, the origins of these time constants remain a speculation. One possibility is that the 2~3 ms time constant originates from synaptic current, and the ~100 ms time constant from membrane leak [13]. An alternative possibility is that the ~100 ms time constant comes from the slow NMDA synaptic current [60, 61], and the membrane leak time constant can be as short as 2~3 ms during active synaptic activity [62]. Adjudication between these two scenarios will require future experiments, such as blocking NMDA signaling and examining the resulting change in the power spectrum of field potentials.
Interestingly, He et al. found that at the very low frequency range, below a “shoulder” of 0.1 ~ 1 Hz where power is relatively flat, the power spectrum again follows a form close to P ∝ 1/f2 (see Fig. 1 in Ref [9]). Potential generative mechanisms for this low-frequency behavior have recently been explored in a recurrent network model (Chaudhuri, He & Wang, Cosyne meeting, 2014). It was found that a recurrent network of rate-based nodes with linear couplings and random connectivity, when poised near criticality (i.e., with balanced excitation and inhibition), could reproduce the low-frequency behavior of the ECoG power spectrum. In such a network, the network recurrent activity produces one or more very slow time constants, whose corresponding “knee” frequencies are below that so far investigated empirically (0.003 Hz [9]). Moreover, reducing the spatial correlation of the inputs to different nodes resulted in a flattening of the power spectrum, similar to that observed in human ECoG and fMRI data during task performance [9, 17]. Thus, this network naturally converts spatial correlation into temporal correlation, providing support for a previous proposal that decoupling among neuronal groups might underlie the reduction of power-law exponent during task [17].
This low-frequency range of the ECoG activity (i.e., the SCP) bears significant resemblance to persistent neural activity [63, 64]. As with persistent neural activity, both network and cellular mechanisms may be at play in generating the SCP. In particular, future studies should investigate potential contributions by slow cellular and neuromodulatory mechanisms, such as metabotropic glutamate receptors [65], endocannabinoid signaling [66], and the cholinergic pathway [67]. Under anesthesia or deep sleep, the presence of UDS may also contribute to the power spectral shape of LFP and ECoG signals [68]. In addition, the effect of different network topology on the power spectrum should be further explored. Of note, two recent computational modeling studies found that network multistability caused by clustered connections or inhibitory neurons is conducive to producing slow fluctuations in population activity [69, 70].
Lastly, a separate class of models has attributed the 1/f-type power spectrum of neuronal membrane potentials and EEG signals to the low-pass filtering effect of the cable properties of neuronal dendrites [71, 72]. In-depth treatment of this literature is beyond the scope of this Review. Interestingly, this class of models predicts higher power-law exponents for neuronal membrane potentials than for the EEG signals (Pettersen et al., arxiv.org/abs/1305.2332). With the assumption that the noise-generating membrane currents themselves obey a power law with an exponent of 1, this theory predicts a 1/f-type power spectrum for the membrane potentials with an exponent of 2.6, roughly in accordance with empirical literature [10, 11]. For the EEG, the power-law exponents are predicted to be in the range of 1 ~ 2.5 depending on the considered frequency region and dendritic lengths; this is in qualitative agreement with experimental observations [16, 73].
Differences between Power-Law Exponents of Signals from Different Recording Modalities
Dehghani et al. investigated the power spectrum of simultaneously recorded scalp-EEG and MEG signals [16] in human subjects under quiet wakefulness. They found that the power-law exponent of scalp-EEG signals varied from 1 to 2 across the scalp in the frequency range of 0.1 ~ 10 Hz, with a mean of 1.33 ± 0.2 (± s.d). Interestingly, the power-law exponent of MEG signals was systematically smaller in the same frequency range (i.e., the power spectrum was flatter), with a mean of 1.06 ± 0.3 after correcting for noise. Using data acquired in our laboratory, we have observed a similar difference between the power-law exponents of EEG and MEG signals, with EEG signals having systematically steeper power spectra than MEG signals (Hill, Li & He, unpublished data). Lastly, several studies have found the power-law exponent of fMRI signals in the gray matter to be mostly in the range of 0.5 ~ 1 (assessed for <0.1 Hz frequency region), with a mean across brain regions being close to 0.8 [17, 19].
The differences between the power-law exponents of these different signals should be an important topic for future research. In particular, they may hold clues to the underlying generative mechanisms of arrhythmic brain activity recorded in these different modalities. A direct comparison between the fMRI signal and the other imaging modalities is difficult as the fMRI signal is subject to neurovascular coupling – a process that we still do not fully understand. However, the difference between EEG and MEG signal exponents is intriguing, and may constitute evidence for frequency-dependent filtering in the extracellular medium [16], although this remains a subject of debate [72, 74]. Lastly, since EEG and ECoG record very similar signals, the relatively large difference between their power-law exponents (1.5 vs. 2~3) may be due to signal summation and filtering by the dura, skull and scalp in scalp-EEG.
Relationship with Amplitude Fluctuations of Brain Oscillations and Neuronal Avalanches
In this Review, I have focused on scale-free dynamics in the raw fluctuations of broadband (from < 0.01 Hz to ~ 500 Hz) electrical and magnetic signals from the brain, as well as the low-frequency (<0.5 Hz) activity recorded in fMRI. As mentioned above, the amplitude fluctuations of narrow-band brain oscillations also exhibit scale-free dynamics [20]; moreover, a recent burgeoning literature has demonstrated the functional [26, 27, 59], developmental [29], and clinical [34] relevance of this phenomenon. Future studies should investigate the relationship between broadband scale-free brain activity and scale-free dynamics in narrow-band amplitude fluctuations. Such a potential link is especially tantalizing given the prevalent phase-amplitude coupling in brain electrical signals [9, 75, 76].
Recent empirical [27] and theoretical [77] work has also linked scale-free dynamics in narrow-band amplitude fluctuations with neuronal avalanches. Neuronal avalanches refer to the phenomenon that the propagation of negative sharp transients in LFPs follows a power law in its spatial and temporal distributions [78, 79]. Recalling the discussion above that these negative sharp transients in field potentials (nFPs) are likely a major contributor to nested frequencies in broadband scale-free activity, it is tempting to speculate a potential connection between scale-free brain activity and neuronal avalanches.
A comprehensive theoretical framework that incorporates broadband scale-free activity, scale-free dynamics in narrow-band amplitude fluctuations, and neuronal avalanches will surely be rewarding and may not be far in sight. Encouragingly, recent empirical and modeling studies have pointed to the “critical” role of balanced excitation and inhibition in the genesis of all three phenomena (Chaudhuri, He & Wang, Cosyne 2014)[77, 80, 81].
Highlights.
Arrhythmic, scale-free brain activity is distinct from brain oscillations
Scale-free brain activity contains rich temporal structures beyond power spectrum
Scale-free brain activity is relevant to task performance and arousal state
Scale-free brain activity is altered in developmental and disease processes
Computational modeling has shed light on its potential generative mechanisms
Acknowledgements
This work was supported by the Intramural Research program of the NIH/NINDS. I thank Xiao-Jing Wang and Rishidev Chaudhuri for discussions; Qi Li and Zachary Hill for collecting resting-state MEG and EEG data for estimating the power-law exponent; Brian Maniscalco and three anonymous reviewers for helpful feedback on previous drafts.
Glossary
- Brain oscillations
Brain activity patterns that recur with a particular temporal frequency.
- Arrhythmic
Without a predominant temporal frequency, often used interchangeably with “aperiodic” and “irregular”.
- Scale-invariance
A property referring to the lack of a characteristic scale. Its adjective “scale-invariant” is used interchangeably with “scale-free”. Scale-invariance can manifest in either temporal (as in “scale-free dynamics”) or spatial (as in “fractal geometry”) domain. Mathematically, scale-invariance is characterized by a power-law distribution of the temporal/spatial power spectrum.
- Exponentially decaying function
, where X is a time-varying function and λ is the decay rate. It is called “exponentially decaying” because the solution to this function is: X (t) = X0e−λt. Convolution of two exponential functions can be written as: and . In the context of the present discussion, V could approximate neuronal membrane potential, and I the postsynaptic current.
- Time constant
The time constant of an exponentially decaying function is defined as the reciprocal of the decay rate: τ = 1/λ. It is also directly related to the knee frequency in the power spectrum: . Importantly, time constant is an entirely different concept from the “time scale” of an oscillation. The time scale of an oscillation is characterized by the reciprocal of its characteristic frequency. By contrast, the time constant of an exponentially decaying function describes how fast the system returns to baseline, and does not imply the existence of periodicity at all.
- Preferred phase in nested frequencies
The phase of the lower-frequency fluctuation at which the amplitude of the higher frequency is the largest.
Footnotes
Publisher's Disclaimer: This is a PDF file of an unedited manuscript that has been accepted for publication. As a service to our customers we are providing this early version of the manuscript. The manuscript will undergo copyediting, typesetting, and review of the resulting proof before it is published in its final citable form. Please note that during the production process errors may be discovered which could affect the content, and all legal disclaimers that apply to the journal pertain.
References
- 1.Softky WR, Koch C. The highly irregular firing of cortical cells is inconsistent with temporal integration of random EPSPs. J Neurosci. 1993;13:334–350. doi: 10.1523/JNEUROSCI.13-01-00334.1993. [DOI] [PMC free article] [PubMed] [Google Scholar]
- 2.Bair W, et al. Power spectrum analysis of bursting cells in area MT in the behaving monkey. J Neurosci. 1994;14:2870–2892. doi: 10.1523/JNEUROSCI.14-05-02870.1994. [DOI] [PMC free article] [PubMed] [Google Scholar]
- 3.Maimon G, Assad JA. Beyond Poisson: increased spike-time regularity across primate parietal cortex. Neuron. 2009;62:426–440. doi: 10.1016/j.neuron.2009.03.021. [DOI] [PMC free article] [PubMed] [Google Scholar]
- 4.Berger H. Uber das Elektroenkephalogramm des Menschen. Arch. Psyhiatr. Nervenkr. 1929;87:527–570. [Google Scholar]
- 5.Buzsaki G, et al. Scaling brain size, keeping timing: evolutionary preservation of brain rhythms. Neuron. 2013;80:751–764. doi: 10.1016/j.neuron.2013.10.002. [DOI] [PMC free article] [PubMed] [Google Scholar]
- 6.Fries P. Neuronal gamma-band synchronization as a fundamental process in cortical computation. Annu Rev Neurosci. 2009;32:209–224. doi: 10.1146/annurev.neuro.051508.135603. [DOI] [PubMed] [Google Scholar]
- 7.Jensen O, et al. An oscillatory mechanism for prioritizing salient unattended stimuli. Trends Cogn Sci. 2012;16:200–206. doi: 10.1016/j.tics.2012.03.002. [DOI] [PubMed] [Google Scholar]
- 8.Schroeder CE, Lakatos P. Low-frequency neuronal oscillations as instruments of sensory selection. Trends Neurosci. 2009;32:9–18. doi: 10.1016/j.tins.2008.09.012. [DOI] [PMC free article] [PubMed] [Google Scholar]
- 9.He BJ, et al. The temporal structures and functional significance of scale-free brain activity. Neuron. 2010;66:353–369. doi: 10.1016/j.neuron.2010.04.020. [DOI] [PMC free article] [PubMed] [Google Scholar]
- 10.Destexhe A, et al. The high-conductance state of neocortical neurons in vivo. Nat Rev Neurosci. 2003;4:739–751. doi: 10.1038/nrn1198. [DOI] [PubMed] [Google Scholar]
- 11.El Boustani S, et al. Network-state modulation of power-law frequency-scaling in visual cortical neurons. PLoS Comput Biol. 2009;5:e1000519. doi: 10.1371/journal.pcbi.1000519. [DOI] [PMC free article] [PubMed] [Google Scholar]
- 12.Milstein J, et al. Neuronal shot noise and Brownian 1/f2 behavior in the local field potential. PLoS One. 2009;4:e4338. doi: 10.1371/journal.pone.0004338. [DOI] [PMC free article] [PubMed] [Google Scholar]
- 13.Miller KJ, et al. Power-law scaling in the brain surface electric potential. PLoS Comput Biol. 2009;5:e1000609. doi: 10.1371/journal.pcbi.1000609. [DOI] [PMC free article] [PubMed] [Google Scholar]
- 14.Manning J, et al. Broadband shifts in local field potential power spectra are correlated with single-neuron spiking in humans. J Neurosci. 2009;29:13613–13620. doi: 10.1523/JNEUROSCI.2041-09.2009. [DOI] [PMC free article] [PubMed] [Google Scholar]
- 15.Freeman WJ, Zhai J. Simulated power spectral density (PSD) of background electrocorticogram (ECoG) Cogn Neurodyn. 2009;3:97–103. doi: 10.1007/s11571-008-9064-y. [DOI] [PMC free article] [PubMed] [Google Scholar]
- 16.Dehghani N, et al. Comparative power spectral analysis of simultaneous electroencephalographic and magnetoencephalographic recordings in humans suggests non-resistive extracellular media : EEG and MEG power spectra. J Comput Neurosci. 2010 doi: 10.1007/s10827-010-0252-5. [DOI] [PMC free article] [PubMed] [Google Scholar]
- 17.He BJ. Scale-Free Properties of the Functional Magnetic Resonance Imaging Signal during Rest and Task. J Neurosci. 2011;31:13786–13795. doi: 10.1523/JNEUROSCI.2111-11.2011. [DOI] [PMC free article] [PubMed] [Google Scholar]
- 18.Bullmore E, et al. Colored noise and computational inference in neurophysiological (fMRI) time series analysis: resampling methods in time and wavelet domains. Hum Brain Mapp. 2001;12:61–78. doi: 10.1002/1097-0193(200102)12:2<61::AID-HBM1004>3.0.CO;2-W. [DOI] [PMC free article] [PubMed] [Google Scholar]
- 19.Ciuciu P, et al. Scale-Free and Multifractal Time Dynamics of fMRI Signals during Rest and Task. Frontiers in physiology. 2012;3:186. doi: 10.3389/fphys.2012.00186. [DOI] [PMC free article] [PubMed] [Google Scholar]
- 20.Linkenkaer-Hansen K, et al. Long-range temporal correlations and scaling behavior in human brain oscillations. J Neurosci. 2001;21:1370–1377. doi: 10.1523/JNEUROSCI.21-04-01370.2001. [DOI] [PMC free article] [PubMed] [Google Scholar]
- 21.Lowen SB, et al. Quantal neurotransmitter secretion rate exhibits fractal behavior. J Neurosci. 1997;17:5666–5677. doi: 10.1523/JNEUROSCI.17-15-05666.1997. [DOI] [PMC free article] [PubMed] [Google Scholar]
- 22.Lowen SB, et al. Fractal features of dark, maintained, and driven neural discharges in the cat visual system. Methods. 2001;24:377–394. doi: 10.1006/meth.2001.1207. [DOI] [PubMed] [Google Scholar]
- 23.Bennett MR, Kearns JL. Statistics of transmitter release at nerve terminals. Prog Neurobiol. 2000;60:545–606. doi: 10.1016/s0301-0082(99)00040-4. [DOI] [PubMed] [Google Scholar]
- 24.Gilden DL. Cognitive emissions of 1/f noise. Psychological review. 2001;108:33–56. doi: 10.1037/0033-295x.108.1.33. [DOI] [PubMed] [Google Scholar]
- 25.Kello CT, et al. Scaling laws in cognitive sciences. Trends Cogn Sci. 2010;14:223–232. doi: 10.1016/j.tics.2010.02.005. [DOI] [PubMed] [Google Scholar]
- 26.Smit DJ, et al. Long-range temporal correlations in resting-state alpha oscillations predict human timing-error dynamics. J Neurosci. 2013;33:11212–11220. doi: 10.1523/JNEUROSCI.2816-12.2013. [DOI] [PMC free article] [PubMed] [Google Scholar]
- 27.Palva JM, et al. Neuronal long-range temporal correlations and avalanche dynamics are correlated with behavioral scaling laws. Proc Natl Acad Sci U S A. 2013;110:3585–3590. doi: 10.1073/pnas.1216855110. [DOI] [PMC free article] [PubMed] [Google Scholar]
- 28.Monto S, et al. Very slow EEG fluctuations predict the dynamics of stimulus detection and oscillation amplitudes in humans. J Neurosci. 2008;28:8268–8272. doi: 10.1523/JNEUROSCI.1910-08.2008. [DOI] [PMC free article] [PubMed] [Google Scholar]
- 29.Smit DJ, et al. Scale-free modulation of resting-state neuronal oscillations reflects prolonged brain maturation in humans. J Neurosci. 2011;31:13128–13136. doi: 10.1523/JNEUROSCI.1678-11.2011. [DOI] [PMC free article] [PubMed] [Google Scholar]
- 30.Fransson P, et al. Early development of spatial patterns of power-law frequency scaling in FMRI resting-state and EEG data in the newborn brain. Cereb Cortex. 2013;23:638–646. doi: 10.1093/cercor/bhs047. [DOI] [PubMed] [Google Scholar]
- 31.Tagliazucchi E, et al. Breakdown of long-range temporal dependence in default mode and attention networks during deep sleep. Proc Natl Acad Sci U S A. 2013;110:15419–15424. doi: 10.1073/pnas.1312848110. [DOI] [PMC free article] [PubMed] [Google Scholar]
- 32.Maxim V, et al. Fractional Gaussian noise, functional MRI and Alzheimer’s disease. Neuroimage. 2005;25:141–158. doi: 10.1016/j.neuroimage.2004.10.044. [DOI] [PubMed] [Google Scholar]
- 33.Tolkunov D, et al. Power spectrum scale invariance quantifies limbic dysregulation in trait anxious adults using fMRI: adapting methods optimized for characterizing autonomic dysregulation to neural dynamic time series. Neuroimage. 2010;50:72–80. doi: 10.1016/j.neuroimage.2009.12.021. [DOI] [PMC free article] [PubMed] [Google Scholar]
- 34.Montez T, et al. Altered temporal correlations in parietal alpha and prefrontal theta oscillations in early-stage Alzheimer disease. Proc Natl Acad Sci U S A. 2009;106:1614–1619. doi: 10.1073/pnas.0811699106. [DOI] [PMC free article] [PubMed] [Google Scholar]
- 35.Wei M, et al. Identifying major depressive disorder using Hurst exponent of resting-state brain networks. Psychiatry research. 2013 doi: 10.1016/j.pscychresns.2013.09.008. [DOI] [PubMed] [Google Scholar]
- 36.Bak P. How nature works. Springer; 1996. [Google Scholar]
- 37.Mandelbrot BB. Multifractals and 1/f Noise: Wild Self-Affinity in Physics. Springer; 1999. [Google Scholar]
- 38.Canolty RT, et al. High gamma power is phase-locked to theta oscillations in human neocortex. Science. 2006;313:1626–1628. doi: 10.1126/science.1128115. [DOI] [PMC free article] [PubMed] [Google Scholar]
- 39.He BJ, et al. Electrophysiological correlates of the brain’s intrinsic large-scale functional architecture. Proc Natl Acad Sci U S A. 2008;105:16039–16044. doi: 10.1073/pnas.0807010105. [DOI] [PMC free article] [PubMed] [Google Scholar]
- 40.van der Meij R, et al. Phase-amplitude coupling in human electrocorticography is spatially distributed and phase diverse. J Neurosci. 2012;32:111–123. doi: 10.1523/JNEUROSCI.4816-11.2012. [DOI] [PMC free article] [PubMed] [Google Scholar]
- 41.Miller KJ, et al. Dynamic modulation of local population activity by rhythm phase in human occipital cortex during a visual search task. Front Hum Neurosci. 2010;4:197. doi: 10.3389/fnhum.2010.00197. [DOI] [PMC free article] [PubMed] [Google Scholar]
- 42.He BJ, Raichle ME. The fMRI signal, slow cortical potential and consciousness. Trends Cogn Sci. 2009;13:302–309. doi: 10.1016/j.tics.2009.04.004. [DOI] [PMC free article] [PubMed] [Google Scholar]
- 43.Birbaumer N, et al. Slow potentials of the cerebral cortex and behavior. Physiol Rev. 1990;70:1–41. doi: 10.1152/physrev.1990.70.1.1. [DOI] [PubMed] [Google Scholar]
- 44.Rockstroh B, et al. Slow Brain Potentials and Behaviour. Urban & Schwarzenberg; 1989. [Google Scholar]
- 45.Szymanski FD, et al. The laminar and temporal structure of stimulus information in the phase of field potentials of auditory cortex. J Neurosci. 2011;31:15787–15801. doi: 10.1523/JNEUROSCI.1416-11.2011. [DOI] [PMC free article] [PubMed] [Google Scholar]
- 46.Ray S, Maunsell JH. Different origins of gamma rhythm and high-gamma activity in macaque visual cortex. PLoS Biol. 2011;9:e1000610. doi: 10.1371/journal.pbio.1000610. [DOI] [PMC free article] [PubMed] [Google Scholar]
- 47.Bormann P. New Manual of Seismological Observatory Practice 2. Deutsches GeoForschungsZentrum GFZ; 2013. [Google Scholar]
- 48.Fries P, et al. Finding gamma. Neuron. 2008;58:303–305. doi: 10.1016/j.neuron.2008.04.020. [DOI] [PubMed] [Google Scholar]
- 49.Smith SW. Digital Signal Processing: A Practical Guide for Engineers and Scientists. Elsevier Science; 2003. [Google Scholar]
- 50.Henrie JA, Shapley R. LFP power spectra in V1 cortex: the graded effect of stimulus contrast. J Neurophysiol. 2005;94:479–490. doi: 10.1152/jn.00919.2004. [DOI] [PubMed] [Google Scholar]
- 51.Miller KJ, et al. Decoupling the cortical power spectrum reveals real-time representation of individual finger movements in humans. J Neurosci. 2009;29:3132–3137. doi: 10.1523/JNEUROSCI.5506-08.2009. [DOI] [PMC free article] [PubMed] [Google Scholar]
- 52.Bouchard KE, et al. Functional organization of human sensorimotor cortex for speech articulation. Nature. 2013;495:327–332. doi: 10.1038/nature11911. [DOI] [PMC free article] [PubMed] [Google Scholar]
- 53.Honey CJ, et al. Slow cortical dynamics and the accumulation of information over long timescales. Neuron. 2012;76:423–434. doi: 10.1016/j.neuron.2012.08.011. [DOI] [PMC free article] [PubMed] [Google Scholar]
- 54.Dastjerdi M, et al. Differential electrophysiological response during rest, self-referential, and non-self-referential tasks in human posteromedial cortex. Proc Natl Acad Sci U S A. 2011;108:3023–3028. doi: 10.1073/pnas.1017098108. [DOI] [PMC free article] [PubMed] [Google Scholar]
- 55.Ossandon T, et al. Transient suppression of broadband gamma power in the default-mode network is correlated with task complexity and subject performance. J Neurosci. 2011;31:14521–14530. doi: 10.1523/JNEUROSCI.2483-11.2011. [DOI] [PMC free article] [PubMed] [Google Scholar]
- 56.Pan WJ, et al. Infraslow LFP correlates to resting-state fMRI BOLD signals. Neuroimage. 2013;74:288–297. doi: 10.1016/j.neuroimage.2013.02.035. [DOI] [PMC free article] [PubMed] [Google Scholar]
- 57.Kahn I, et al. Optogenetic drive of neocortical pyramidal neurons generates fMRI signals that are correlated with spiking activity. Brain research. 2013 doi: 10.1016/j.brainres.2013.03.011. [DOI] [PMC free article] [PubMed] [Google Scholar]
- 58.Clayton K, Frey B. Studies of mental “noise”. Nonlinear Dynamics, Psychology, and Life Sciences. 1997;1:173–180. [Google Scholar]
- 59.Linkenkaer-Hansen K, et al. Stimulus-induced change in long-range temporal correlations and scaling behaviour of sensorimotor oscillations. Eur J Neurosci. 2004;19:203–211. doi: 10.1111/j.1460-9568.2004.03116.x. [DOI] [PubMed] [Google Scholar]
- 60.Gibb AJ, Colquhoun D. Glutamate activation of a single NMDA receptor-channel produces a cluster of channel openings. Proc Biol Sci. 1991;243:39–45. doi: 10.1098/rspb.1991.0007. [DOI] [PubMed] [Google Scholar]
- 61.Wong KF, Wang XJ. A recurrent network mechanism of time integration in perceptual decisions. J Neurosci. 2006;26:1314–1328. doi: 10.1523/JNEUROSCI.3733-05.2006. [DOI] [PMC free article] [PubMed] [Google Scholar]
- 62.Koch C, et al. A brief history of time (constants) Cereb Cortex. 1996;6:93–101. doi: 10.1093/cercor/6.2.93. [DOI] [PubMed] [Google Scholar]
- 63.Brody CD, et al. Basic mechanisms for graded persistent activity: discrete attractors, continuous attractors, and dynamic representations. Curr Opin Neurobiol. 2003;13:204–211. doi: 10.1016/s0959-4388(03)00050-3. [DOI] [PubMed] [Google Scholar]
- 64.Major G, Tank D. Persistent neural activity: prevalence and mechanisms. Curr Opin Neurobiol. 2004;14:675–684. doi: 10.1016/j.conb.2004.10.017. [DOI] [PubMed] [Google Scholar]
- 65.Zhang Z, Seguela P. Metabotropic induction of persistent activity in layers II/III of anterior cingulate cortex. Cereb Cortex. 2010;20:2948–2957. doi: 10.1093/cercor/bhq043. [DOI] [PubMed] [Google Scholar]
- 66.Carter E, Wang XJ. Cannabinoid-mediated disinhibition and working memory: dynamical interplay of multiple feedback mechanisms in a continuous attractor model of prefrontal cortex. Cereb Cortex. 2007;17(Suppl 1):i16–26. doi: 10.1093/cercor/bhm103. [DOI] [PubMed] [Google Scholar]
- 67.Letzkus JJ, et al. A disinhibitory microcircuit for associative fear learning in the auditory cortex. Nature. 2011;480:331–335. doi: 10.1038/nature10674. [DOI] [PubMed] [Google Scholar]
- 68.Baranauskas G, et al. Origins of 1/f2 scaling in the power spectrum of intracortical local field potential. J Neurophysiol. 2012;107:984–994. doi: 10.1152/jn.00470.2011. [DOI] [PubMed] [Google Scholar]
- 69.Litwin-Kumar A, Doiron B. Slow dynamics and high variability in balanced cortical networks with clustered connections. Nat Neurosci. 2012;15:1498–1505. doi: 10.1038/nn.3220. [DOI] [PMC free article] [PubMed] [Google Scholar]
- 70.Ho EC, et al. Inhibitory networks of fast-spiking interneurons generate slow population activities due to excitatory fluctuations and network multistability. J Neurosci. 2012;32:9931–9946. doi: 10.1523/JNEUROSCI.5446-11.2012. [DOI] [PMC free article] [PubMed] [Google Scholar]
- 71.Linden H, et al. Intrinsic dendritic filtering gives low-pass power spectra of local field potentials. J Comput Neurosci. 2010;29:423–444. doi: 10.1007/s10827-010-0245-4. [DOI] [PubMed] [Google Scholar]
- 72.Einevoll GT, et al. Modelling and analysis of local field potentials for studying the function of cortical circuits. Nat Rev Neurosci. 2013;14:770–785. doi: 10.1038/nrn3599. [DOI] [PubMed] [Google Scholar]
- 73.Freeman WJ, et al. Spatial spectra of scalp EEG and EMG from awake humans. Clin Neurophysiol. 2003;114:1053–1068. doi: 10.1016/s1388-2457(03)00045-2. [DOI] [PubMed] [Google Scholar]
- 74.Logothetis NK, et al. In vivo measurement of cortical impedance spectrum in monkeys: implications for signal propagation. Neuron. 2007;55:809–823. doi: 10.1016/j.neuron.2007.07.027. [DOI] [PubMed] [Google Scholar]
- 75.Bragin A, et al. Gamma (40-100 Hz) oscillation in the hippocampus of the behaving rat. J Neurosci. 1995;15:47–60. doi: 10.1523/JNEUROSCI.15-01-00047.1995. [DOI] [PMC free article] [PubMed] [Google Scholar]
- 76.Canolty RT, Knight RT. The functional role of cross-frequency coupling. Trends Cogn Sci. 2010;14:506–515. doi: 10.1016/j.tics.2010.09.001. [DOI] [PMC free article] [PubMed] [Google Scholar]
- 77.Poil SS, et al. Critical-state dynamics of avalanches and oscillations jointly emerge from balanced excitation/inhibition in neuronal networks. J Neurosci. 2012;32:9817–9823. doi: 10.1523/JNEUROSCI.5990-11.2012. [DOI] [PMC free article] [PubMed] [Google Scholar]
- 78.Beggs JM, Plenz D. Neuronal avalanches in neocortical circuits. J Neurosci. 2003;23:11167–11177. doi: 10.1523/JNEUROSCI.23-35-11167.2003. [DOI] [PMC free article] [PubMed] [Google Scholar]
- 79.Plenz D, Thiagarajan TC. The organizing principles of neuronal avalanches: cell assemblies in the cortex? Trends Neurosci. 2007;30:101–110. doi: 10.1016/j.tins.2007.01.005. [DOI] [PubMed] [Google Scholar]
- 80.Shew WL, et al. Information capacity and transmission are maximized in balanced cortical networks with neuronal avalanches. J Neurosci. 2011;31:55–63. doi: 10.1523/JNEUROSCI.4637-10.2011. [DOI] [PMC free article] [PubMed] [Google Scholar]
- 81.Lombardi F, et al. Balance between excitation and inhibition controls the temporal organization of neuronal avalanches. Phys Rev Lett. 2012;108:228703. doi: 10.1103/PhysRevLett.108.228703. [DOI] [PubMed] [Google Scholar]
- 82.Stumpf MP, Porter MA. Mathematics. Critical truths about power laws. Science. 2012;335:665–666. doi: 10.1126/science.1216142. [DOI] [PubMed] [Google Scholar]
- 83.Clauset A, et al. Power-law distributions in empirical data. SIAM Review. 2009;51:661–703. [Google Scholar]
- 84.West GB, et al. A general model for the origin of allometric scaling laws in biology. Science. 1997;276:122–126. doi: 10.1126/science.276.5309.122. [DOI] [PubMed] [Google Scholar]
- 85.Mandelbrot BB. The Fractal Geometry of Nature. W. H. Freeman & Company; 1977. [Google Scholar]
- 86.Frank SA. The common patterns of nature. J Evol Biol. 2009;22:1563–1585. doi: 10.1111/j.1420-9101.2009.01775.x. [DOI] [PMC free article] [PubMed] [Google Scholar]