

Abstract
Angiotensin II type 1 receptor (AT1R)–associated protein (ATRAP) promotes AT1R internalization along with suppression of pathological activation of tissue AT1R signaling. However, the functional significance of ATRAP in renal sodium handling and blood pressure regulation under pathological stimuli is not fully resolved. Here we show the blood pressure of mice with a gene-targeted disruption of ATRAP was comparable to that of wild-type mice at baseline. However, in ATRAP-knockout mice, angiotensin II–induced hypertension was exacerbated and the extent of positive sodium balance was increased by angiotensin II. Renal expression of the sodium-proton antiporter 3, a major sodium transporter in the proximal tubules, urinary pH, renal angiotensinogen production, and angiotensin II content was unaffected. Stimulation of the renal expression and activity of the epithelial sodium channel (ENaC), a major sodium transporter in the distal tubules, was significantly enhanced by chronic angiotensin II infusion. The circulating and urinary aldosterone levels were comparable. The blood pressure response and renal ENaC expression by aldosterone were not affected. Thus, ATRAP deficiency exacerbated angiotensin II–mediated hypertension by pathological activation of renal tubular AT1R by angiotensin II. This directly stimulates ENaC in the distal tubules and enhances sodium retention in an aldosterone-independent manner.
Keywords: angiotensin, blood pressure, cell signaling, epithelial sodium transport, hypertension, renin–angiotensin system
Hypertension is the most common chronic disease worldwide. It has a complex etiology in which genetic and environmental factors are intricately intertwined. Although the mechanisms underlying hypertension are difficult to fully elucidate, the renin–angiotensin system (RAS) has a pivotal role in it. Among tissue RAS forms, activation of angiotensin II type 1 receptor (AT1R) signaling in the renal tubules is suggested to have a key role in altered renal sodium handling that occurs in hypertension. According to Guyton's hypothesis, it is maintained that hypertension is caused by a disproportionate suppression of sodium excretion from kidney due to arterial pressure.1 Therefore, pathological activation of renal tubule AT1R signaling provokes defective renal sodium handling, with a consequent dysregulation of body fluid volume that, in turn, leads to development of hypertension.
The AT1R-associated protein (ATRAP/Agtrap) has been identified as a specific AT1R-binding protein.2, 3 Previous studies have shown that ATRAP selectively suppresses angiotensin II (Ang II)–mediated pathological activation of AT1R in cardiovascular cells, and that cardiac ATRAP enhancement ameliorates cardiac hypertrophy in Ang II–infused mice without any effect on baseline cardiovascular functions, including blood pressure (BP).4, 5, 6, 7, 8 Based on these observations, we hypothesized that a downregulation of tissue ATRAP enhances pathological activation of tissue AT1R in response to certain stimuli without any evident effect on baseline physiological AT1R signaling. ATRAP is abundantly distributed along the renal tubules.9, 10 Therefore, we investigated the effects of chronic Ang II infusion on BP and renal sodium handling in the context of gene-specific disruption of ATRAP (ATRAP-knockout (KO) mice).
RESULTS
ATRAP deficiency exerts no evident effect on renal morphology and function or AT1R expression
The ATRAP mRNA was widely distributed in the tissues of littermate wild-type control mice (WT mice) with the highest expression in kidney (Figure 1a). In contrast, no ATRAP expression was detected in any tissues, including the kidney, in ATRAP-KO mice (Figure 1a and b). On immunohistochemical analysis with consecutive sections using markers specific to the tubular segments, such as megalin (proximal convoluted tubules), calbindin-D (distal convoluted tubules and connecting tubules), and aquaporin 2 (collecting ducts), ATRAP immunostaining was broadly detected in nephron segments from proximal convoluted tubules to collecting ducts of WT mice (Figure 1c). In contrast, there was no ATRAP immunostaining in nephron segments of ATRAP-KO mice (Figure 1d). Although genetic inactivation of other RAS components, such as angiotensinogen (AGT), renin, and AT1R, has been reported to result in renal morphological alteration even under baseline conditions,11, 12, 13, 14, 15 ATRAP-KO mice at baseline exhibited no apparent alterations in renal morphology (Figure 1e) or creatinine clearance (Figure 1f, 260.8±21.7 in WT vs. 277.6±13.2 in ATRAP-KO, μl/min, P=0.918; unpaired t-test). Furthermore, there was no significant difference in AT1R mRNA expression between WT and ATRAP-KO mice (Figure 1g).
Figure 1.

Angiotensin II type 1 receptor (AT1R)–associated protein (ATRAP) deficiency exerts no evident effect on renal morphology or AT1R gene expression. (a) ATRAP mRNA is widely distributed in many different tissues and abundantly expressed in the kidney of wild-type (WT) mice. Values are calculated relative to those achieved with extracts from the liver of WT mice and are expressed as mean±s.e. (n=2 in each group). ND, not detected. (b) ATRAP protein is abundantly expressed in the kidney of WT mice on immunohistochemistry. The positive areas for ATRAP immunostaining are evident as brown dots in the sections. Scale bar=1.5 mm. Original magnification × 40. (c) In WT mice, the ATRAP protein is expressed along the nephron segments from the proximal to distal tubules in consecutive renal cortical sections, as shown by immunohistochemistry. AQP2, aquaporin-2, a specific marker of the collecting ducts; Calbindin-D, a specific marker of distal convoluted tubules (DCTs) and connecting tubules (CNTs); Megalin, a specific marker of the proximal tubules. Original magnification × 200. (d) In ATRAP-knockout (KO) mice, there is no ATRAP immunostaining in the renal tubules. Original magnification × 200. (e) There is no anatomical difference between the kidneys of the WT and ATRAP-KO mice on representative hematoxylin/eosin staining of kidney sections. Scale bar=1.5 mm. Original magnification × 40. (f) ATRAP deficiency does not affect the creatinine clearance. Values are expressed as mean±s.e. (n=4 in each group). (g) ATRAP deficiency does not affect the tissue distribution or expression levels of AT1R mRNA. The values were calculated relative to those achieved with extracts from the muscles of WT mice and are expressed as mean±s.e. (n=4–6 in each group).
ATRAP deficiency exerts no apparent effect on baseline BP or urinary pH
Genetic deficiency of the RAS components (that is, AGT, renin, and AT1R) has also been reported to result in significant decreases in baseline BP.11, 12, 13, 14, 15 However, baseline 24-h mean systolic BP, diastolic BP, and heart rate, measured by radiotelemetric method, were similar in WT and ATRAP-KO mice (Figure 2a, systolic BP 120±2 vs. 123±4, mm Hg, P=0.545; Figure 2b, diastolic BP 92±5 vs. 95±4, mm Hg, P=0.793; Figure 2c, HR 541±18 vs. 547±10 beat/min, P=0.598; unpaired t-test). Urinary pH, which reflects the activity of sodium-proton antiporter 3 (NHE3), was also similar in WT and ATRAP-KO mice (Figure 2d).
Figure 2.

Angiotensin II type 1 receptor (AT1R)–associated protein (ATRAP) deficiency exerts no apparent effect on baseline blood pressure (BP) or urinary pH. (a) Systolic BP, (b) diastolic BP, and (c) heart rate measured by a radiotelemetric method were similar in the wild-type (WT) and ATRAP-knockout (KO) mice. (d) Urinary pH was also comparable in the WT and ATRAP-KO mice. Values are expressed as mean±s.e. (n=5–6 in each group).
ATRAP deficiency exacerbates Ang II–induced hypertension
As ATRAP-KO mice did not display any alternation in baseline BP, we next examined the effects of ATRAP deficiency on BP response to chronic Ang II infusion (500 or 2000 ng/kg/min). Whereas systolic BP was increased during the period of chronic Ang II infusion in WT mice, Ang II–induced elevation of systolic BP was significantly exacerbated in ATRAP-KO mice compared with WT mice, irrespective of dose (Figure 3a; Ang II, 500 ng/kg/min, F=6.117, P=0.048; Figure 3b, Ang II, 2000 ng/kg/min, F=86.758, P<0.001, two-way repeated measures analysis of variance (ANOVA)). We employed a higher dose of Ang II (2000 ng/kg/min) for further experiments to characterize ATRAP-KO mice in comparison with WT mice.
Figure 3.

Angiotensin II type 1 receptor (AT1R)–associated protein (ATRAP) deficiency exacerbates angiotensin II (Ang II)–mediated hypertension. The Ang II–induced elevation of systolic blood pressure (BP) was significantly exacerbated in ATRAP-knockout (KO) mice as compared with wild-type (WT) mice irrespective of the Ang II dose (a, 500 ng/kg/min; b, 2000 ng/kg/min). Values are expressed as mean±s.e. (n=4 in each group). †P<0.05 versus WT mice, ††P<0.01 versus WT mice. (c) ATRAP-KO mice exhibited a significantly increased ratio of heart weight/body weight compared with WT mice after Ang II (2000 ng/kg/min) infusion. Values are expressed as mean±s.e. (n=7–9 in each group). **P<0.01 versus vehicle, †P<0.05 versus WT mice. (d) Urinary albumin excretion was further elevated in ATRAP-KO mice compared with WT mice after Ang II (2000 ng/kg/min) infusion. Values are expressed as mean±s.e. (n=6–8 in each group). **P<0.01 versus vehicle, ††P<0.01 versus WT mice.
The ATRAP-KO mice also exhibited a significantly increased ratio of heart weight/body weight compared with WT mice by Ang II (Figure 3c, P=0.040; analysis of variance (ANOVA). Similarly, urinary albumin excretion was elevated in ATRAP-KO mice compared with WT mice (Figure 3d; P<0.001. ANOVA). The mortality rate was comparable in WT and ATRAP-KO mice during Ang II infusion (2000 ng/kg/min) for 14 days (5.7 vs. 7.3%, P=0.576, χ2-test).
ATRAP deficiency inhibits urinary sodium excretion during Ang II infusion
As the highest ATRAP expression was observed in renal tubules among analyzed tissues, we hypothesized that ATRAP deficiency might enhance Ang II–mediated hypertension by affecting renal sodium handling. To examine this, we performed metabolic cage analysis (Figure 4a–d). Day-by-day sodium intake was similar in WT and ATRAP-KO mice (Figure 4a, F=0.559, P=0.469, two-way repeated measures ANOVA), and urinary sodium excretion was comparable in WT and ATRAP-KO mice (Figure 4b, F=1.690, P=0.218, two-way repeated measures ANOVA). However, day-by-day sodium balance was significantly increased in ATRAP-KO mice compared with WT mice over the entire Ang II infusion period (Figure 4c, F=4.892, P=0.047, two-way repeated measures ANOVA). Furthermore, the extent of cumulative sodium balance during 14 days of Ang II infusion was significantly increased in ATRAP-KO mice as compared with WT mice (Figure 4d, P=0.047, unpaired t-test), consistent with blunted natriuresis as a mechanism for the exacerbation of Ang II-induced hypertension.
Figure 4.

Angiotensin II type 1 receptor (AT1R)–associated protein (ATRAP) deficiency exacerbates sodium retention during angiotensin II (Ang II) infusion. (a) Day-by-day sodium intake was comparable in the wild-type (WT) and ATRAP-knockout (KO) mice during the entire period of Ang II (2000 ng/kg/min) infusion (F=0.559, P=0.469, two-way repeated measures analysis of variance (ANOVA)). (b) Day-by-day urinary sodium excretion was comparable in the WT and ATRAP-KO mice during the entire period of Ang II infusion (F=1.690, P=0.218, two-way repeated measures ANOVA). (c) Day-by-day sodium balance was significantly increased in the ATRAP-KO mice compared with the WT mice for the whole period of Ang II infusion (F=4.892, P=0.047, two-way repeated measures ANOVA). (d) The extent of the cumulative positive sodium balance during the Ang II (2000 ng/kg/min) infusion period was significantly increased in the ATRAP-KO mice compared with the WT mice on metabolic cage analysis. Values are expressed as mean±s.e. (n=7–8 in each group). †P<0.05 versus WT mice.
ATRAP deficiency enhances renal expression of α-subunit of the epithelial sodium channel (αENaC) by chronic Ang II infusion
To investigate the mechanisms involved in the suppression of urinary sodium excretion in response to Ang II in ATRAP-KO mice, we compared renal expression of major sodium transporters (NHE3, sodium–potassium–two chloride cotransporter (NKCC2), Na+–Cl− cotransporter (NCC), and ENaC subunits). Age-matched WT and ATRAP-KO mice were divided into four groups: (1) vehicle-infused WT mice, (2) Ang II–infused WT mice, (3) vehicle-infused ATRAP-KO mice, and (4) Ang II–infused ATRAP-KO mice. There were no differences in the expression levels of NHE3 or NKCC mRNA and protein between WT and ATRAP-KO mice with or without Ang II infusion for 14 days (Figures 5a and b and 6a and b). On the other hand, although Ang II–mediated increase in NCC mRNA was significant only in ATRAP-KO mice (Figure 5c), renal expression of phosphorylated NCC, which is the activated NCC protein, was similarly increased by Ang II infusion in both groups (Figure 6c).
Figure 5.

Angiotensin II type 1 receptor (AT1R)–associated protein (ATRAP) deficiency enhances the upregulation of renal α-subunit of the epithelial sodium channel (αENaC) mRNA expression by chronic angiotensin II (Ang II) infusion. Effects of Ang II (2000 ng/kg/min) infusion for 14 days on the mRNA expression of the major sodium transporters (a, sodium-proton antiporter 3 (NHE3); b, sodium–potassium–two chloride cotransporter (NKCC2); c, Na+–Cl− cotransporter (NCC); d, αENaC; e, βENaC; and f, γENaC) in the kidneys of wild-type (WT) and ATRAP-knockout (KO) mice. Values are expressed as mean±s.e. (n=6–8 in each group). *P<0.05 versus vehicle, **P<0.01 versus vehicle, †P<0.05 versus WT mice.
Figure 6.

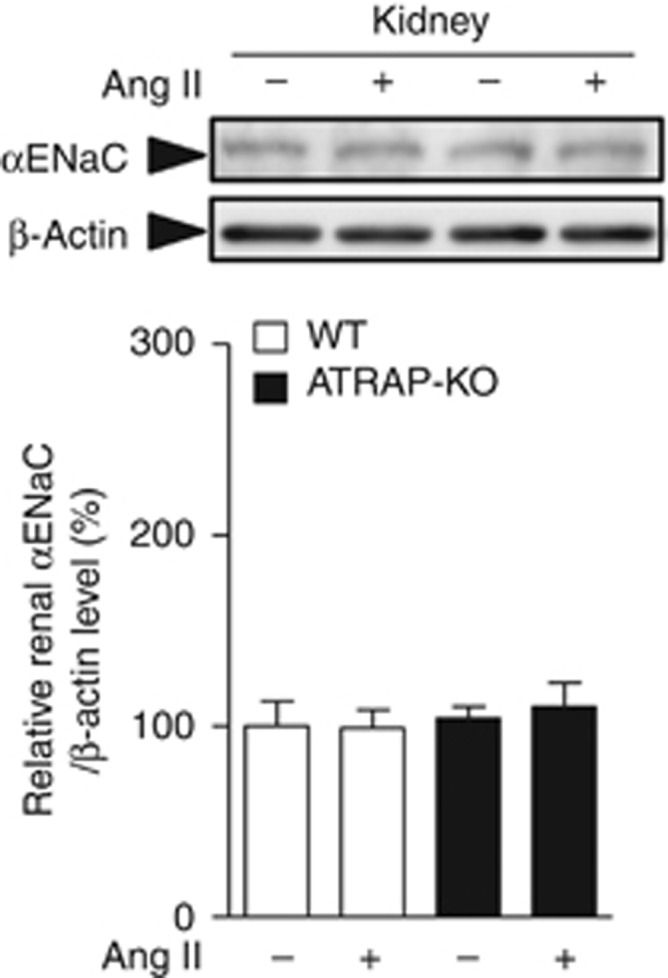
Angiotensin II type 1 receptor (AT1R)–associated protein (ATRAP) deficiency enhances upregulation of renal α-subunit of the epithelial sodium channel (αENaC) protein expression by chronic angiotensin II (Ang II) infusion. Effects of Ang II (2000 ng/kg/min) infusion for 14 days on protein expression of the major sodium transporters (a, sodium-proton antiporter 3 (NHE3); b, phosphorylated sodium–potassium–two chloride cotransporter (NKCC2) on Thr96; c, phosphorylated Na+–Cl− cotransporter (NCC) on Ser71; d, αENaC; e, βENaC; and f, γENaC) in the kidneys of wild-type (WT) and ATRAP-knockout (KO) mice. Values are expressed as mean±s.e. (n=6–8 in each group). *P<0.05 versus vehicle, **P<0.01 versus vehicle, †P<0.05 versus WT mice.
However, Ang II–mediated upregulation of αENaC, but not of βENaC or γENaC mRNA, was significantly enhanced in ATRAP-KO mice compared with WT mice (Figure 5d–f). Furthermore, although αENaC protein expression did not differ between WT and ATRAP-KO mice with vehicle, there was a significant Ang II–mediated increase in renal αENaC protein expression in ATRAP-KO mice (P=0.007 relative to vehicle-infused ATRAP-KO mice, P=0.042 relative to Ang II–infused WT mice, ANOVA; Figure 6d). Protein levels of βENaC and γENaC were similar in WT and ATRAP-KO mice (Figure 6e and f).
ATRAP deficiency–mediated enhancement of renal αENaC expression by chronic Ang II infusion is aldosterone independent
The promoting effect of Ang II infusion on expression of renal RAS components including AGT in proximal tubules has been reported.16, 17 Thus, to investigate the mechanisms involved in Ang II–induced renal αENaC expression in ATRAP-KO mice, renal AGT mRNA expression, urinary AGT excretion, and renal Ang II levels were analyzed. However, renal AGT mRNA expression and urinary AGT excretion were similar in WT and ATRAP-KO mice with vehicle, and exhibited no apparent changes by Ang II (Figure 7a and b). In addition, renal Ang II level was comparable in WT and ATRAP-KO mice with vehicle, and was significantly and similarly increased by Ang II in both WT and ATRAP-KO mice (Figure 7c). These results indicate that ATRAP deficiency exerts no apparent effect on proximal tubule AGT production or the renal Ang II levels.
Figure 7.

Angiotensin II type 1 receptor (AT1R)–associated protein (ATRAP) deficiency exerts no apparent effects on renal angiotensinogen (AGT) production or renal angiotensin II (Ang II) levels. (a) Quantitative analysis of the mRNA expression of renal AGT in the wild-type (WT) and ATRAP-knockout (KO) mice. Values are expressed as mean±s.e. (n=7–9 in each group). (b) Urinary AGT excretion in WT and ATRAP-KO mice after administration of vehicle or Ang II (2000 ng/kg/min) for 14 days. Values are expressed as mean±s.e. (n=6–7 in each group). (c) Renal Ang II levels in WT and ATRAP-KO mice after administration of vehicle or Ang II for 14 days. Values are expressed as mean±s.e. (n=7–9 in each group).
We next examined the plasma aldosterone concentration and urinary aldosterone excretion to investigate a possible role of aldosterone in the enhanced αENaC expression in response to Ang II. Under vehicle infusion, plasma aldosterone concentration (Figure 8a, 208.7±38.1 vs. 197.5±29.3 pg/ml, P=1.000, ANOVA) and urinary aldosterone excretion (Figure 8b, 5.2±0.6 vs. 4.6±0.8 ng/day, P=0.974, ANOVA) were comparable in WT and ATRAP-KO mice. Furthermore, Ang II infusion significantly and similarly increased plasma aldosterone concentration (Figure 8a, 1154.0±170.5 vs. 1464.5± 267.9 pg/ml, P=0.401, ANOVA) and urinary aldosterone excretion (Figure 8b, 19.2±0.5 vs. 15.9±2.1 ng/day, P=0126, ANOVA) in both WT and ATRAP-KO mice.
Figure 8.

Angiotensin II type 1 receptor (AT1R)–associated protein (ATRAP) deficiency did not affect plasma aldosterone concentration or urinary aldosterone excretion. (a) Plasma aldosterone concentration in wild-type (WT) and ATRAP-knockout (KO) mice after the administration of vehicle or Ang II (2000 ng/kg/min) for 14 days. Values are expressed as mean±s.e. (n=6 in each group). **P<0.01 versus vehicle. (b) Urinary aldosterone excretion in the WT and ATRAP-KO mice after administration of vehicle or Ang II for 14 days. Values are expressed as mean±s.e. (n=5–6 in each group). **P<0.01 versus vehicle.
We also administered exogenous aldosterone subcutaneously to WT and ATRAP-KO mice. Systolic BP measured by the tail-cuff method was similar in WT and ATRAP-KO mice by vehicle administration, and was similarly increased by chronic aldosterone infusion in both groups (Figure 9a). Furthermore, renal αENaC protein levels did not exhibit any significant difference between WT and ATRAP-KO mice with or without aldosterone (Figure 9b). These results would support the notion that ATRAP deficiency enhances renal αENaC expression in an aldosterone-independent manner.
Figure 9.

Angiotensin II type 1 receptor (AT1R)–associated protein (ATRAP) deficiency exerts no significant influence on the aldosterone (Ald)-induced changes in blood pressure (BP) and renal α-subunit of the epithelial sodium channel (αENaC) expression. (a) Systolic BP was similarly increased by aldosterone (50 μg/kg/day) infusion for 14 days in wild-type (WT) and ATRAP-knockout (KO) mice that were fed a normal (0.3%) sodium diet, and maintained on 1% NaCl in the drinking water. Values are expressed as mean±s.e. (n=5 in each group). **P<0.01 versus vehicle. (b) Effects of aldosterone infusion on the protein expression of the αENaC in the kidneys of WT and ATRAP-KO mice. Values are expressed as mean±s.e. (n=5 in each group).
ENaC is functionally activated in response to chronic Ang II simulation and promotes renal sodium retention in ATRAP deficiency
To examine whether ENaC activity was affected by the enhancement of renal αENaC expression in ATRAP-KO mice, diuretic test using a potent and specific ENaC inhibitor amiloride was performed, and the effects of ATRAP deficiency on the functional transport activity of ENaC were examined. Urinary sodium excretion and urinary volume after intraperitoneal injection of amiloride were significantly increased in the Ang II–infused ATRAP-KO as mice compared with the Ang II–infused WT mice (Figure 10a and b). This finding indicated that the ENaC is functionally activated in response to chronic Ang II simulation so as to increase renal sodium retention in ATRAP-KO mice.
Figure 10.

Angiotensin II type 1 receptor (AT1R)–associated protein (ATRAP) deficiency causes reinforcement of the urinary sodium excretory effects of amiloride administered after chronic angiotensin II (Ang II) infusion. (a) Urinary sodium excretion after amiloride (3 mg/kg) infusion was significantly increased in the Ang II (2000 ng/kg/min)–infused ATRAP-knockout (KO) mice compared with the Ang II–infused wild-type (WT) mice. (b) Urine volume after amiloride (3 mg/kg) infusion was further elevated in the Ang II–infused ATRAP-KO mice compared with the Ang II–infused WT mice. Values are expressed as mean±s.e. (n=5–7 in each group). †P<0.05 versus WT mice, ††P<0.01 versus WT mice.
ATRAP deficiency enhances Ang II–induced vasoconstriction
Although the renal αENaC protein expression in ATRAP-KO mice was significantly increased as compared with WT mice by chronic Ang II infusion for 14 days (Figure 6d), the αENaC protein expression levels just after the start of Ang II infusion (on day 1) did not differ significantly between WT and ATRAP-KO mice (Figure 11). On the other hand, telemetric BP showed a trend toward enhanced Ang II–induced BP elevation in ATRAP-KO mice, concomitant with a tendency of increase in day-by-day sodium balance in ATRAP-KO mice as compared with WT mice already during the early period of Ang II infusion (Figures 3 and 4).
Figure 11.
The renal α-subunit of the epithelial sodium channel (αENaC) protein expression levels just after the start of angiotensin II (Ang) II infusion did not differ significantly between the wild-type (WT) and angiotensin II type 1 receptor (AT1R)–associated protein (ATRAP)-knockout (KO) mice. Effects of Ang II (2000 ng/kg/min) infusion for 1 day on protein expression of the αENaC in the kidneys of WT and ATRAP-KO mice. Values are expressed as mean±s.e. (n=7–8 in each group).
Based on the above observations, we examined the vasoconstrictor response of artery rings to Ang II to investigate whether there would be an enhancement of vascular response to Ang II as one of the contributing factors to the exaggerated BP elevation in the initial phase of Ang II infusion in ATRAP-KO mice. Histological analysis of aortic sections revealed a normal vascular structure in ATRAP-KO mice, in spite of no vascular ATRAP immunostaining, without any alteration in aortic medial thickness in ATRAP-KO mice (Figure 12a and b). However, Ang II provoked an exaggerated vasoconstrictor response of vascular rings of ATRAP-KO mice compared with WT mice upon vessel wire myograph analysis (Figure 12c, F=8.583, P=0.015, two-way repeated measures ANOVA). This suggests a possible involvement of increased vasoconstriction in the initial stage of the exacerbation of Ang II–mediated hypertension in ATRAP-KO mice.
Figure 12.

Angiotensin II type 1 receptor (AT1R)–associated protein (ATRAP) deficiency enhances angiotensin II (Ang II)–induced vasoconstriction. (a) Immunohistochemistry for ATRAP in aorta sections from wild-type (WT) and ATRAP-knockout (KO) mice. The positive areas for ATRAP are evident as brown dots in the sections. Scale bar=50 μm. Original magnification × 400. (b) Elastica van Gieson staining of representative aorta sections from WT and ATRAP KO mice. Scale bar=50 μm. Original magnification × 400. (c) Ang II–induced vasoconstriction was significantly increased in the vascular ring of ATRAP-KO mice compared with that of WT mice. The concentration of Ang II was increased from 10−12 to 10−7 mol/l. Vasoconstriction responses to Ang II are expressed as the percentage of contraction induced by potassium-enriched solutions (22 mmol/l NaCl, 120 mmol/l KCl, 1.5 mmol/l CaCl2, 6 mmol/l glucose, 1 mmol/l MgCl2, and 5 mmol/l HEPES, pH 7.4). Values are expressed as mean±s.e. (n=6 in each group). †P<0.05 versus WT mice.
DISCUSSION
In this study it was demonstrated that systemic ATRAP deficiency does not exert any evident influence on baseline BP upon radiotelemetry or on renal structure and function. This is in sharp contrast to the reported phenotypic changes in the genetic deletion of other RAS components (that is, AGT, renin, and AT1R). These RAS-inactivated mice displayed significant decreases in baseline BP as well as pathological alterations in renal structure and function compared with the control mice.11, 12, 13, 14, 15
With respect to a possible effect of genetic alteration in ATRAP on BP regulation, a previous study examined phenotypic changes in systemic ATRAP gene-trap mice.18 These mice have a gene-trap cassette with splicing acceptor in ATRAP intron 4 and exhibit fusion of ATRAP exons 1 to 4 with β-galactosidase/neomycin resistance gene, with an elevated baseline BP concomitant with an increased plasma volume and lowered urinary pH.18 This previous study suggested an augmented baseline NHE3-dependent sodium reabsorption in proximal tubules of these mice, and the authors proposed a regulatory role for proximal tubule ATRAP in modulation of renal sodium handling and baseline BP.18 However, the phenotypic difference in these ATRAP gene-trap mice might be because of aberrant ATRAP-gal/neo protein production. In addition, the strain of ATRAP gene-trap and control mice used for comparison were not reported,18 thereby making it difficult to properly interpret their BP data. Furthermore, the previously reported systemic ATRAP transgenic mice (TGM) produced separately in both our laboratory and a distinct laboratory exhibited no baseline BP changes.19, 20 These findings support the results of the present study, showing an absence of BP change at baseline in ATRAP-KO mice.
In contrast to the lack of any evident change in baseline BP in ATRAP-KO mice, Ang II–mediated hypertension was significantly exacerbated in ATRAP-KO mice concomitant with an increased sodium balance compared with WT mice. With respect to the mechanisms involved in Ang II–induced hypertension, previous studies using a series of kidney cross-transplant experiments showed that activation of the intrarenal Ang II–AT1R axis is critically important for both Ang II–dependent hypertension and end-organ damage.21, 22, 23
Sodium reabsorption through renal proximal and distal tubules is reportedly regulated by the activity of the intrarenal Ang II–AT1R axis.24 The proximal tubule AT1R directly affects BP regulation because a major portion of the glomerular filtrate is reabsorbed in proximal tubules, and proximal tubule sodium transport is considered a major determinant of the pressure natriuresis response.25 The proximal tubule–specific AT1R-deficient mice exhibited a partial suppression of Ang II–induced BP elevation as well as a decrease in baseline BP compared with control mice, concomitant with Ang II–induced reduction in NHE3 expression.26 On the other hand, another type of proximal tubule–specific AT1R-deficient mouse exhibited a significant reduction in baseline BP, but without any evident inhibition of Ang II–induced hypertension in comparison with control mice.27 These results indicate that activation of AT1R signaling in renal proximal tubules is unable to fully account for the positive effect of Ang II on BP increase.
Regarding the role of distal tubules in renal sodium handling by the Ang II–AT1R axis, previous studies showed that distal nephron segments also have a crucial role in the regulation of sodium reabsorption via intrarenal RAS.28, 29 The modulation of sodium reabsorption in response to Ang II is mediated by NCC and ENaC in the distal nephron.30, 31, 32, 33, 34, 35 These findings support the notion that the renal distal tubules also have a role in sodium reabsorption that takes place in response to Ang II. Recently, we generated renal distal tubule–dominant ATRAP TGM (renal distal convoluted tubule-ATRAP TGM).8 The renal distal convoluted tubule-ATRAP TGM exhibited a significant amelioration of Ang II–induced hypertension, in spite of no change in baseline BP, at least partly via a suppression of the upregulation of renal αENaC expression by Ang II stimulation,8 thereby suggesting a regulatory role of distal tubule ATRAP in the regulation of renal sodium handling. With respect to the intrarenal distribution of ATRAP, its protein was found to be widely and abundantly expressed along both the proximal and distal tubules. Thus, it is important to determine which of the functional effects of renal tubule ATRAP (that is, proximal tubule ATRAP or distal tubule ATRAP) is more relevant to the regulation of renal sodium handling that modulates BP response under pathological conditions such as Ang II infusion.
In this study, the renal expression of NHE3, a major sodium transporter in proximal tubules, as well as of urinary pH, which reflects proximal tubule NHE3 activity, and renal AGT production (both mRNA expression and urinary excretion) were similar in WT and ATRAP-KO mice. These results suggest that sodium reabsorption by NHE3 in proximal tubules was not affected by ATRAP deficiency and an increase in sodium reabsorption in proximal tubules by Ang II–AT1R axis is not likely to play a major role in the exacerbation of Ang II–induced hypertension that occurs in ATRAP-KO mice. In addition, renal AGT production and renal Ang II content were similar with or without Ang II. The positive feedback loop of Ang II to its substrate AGT has been demonstrated in various tissues, including liver,36, 37 heart,38, 39 and adipose tissue.40, 41 However, in the kidney, the feedback loop of Ang II to AGT is regulated in a dose-dependent manner.16, 17, 42, 43 Although a low dose of Ang II infusion reportedly increases AGT levels in the kidney,16 a high dose did not change them.17 Accordingly, these results suggest that systemic ATRAP deficiency did not affect renal AGT production, resulting in an unaltered renal Ang II level.
On the other hand, the Ang II–induced stimulation of renal expression and activity of ENaC, a major sodium transporter in distal tubules, was significantly enhanced in ATRAP-KO mice compared with WT mice. Although aldosterone is one of the major positive regulators of ENaC, both the circulating and urinary aldosterone levels were comparable in the two groups, and the BP response and renal ENaC expression by chronic aldosterone infusion were not affected in ATRAP-KO mice, thereby excluding aldosterone as a major contributor to the enhancement of the Ang II–induced activation of ENaC.
ENaC is formed by three homologous subunits (α, β, and γ) and coexpression of all three subunits is needed to induce maximal channel activity, and αENaC has a critical role in the formation of a functional ion channel.44, 45 With respect to the possible direct effects of Ang II on ENaC, Ang II reportedly stimulates distal sodium transport activity via an upregulation of αENaC expression and an enhancement of ENaC activity by modulation of the probability of the channel being open.35, 46, 47, 48, 49 A recent study has also shown that Ang II directly promotes translocation of αENaC to the apical plasma membrane and increases the number of functionally active channels in vivo.50 Considering these reports, posttranslational modifications that alter trafficking or function of the channel, as well as an increase in αENaC expression, may contribute to the enhanced ENaC function that occurs in ATRAP-KO mice. Further studies are needed to investigate these possible mechanisms.
Finally, with respect to the mechanisms of the initiation process of exacerbation of Ang II–mediated hypertension in ATRAP-KO mice, although Ang II–induced sodium retention and BP elevation tended to be different between ATRAP-KO and WT mice even during the early phase of Ang II infusion, the renal αENaC protein expression level was comparable on day 1 of Ang II infusion. These findings suggest that changes in glomerular hemodynamics, glomerular filtration rate, and vasoconstriction may be involved in the differences in sodium balance and BP elevation that occur during the early phase of Ang II infusion. Indeed, Ang II induced greater vasoconstrictor responses in the vascular ring of ATRAP-KO mice than WT mice. Enhancement of Ang II–induced vasoconstriction because of ATRAP deficiency may be one of the mechanisms underlying the exacerbation of Ang II–mediated hypertension, particularly in the early initiation period.
In summary, these results indicate that the pathological activation of renal tubular AT1R in response to chronic Ang II infusion, which is enhanced by ATRAP deficiency, directly provokes ENaC activation in distal tubules, so as to promote sodium retention in an aldosterone-independent manner and to contribute to the exacerbation of Ang II–mediated hypertension. As we employed systemic ATRAP-KO mice in this study, it is not practical to examine the nephron segment–specific effect of ATRAP. Further investigation is needed to elucidate the in vivo functional roles of ATRAP in a nephron segment–specific manner, including its possible interaction with sodium transporters other than ENaC. Such investigation, including the use of conditional gene KO mice, will be taken up in due course.
MATERIALS AND METHODS
Targeted disruption of the gene encoding ATRAP/Agtrap in C57BL/6 mice
We employed a targeted gene disruption strategy to produce ATRAP-KO mice (C57BL/6) as described previously.51 All experiments were performed with ATRAP-KO mice and their WT littermates. This study was performed in accordance with the National Institutes of Health guidelines for the use of experimental animals. All animal studies were reviewed and approved by the Animal Studies Committee of Yokohama City University.
Quantitative real-time reverse transcriptase–PCR analysis
Quantitative real-time reverse transcriptase–PCR was performed using designed TaqMan probes (Agtrap, Mm00507771_m1; AT1R, Mm01957722_s1; NHE3, Mm01352473_m1; NKCC2, Mm01275821_m1; NCC, Mm00490213_m1; αENaC, Mm00803386_m1; βENaC, Mm00441215_m1; γENaC, Mm00441228_m1; and AGT, Mm00599662_m1; Applied Biosystems, Carlsbad, CA), as described previously.8 The mRNA levels were normalized to those of the 18S rRNA control.
Histological and immunohistochemical analysis
Immunohistochemistry was performed as described previously.10, 20, 52, 53 The sections were incubated with one of the following: (1) anti-ATRAP antibody diluted to 1:100, (2) anti-aquaporin 2 antibody (1:200; 254-271, CALBIOCHEM, Darmstadt, Germany), (3) anti-calbindin D-28K antibody (1:3000; C9848, Sigma-Aldrich, St Louis, MO), or (4) anti-megalin antibody (1:1000; NB110-96417, Novus Biologicals, Littleton, CO).
Ang II infusion and BP measurement by radiotelemetric method
Direct BP measurement was performed by radiotelemetric method using a BP transducer (Model TA11PA-C10; Data Science International, New Brighton, MN) as described previously.6, 8, 54 Ang II (500 or 2000 ng/kg/min) was infused subcutaneously into the mice via an osmotic minipump (Model 2002, ALZET, Palo Alto, CA) and hemodynamic measurements were recorded every 5 min using the software Dataquest A.R.T. 4.1 (Data Science International). Baseline BP values were the average of three consecutive days.
Metabolic cage analysis
All mice (male, 11 weeks of age) were fed a normal diet (0.3% NaCl) throughout this. Mice were acclimated for a week to metabolic cages (Techniplast, Buguggiate, Italy) before Ang II (2000 ng/kg/min) infusion. Body weight, food intake, and water intake were measured daily, and urine was collected.
Diuretic test
The diuretic test using a 0.3 mg/ml amiloride solution in 10% dimethyl sulfoxide was performed essentially as described previously.55 After Ang II infusion (2000 ng/kg/min) for 14 days, mice were subsequently injected intraperitoneally with 40 μl/g saline to facilitate spontaneous voiding. At 1 h after saline injection, amiloride (3 mg/kg) was intraperitoneally injected. The dose of amiloride was determined based on a previous study.56 Urine was collected every hour by spontaneous voiding or bladder massage, and urine volume and sodium excretion were measured.
Aldosterone infusion and BP measurement by tail-cuff method
Mice (male, 11 weeks of age), fed a normal diet (0.3% NaCl) with 1% NaCl in the drinking water, were subcutaneously infused with aldosterone (50 μg/kg/day) via an osmotic minipump for 14 days.57, 58 Measurement of systolic BP by the tail-cuff method (BP monitor MK-2000; Muromachi Kikai, Tokyo, Japan) was performed.20, 59
Membranous protein extraction and immunoblot analysis for epithelial sodium transporters
Membranous proteins were extracted from kidneys using the Plasma Membrane Extraction Kit (K268-50; Biovision, Milpitas, CA), and immunoblot analysis was performed as described previously.6, 8, 10, 20 Antibodies against NHE3 (NHE31-A, Alpha Diagnostic International, San Antonio, TX), phospho-NKCC2 on Thr96 (kindly provided by Dr Shih-Hua Lin, Tri-Service General Hospital, Taipei, Taiwan),60 phospho-NCC on Ser71,61 αENaC (PA1-920A, Affinity Bioreagents, Golden, CO), βENaC (ENACb21-A, Alpha Diagnostic), and γENaC (ab3468, Abcam, Cambridge, UK) were used.
Biochemical assay
Plasma and urinary aldosterone concentrations were determined using the radioimmunoassay (RIA) kit (SPAC-S Aldosterone Kit; TFB, Tokyo, Japan). Urinary AGT level was determined using the sandwich enzyme-linked immunosorbent assay, as described previously.62 Urinary creatinine, sodium, albumin, and serum creatinine were assessed using an autoanalyzer (Hitachi 7180; Hitachi, Tokyo, Japan). Urinary pH was determined with a pH glass electrode (TwinPH B-212; Horiba, Kyoto, Japan). Renal Ang II level was measured by RIA as described previously.63
Vessel wire myograph study
Isometric tension of aortic vascular rings from ATRAP-KO and WT mice was measured using a two-channel myograph (Dual Wire myograph system 410A; Unique Medical, Tokyo, Japan), as described previously.64, 65 The vascular rings were treated with Ang II (10−12 to 10−7 mol/l) and potassium-enriched solutions to stimulate vasoconstriction.
Statistical analysis
All data are shown as mean±s.e. Differences were analyzed by Student's unpaired t-test or ANOVA for multiple comparisons. Differences between groups for categorical variables were analyzed using the χ2-test. The P-values of <0.05 were considered statistically significant.
Acknowledgments
This work was supported by a Health and Labor Sciences Research grant and by grants from the Japanese Ministry of Education, Science, Sports and Culture, the Salt Science Research Foundation (no. 1134), the Yokohama Foundation for Advancement of Medical Science, the Kidney Foundation, Japan (JKFB13-17), and the Novartis Foundation for Gerontological Research (2012).
All the authors declared no competing interests.
References
- Guyton AC. Blood pressure control—special role of the kidneys and body fluids. Science. 1991;252:1813–1816. doi: 10.1126/science.2063193. [DOI] [PubMed] [Google Scholar]
- Daviet L, Lehtonen JY, Tamura K, et al. Cloning and characterization of ATRAP, a novel protein that interacts with the angiotensin II type 1 receptor. J Biol Chem. 1999;274:17058–17062. doi: 10.1074/jbc.274.24.17058. [DOI] [PubMed] [Google Scholar]
- Lopez-Ilasaca M, Liu X, Tamura K, et al. The angiotensin II type I receptor-associated protein, ATRAP, is a transmembrane protein and a modulator of angiotensin II signaling. Mol Biol Cell. 2003;14:5038–5050. doi: 10.1091/mbc.E03-06-0383. [DOI] [PMC free article] [PubMed] [Google Scholar]
- Tanaka Y, Tamura K, Koide Y, et al. The novel angiotensin II type 1 receptor (AT1R)-associated protein ATRAP downregulates AT1R and ameliorates cardiomyocyte hypertrophy. FEBS Lett. 2005;579:1579–1586. doi: 10.1016/j.febslet.2005.01.068. [DOI] [PubMed] [Google Scholar]
- Azuma K, Tamura K, Shigenaga A, et al. Novel regulatory effect of angiotensin II type 1 receptor-interacting molecule on vascular smooth muscle cells. Hypertension. 2007;50:926–932. doi: 10.1161/HYPERTENSIONAHA.107.096115. [DOI] [PubMed] [Google Scholar]
- Wakui H, Tamura K, Tanaka Y, et al. Cardiac-specific activation of angiotensin II type 1 receptor-associated protein completely suppresses cardiac hypertrophy in chronic angiotensin II-infused mice. Hypertension. 2010;55:1157–1164. doi: 10.1161/HYPERTENSIONAHA.109.147207. [DOI] [PubMed] [Google Scholar]
- Tamura K, Wakui H, Maeda A, et al. The physiology and pathophysiology of a novel angiotensin receptor-binding protein ATRAP/Agtrap. Curr Pharm Des. 2013;19:3043–3048. doi: 10.2174/1381612811319170010. [DOI] [PubMed] [Google Scholar]
- Wakui H, Tamura K, Masuda S, et al. Enhanced angiotensin receptor-associated protein in renal tubule suppresses angiotensin-dependent hypertension. Hypertension. 2013;61:1203–1210. doi: 10.1161/HYPERTENSIONAHA.111.00572. [DOI] [PMC free article] [PubMed] [Google Scholar]
- Masuda S, Tamura K, Wakui H, et al. Expression of angiotensin II type 1 receptor-interacting molecule in normal human kidney and IgA nephropathy. Am J Physiol Renal Physiol. 2010;299:F720–F731. doi: 10.1152/ajprenal.00667.2009. [DOI] [PubMed] [Google Scholar]
- Tsurumi Y, Tamura K, Tanaka Y, et al. Interacting molecule of AT1 receptor, ATRAP, is colocalized with AT1 receptor in the mouse renal tubules. Kidney Int. 2006;69:488–494. doi: 10.1038/sj.ki.5000130. [DOI] [PubMed] [Google Scholar]
- Tanimoto K, Sugiyama F, Goto Y, et al. Angiotensinogen-deficient mice with hypotension. J Biol Chem. 1994;269:31334–31337. [PubMed] [Google Scholar]
- Niimura F, Labosky PA, Kakuchi J, et al. Gene targeting in mice reveals a requirement for angiotensin in the development and maintenance of kidney morphology and growth factor regulation. J Clin Invest. 1995;96:2947–2954. doi: 10.1172/JCI118366. [DOI] [PMC free article] [PubMed] [Google Scholar]
- Kihara M, Umemura S, Sumida Y, et al. Genetic deficiency of angiotensinogen produces an impaired urine concentrating ability in mice. Kidney Int. 1998;53:548–555. doi: 10.1046/j.1523-1755.1998.00801.x. [DOI] [PubMed] [Google Scholar]
- Oliverio MI, Kim HS, Ito M, et al. Reduced growth, abnormal kidney structure, and type 2 (AT2) angiotensin receptor-mediated blood pressure regulation in mice lacking both AT1A and AT1B receptors for angiotensin II. Proc Natl Acad Sci USA. 1998;95:15496–15501. doi: 10.1073/pnas.95.26.15496. [DOI] [PMC free article] [PubMed] [Google Scholar]
- Yanai K, Saito T, Kakinuma Y, et al. Renin-dependent cardiovascular functions and renin-independent blood-brain barrier functions revealed by renin-deficient mice. J Biol Chem. 2000;275:5–8. doi: 10.1074/jbc.275.1.5. [DOI] [PubMed] [Google Scholar]
- Kobori H, Harrison-Bernard LM, Navar LG. Expression of angiotensinogen mRNA and protein in angiotensin II-dependent hypertension. J Am Soc Nephrol. 2001;12:431–439. doi: 10.1681/asn.v123431. [DOI] [PMC free article] [PubMed] [Google Scholar]
- Gonzalez-Villalobos RA, Seth DM, Satou R, et al. Intrarenal angiotensin II and angiotensinogen augmentation in chronic angiotensin II-infused mice. Am J Physiol Renal Physiol. 2008;295:F772–F779. doi: 10.1152/ajprenal.00019.2008. [DOI] [PMC free article] [PubMed] [Google Scholar]
- Oppermann M, Gess B, Schweda F, et al. Atrap deficiency increases arterial blood pressure and plasma volume. J Am Soc Nephrol. 2010;21:468–477. doi: 10.1681/ASN.2009060658. [DOI] [PMC free article] [PubMed] [Google Scholar]
- Oshita A, Iwai M, Chen R, et al. Attenuation of inflammatory vascular remodeling by angiotensin II type 1 receptor-associated protein. Hypertension. 2006;48:671–676. doi: 10.1161/01.HYP.0000238141.99816.47. [DOI] [PubMed] [Google Scholar]
- Wakui H, Tamura K, Matsuda M, et al. Intrarenal suppression of angiotensin II type 1 receptor binding molecule in angiotensin II-infused mice. Am J Physiol Renal Physiol. 2010;299:F991–F1003. doi: 10.1152/ajprenal.00738.2009. [DOI] [PubMed] [Google Scholar]
- Coffman TM, Crowley SD. Kidney in hypertension: guyton redux. Hypertension. 2008;51:811–816. doi: 10.1161/HYPERTENSIONAHA.105.063636. [DOI] [PubMed] [Google Scholar]
- Crowley SD, Gurley SB, Herrera MJ, et al. Angiotensin II causes hypertension and cardiac hypertrophy through its receptors in the kidney. Proc Natl Acad Sci USA. 2006;103:17985–17990. doi: 10.1073/pnas.0605545103. [DOI] [PMC free article] [PubMed] [Google Scholar]
- Crowley SD, Zhang J, Herrera M, et al. Role of AT receptor-mediated salt retention in angiotensin II-dependent hypertension. Am J Physiol Renal Physiol. 2011;301:F1124–F1130. doi: 10.1152/ajprenal.00305.2011. [DOI] [PMC free article] [PubMed] [Google Scholar]
- Kobori H, Nangaku M, Navar LG, et al. The intrarenal renin-angiotensin system: from physiology to the pathobiology of hypertension and kidney disease. Pharmacol Rev. 2007;59:251–287. doi: 10.1124/pr.59.3.3. [DOI] [PubMed] [Google Scholar]
- McDonough AA, Leong PK, Yang LE. Mechanisms of pressure natriuresis: how blood pressure regulates renal sodium transport. Ann NY Acad Sci. 2003;986:669–677. doi: 10.1111/j.1749-6632.2003.tb07281.x. [DOI] [PubMed] [Google Scholar]
- Gurley SB, Riquier-Brison AD, Schnermann J, et al. AT1A angiotensin receptors in the renal proximal tubule regulate blood pressure. Cell Metab. 2011;13:469–475. doi: 10.1016/j.cmet.2011.03.001. [DOI] [PMC free article] [PubMed] [Google Scholar]
- Li H, Weatherford ET, Davis DR, et al. Renal proximal tubule angiotensin AT1A receptors regulate blood pressure. Am J Physiol Regul Integr Comp Physiol. 2011;301:R1067–R1077. doi: 10.1152/ajpregu.00124.2011. [DOI] [PMC free article] [PubMed] [Google Scholar]
- Navar LG, Kobori H, Prieto MC, et al. Intratubular renin-angiotensin system in hypertension. Hypertension. 2011;57:355–362. doi: 10.1161/HYPERTENSIONAHA.110.163519. [DOI] [PMC free article] [PubMed] [Google Scholar]
- Prieto-Carrasquero MC, Botros FT, Kobori H, et al. Collecting duct renin: a major player in angiotensin II-dependent hypertension. J Am Soc Hypertens. 2009;3:96–104. doi: 10.1016/j.jash.2008.11.003. [DOI] [PMC free article] [PubMed] [Google Scholar]
- Castaneda-Bueno M, Cervantes-Perez LG, Vazquez N, et al. Activation of the renal Na+:Cl- cotransporter by angiotensin II is a WNK4-dependent process. Proc Natl Acad Sci USA. 2012;109:7929–7934. doi: 10.1073/pnas.1200947109. [DOI] [PMC free article] [PubMed] [Google Scholar]
- Christensen BM, Perrier R, Wang Q, et al. Sodium and potassium balance depends on alphaENaC expression in connecting tubule. J Am Soc Nephrol. 2010;21:1942–1951. doi: 10.1681/ASN.2009101077. [DOI] [PMC free article] [PubMed] [Google Scholar]
- Peti-Peterdi J, Warnock DG, Bell PD. Angiotensin II directly stimulates ENaC activity in the cortical collecting duct via AT(1) receptors. J Am Soc Nephrol. 2002;13:1131–1135. doi: 10.1097/01.asn.0000013292.78621.fd. [DOI] [PubMed] [Google Scholar]
- San-Cristobal P, Pacheco-Alvarez D, Richardson C, et al. Angiotensin II signaling increases activity of the renal Na-Cl cotransporter through a WNK4-SPAK-dependent pathway. Proc Natl Acad Sci USA. 2009;106:4384–4389. doi: 10.1073/pnas.0813238106. [DOI] [PMC free article] [PubMed] [Google Scholar]
- van der Lubbe N, Lim CH, Fenton RA, et al. Angiotensin II induces phosphorylation of the thiazide-sensitive sodium chloride cotransporter independent of aldosterone. Kidney Int. 2011;79:66–76. doi: 10.1038/ki.2010.290. [DOI] [PubMed] [Google Scholar]
- Zhao D, Seth DM, Navar LG. Enhanced distal nephron sodium reabsorption in chronic angiotensin II-infused mice. Hypertension. 2009;54:120–126. doi: 10.1161/HYPERTENSIONAHA.109.133785. [DOI] [PMC free article] [PubMed] [Google Scholar]
- Klett C, Bader M, Ganten D, et al. Mechanism by which angiotensin II stabilizes messenger RNA for angiotensinogen. Hypertension. 1994;23:I120–I125. doi: 10.1161/01.hyp.23.1_suppl.i120. [DOI] [PubMed] [Google Scholar]
- Brasier AR, Li J. Mechanisms for inducible control of angiotensinogen gene transcription. Hypertension. 1996;27:465–475. doi: 10.1161/01.hyp.27.3.465. [DOI] [PubMed] [Google Scholar]
- Herrmann HC, Dzau VJ. The feedback regulation of angiotensinogen production by components of the renin-angiotensin system. Circ Res. 1983;52:328–334. doi: 10.1161/01.res.52.3.328. [DOI] [PubMed] [Google Scholar]
- Tamura K, Umemura S, Nyui N, et al. Activation of angiotensinogen gene in cardiac myocytes by angiotensin II and mechanical stretch. Am J Physiol. 1998;275:R1–R9. doi: 10.1152/ajpregu.1998.275.1.R1. [DOI] [PubMed] [Google Scholar]
- Hainault I, Nebout G, Turban S, et al. Adipose tissue-specific increase in angiotensinogen expression and secretion in the obese (fa/fa) Zucker rat. Am J Physiol Endocrinol Metab. 2002;282:E59–E66. doi: 10.1152/ajpendo.2002.282.1.E59. [DOI] [PubMed] [Google Scholar]
- Lu H, Boustany-Kari CM, Daugherty A, et al. Angiotensin II increases adipose angiotensinogen expression. Am J Physiol Endocrinol Metab. 2007;292:E1280–E1287. doi: 10.1152/ajpendo.00277.2006. [DOI] [PubMed] [Google Scholar]
- Schunkert H, Ingelfinger JR, Jacob H, et al. Reciprocal feedback regulation of kidney angiotensinogen and renin mRNA expressions by angiotensin II. Am J Physiol. 1992;263:E863–E869. doi: 10.1152/ajpendo.1992.263.5.E863. [DOI] [PubMed] [Google Scholar]
- Ingelfinger JR, Jung F, Diamant D, et al. Rat proximal tubule cell line transformed with origin-defective SV40 DNA: autocrine ANG II feedback. Am J Physiol. 1999;276:F218–F227. doi: 10.1152/ajprenal.1999.276.2.F218. [DOI] [PubMed] [Google Scholar]
- Canessa CM, Schild L, Buell G, et al. Amiloride-sensitive epithelial Na+ channel is made of three homologous subunits. Nature. 1994;367:463–467. doi: 10.1038/367463a0. [DOI] [PubMed] [Google Scholar]
- Pratt JH. Central role for ENaC in development of hypertension. J Am Soc Nephrol. 2005;16:3154–3159. doi: 10.1681/ASN.2005050460. [DOI] [PubMed] [Google Scholar]
- Beutler KT, Masilamani S, Turban S, et al. Long-term regulation of ENaC expression in kidney by angiotensin II. Hypertension. 2003;41:1143–1150. doi: 10.1161/01.HYP.0000066129.12106.E2. [DOI] [PubMed] [Google Scholar]
- Mamenko M, Zaika O, Ilatovskaya DV, et al. Angiotensin II increases activity of the epithelial Na+ channel (ENaC) in distal nephron additively to aldosterone. J Biol Chem. 2012;287:660–671. doi: 10.1074/jbc.M111.298919. [DOI] [PMC free article] [PubMed] [Google Scholar]
- Sun P, Yue P, Wang WH. Angiotensin II stimulates epithelial sodium channels in the cortical collecting duct of the rat kidney. Am J Physiol Renal Physiol. 2012;302:F679–F687. doi: 10.1152/ajprenal.00368.2011. [DOI] [PMC free article] [PubMed] [Google Scholar]
- Zaika O, Mamenko M, Staruschenko A, et al. Direct activation of ENaC by Angiotensin II: recent advances and new insights. Curr Hypertens Rep. 2013;15:17–24. doi: 10.1007/s11906-012-0316-1. [DOI] [PMC free article] [PubMed] [Google Scholar]
- Mamenko M, Zaika O, Prieto MC, et al. Chronic angiotensin II infusion drives extensive aldosterone-independent epithelial Na+ channel activation. Hypertension. 2013;62:1111–1122. doi: 10.1161/HYPERTENSIONAHA.113.01797. [DOI] [PMC free article] [PubMed] [Google Scholar]
- Maeda A, Tamura K, Wakui H, et al. Angiotensin receptor-binding protein ATRAP/Agtrap inhibits metabolic dysfunction with visceral obesity. J Am Heart Assoc. 2013;2:e000312. doi: 10.1161/JAHA.113.000312. [DOI] [PMC free article] [PubMed] [Google Scholar]
- Sato K, Kihara M, Hashimoto T, et al. Alterations in renal endothelial nitric oxide synthase expression by salt diet in angiotensin type-1a receptor gene knockout mice. J Am Soc Nephrol. 2004;15:1756–1763. doi: 10.1097/01.asn.0000130922.75125.b8. [DOI] [PubMed] [Google Scholar]
- Matsuda M, Tamura K, Wakui H, et al. Involvement of Runx3 in the basal transcriptional activation of the mouse angiotensin II type 1 receptor-associated protein gene. Physiol Genomics. 2011;43:884–894. doi: 10.1152/physiolgenomics.00005.2011. [DOI] [PubMed] [Google Scholar]
- Wakui H, Dejima T, Tamura K, et al. Activation of angiotensin II type 1 receptor-associated protein exerts an inhibitory effect on vascular hypertrophy and oxidative stress in angiotensin II-mediated hypertension. Cardiovasc Res. 2013;100:511–519. doi: 10.1093/cvr/cvt225. [DOI] [PubMed] [Google Scholar]
- Nomura N, Tajima M, Sugawara N, et al. Generation and analyses of R8L barttin knockin mouse. Am J Physiol Renal Physiol. 2011;301:F297–F307. doi: 10.1152/ajprenal.00604.2010. [DOI] [PubMed] [Google Scholar]
- Wang W, Shen J, Cui Y, et al. Impaired sodium excretion and salt-sensitive hypertension in corin-deficient mice. Kidney Int. 2012;82:26–33. doi: 10.1038/ki.2012.41. [DOI] [PMC free article] [PubMed] [Google Scholar]
- Leopold JA, Dam A, Maron BA, et al. Aldosterone impairs vascular reactivity by decreasing glucose-6-phosphate dehydrogenase activity. Nat Med. 2007;13:189–197. doi: 10.1038/nm1545. [DOI] [PMC free article] [PubMed] [Google Scholar]
- Chiga M, Rai T, Yang SS, et al. Dietary salt regulates the phosphorylation of OSR1/SPAK kinases and the sodium chloride cotransporter through aldosterone. Kidney Int. 2008;74:1403–1409. doi: 10.1038/ki.2008.451. [DOI] [PubMed] [Google Scholar]
- Sakai M, Tamura K, Tsurumi Y, et al. Expression of MAK-V/Hunk in renal distal tubules and its possible involvement in proliferative suppression. Am J Physiol Renal Physiol. 2007;292:F1526–F1536. doi: 10.1152/ajprenal.00451.2006. [DOI] [PubMed] [Google Scholar]
- Yang SS, Lo YF, Wu CC, et al. SPAK-knockout mice manifest Gitelman syndrome and impaired vasoconstriction. J Am Soc Nephrol. 2010;21:1868–1877. doi: 10.1681/ASN.2009121295. [DOI] [PMC free article] [PubMed] [Google Scholar]
- Yang SS, Morimoto T, Rai T, et al. Molecular pathogenesis of pseudohypoaldosteronism type II: generation and analysis of a Wnk4(D561A/+) knockin mouse model. Cell Metab. 2007;5:331–344. doi: 10.1016/j.cmet.2007.03.009. [DOI] [PubMed] [Google Scholar]
- Kobori H, Katsurada A, Miyata K, et al. Determination of plasma and urinary angiotensinogen levels in rodents by newly developed ELISA. Am J Physiol Renal Physiol. 2008;294:F1257–F1263. doi: 10.1152/ajprenal.00588.2007. [DOI] [PMC free article] [PubMed] [Google Scholar]
- Nishiyama A, Seth DM, Navar LG. Renal interstitial fluid concentrations of angiotensins I and II in anesthetized rats. Hypertension. 2002;39:129–134. doi: 10.1161/hy0102.100536. [DOI] [PubMed] [Google Scholar]
- Akaike T, Jin MH, Yokoyama U, et al. T-type Ca2+ channels promote oxygenation-induced closure of the rat ductus arteriosus not only by vasoconstriction but also by neointima formation. J Biol Chem. 2009;284:24025–24034. doi: 10.1074/jbc.M109.017061. [DOI] [PMC free article] [PubMed] [Google Scholar]
- Kobayashi Y, Hirawa N, Tabara Y, et al. Mice lacking hypertension candidate gene ATP2B1 in vascular smooth muscle cells show significant blood pressure elevation. Hypertension. 2012;59:854–860. doi: 10.1161/HYPERTENSIONAHA.110.165068. [DOI] [PubMed] [Google Scholar]