Abstract
We established a method for bioluminescence imaging (BLI) to track real-time gene expression in live Drosophila embryos. We constructed a transgenesis vector containing multiple cloning sites and enhanced green-emitting luciferase (ELuc; Emerald Luc), a brighter and pH-insensitive luciferase for promoter analysis. To evaluate the utility of BLI using an ELuc reporter together with an optimized microscope system, we visualized the expression pattern of armadillo (arm), a member of the Wnt pathway in Drosophila, throughout embryogenesis. We generated transgenic flies carrying the arm:: ELuc fusion gene, and successfully performed BLI continuously for 22 h in the same embryos. Our study showed, for the first time, that arm::Eluc expression was dramatically increased in the anterior midgut rudiment, myoblasts of the dorsal/lateral musculature, and the posterior spiracle after stage 13, and the cephalic region at stage 17. To further demonstrate the application of our BLI system, we revealed that arm transcriptional activity in embryos was modulated inversely by treatment with ionomycin or 6-bromoindirubin-3-oxime (BIO), an inhibitor and activator of Wnt/β-catenin signaling, respectively. Therefore, our microscopic BLI system is useful for monitoring gene expression in live Drosophila embryos, and for investigating regulatory mechanisms by using chemicals and mutations that might affect expression.
ᅟ
Electronic supplementary material
The online version of this article (doi:10.1007/s00216-014-8000-8) contains supplementary material, which is available to authorized users.
Keywords: Bioluminescence imaging, ELuc, Armadillo promoter, Ionomycin, BIO, Drosophila embryogenesis
Introduction
The analysis of gene expression has been widely used as an essential approach to understand complex biological processes. To date, several histological approaches have been employed to better understand the spatiotemporal expression pattern of genes. In addition, live observations have been developed as important techniques to evaluate the effect of genetic manipulations or pharmacological treatments on target gene expression [1–3]. Fluorescent proteins such as GFP from the jellyfish Aequorea victoria are applicable for use in live imaging as promoter reporters [4] or as tags for gene products [5]. However, the excitation light required for fluorescence imaging might damage samples owing to phototoxicity, and imaging could be challenging because of autofluorescent backgrounds in live specimens [6–8]. By contrast, the problems associated with fluorescence imaging can be solved using bioluminescence (luciferin-luciferase) imaging (BLI). Although luciferase is widely used as a spatiotemporal reporter of gene expression [9–11], the bioluminescent light emitted from a single cell is very faint. Therefore, an ultra-low-light imaging camera is needed to capture bioluminescent images microscopically [12–15]. We previously developed a microscope with an optimized optical system for BLI using a short focal-length imaging lens to capture brighter images [16].
In addition, the luminescent signal can be increased by using a brighter version of luciferase reporter. Enhanced green-emitting luciferase (ELuc; Emerald Luc) is a click beetle luciferase gene that produces >10-fold increased bioluminescence signal compared with firefly luciferase in mammalian cells [17]. Another advantage of ELuc is that it is less sensitive to changes in pH; therefore, it is ideal for use in long-term observations [17].
In the present study, we constructed a vector to monitor the expression of a specific gene in Drosophila melanogaster by using ELuc as a reporter and our bioluminescence microscope developed previously [16]. We focused on the armadillo (arm) gene, a segment polarity gene whose expression pattern in the early embryo has been analyzed using in situ hybridization previously [18]. However, little is known regarding its expression pattern in later stages of embryogenesis, which involves dynamic organogenesis. Therefore, we analyzed the spatiotemporal expression pattern of arm from the fertilized egg to hatching in the same single embryo, which takes ∼22 h, and overlaid the bright field images (BFI) to identify the locations of arm in the embryos.
We demonstrated that our method allows real-time tracking of arm expression throughout Drosophila embryogenesis continuously. Furthermore, we examined the effects of drugs, which have been well characterized in mammals [19, 20], to see how the compounds influence the arm expression in Drosophila embryos.
Materials and methods
Promoter vector
To generate a bioluminescent reporter vector in D. melanogaster, we modified the pGreenPelican + attB vector [21]. The GFP-containing EagI fragment of the vector was replaced with a PCR-amplified fragment containing the ELuc coding sequence preceded by the Drosophila Kozak sequence [22] (pElucPelican + attB, Fig. S1). ELuc (Emerald Luc; Toyobo, Osaka, Japan) was PCR amplified using the primers 5′-CGGCGGCCGCCAAAATGGAGAGAGAGAAGAACGT-3′ (forward) and 5′-CGGCGGCCGCTTACAGCTTAGAAGCCTTCT-3′ (reverse). A PCR product (1.8 kb) containing the complete arm promoter, including the E16 and E9 first exons [18], was inserted into BglII and EcoRI restriction sites in pElucPelican + attB, to generate a bioluminescent reporter driven by the arm promoter (arm::ELuc, Fig. S1). The arm promoter region was amplified from D. melanogaster (y w strain) genomic DNA using PCR and the primers: 5′-CCAGATCTTCCGCCGCCAGCTGCTGTGACC-3′ (forward) and 5′-CCGAATTCACCACACCTGCAAGAAAGAGACGG-3′ (reverse) [23].
Transgenic flies
Transgenic flies carrying the arm::ELuc construct were generated using a phi C31-based integration system [24, 25]. The arm:: ELuc construct DNA (400 μg/mL) was introduced into the y M {vas-int. Dm} ZH-2A w; M {3xP3-RFP.attP} ZH-86Fb strain by microinjection using Inject Man NI2 (Eppendorf, Hamburg, Germany). After hatching, luciferase-expressing larvae were selected individually by luminometric observation (Luminescensor; Atto, Tokyo, Japan) after feeding with 100 μM d-luciferin potassium salt (Promega, WI, USA), and the luminous adult males were crossed with virgin y w strain females. The red-eyed male progenies were crossed with virgin y w; wg Sp-1/SM1; Pr Dr/TM6C, Sb Tb strain females to stabilize the arm::ELuc insertion.
BLI
Fertilized eggs of the arm::ELuc transgenic strain were attached to 35-mm glass-bottom dishes using glue and a soft brush and were immersed in 3 mM d-luciferin potassium salt dissolved in Milli-Q (Millipore, Darmstadt, Germany) water for 5 min at 25 °C. In the drug treatment assays, 10 μM ionomycin [19] or 2 μM 6-bromoindirubin-3-oxime (BIO) [20] were added to the solution. After removing the d-luciferin solution with blotting paper, the eggs were immersed in silicon oil (FL-100-1000CS, Shinetsu, Tokyo, Japan) to avoid desiccation and to make the egg chorion transparent.
BLI was performed using a bioluminescence microscope (Luminoview LV200; Olympus, Tokyo, Japan) [16] equipped with a UPlanFl 60× oil objective lens, numerical aperture 1.25 (Olympus), and an electron multiplying charge-coupled device (EM-CCD) camera cooled at −68 °C (iXon; Andor technology, CA, USA). The binning of the EM-CCD was 1 × 1 (512 × 512 pixels), the EM gain was 255, and the exposure times for the bright field (BF) and bioluminescence (BL) images were 100 ms and 4.5 min, respectively, at 5-min intervals for 22 h. The luminescence intensity of the region of interest (ROI) in the embryo was measured using image acquisition and analysis software (Metamorph; Molecular Imaging, CA, USA). Based on microscopic observation of the external embryonic features at 25 °C, the developmental stage was assigned according to Campos-Ortega and Hartenstein’s table [26, 27].
Fluorescence imaging
To show the autofluorescence of the embryo (y w strain), fluorescence imaging was performed using the same system (LV200 microscope, objective lens, EM-CCD camera) used in BLI. In addition, 460–480-nm band-pass excitation and 495–540-nm band-pass emission filters were installed. The EM gain was zero (Normal CCD mode), and the exposure time was 1 s at 5-min intervals for 24 h.
Results and discussion
BLI of arm::ELuc expression during embryogenesis
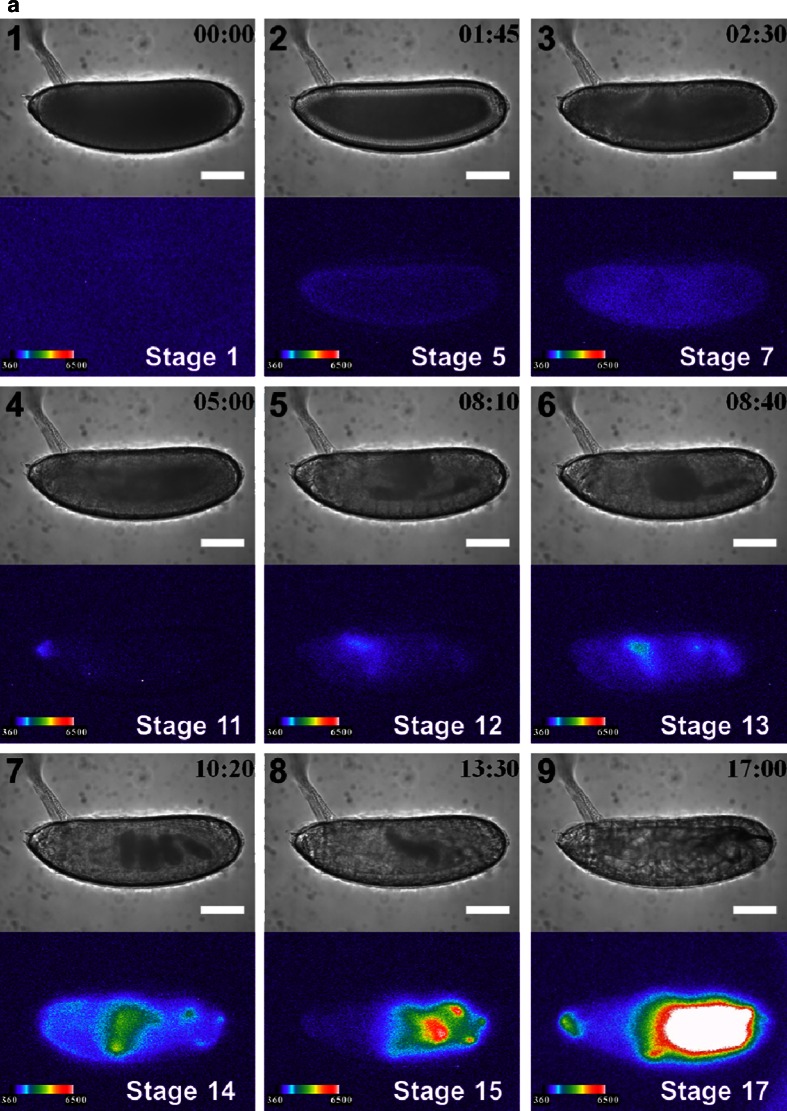
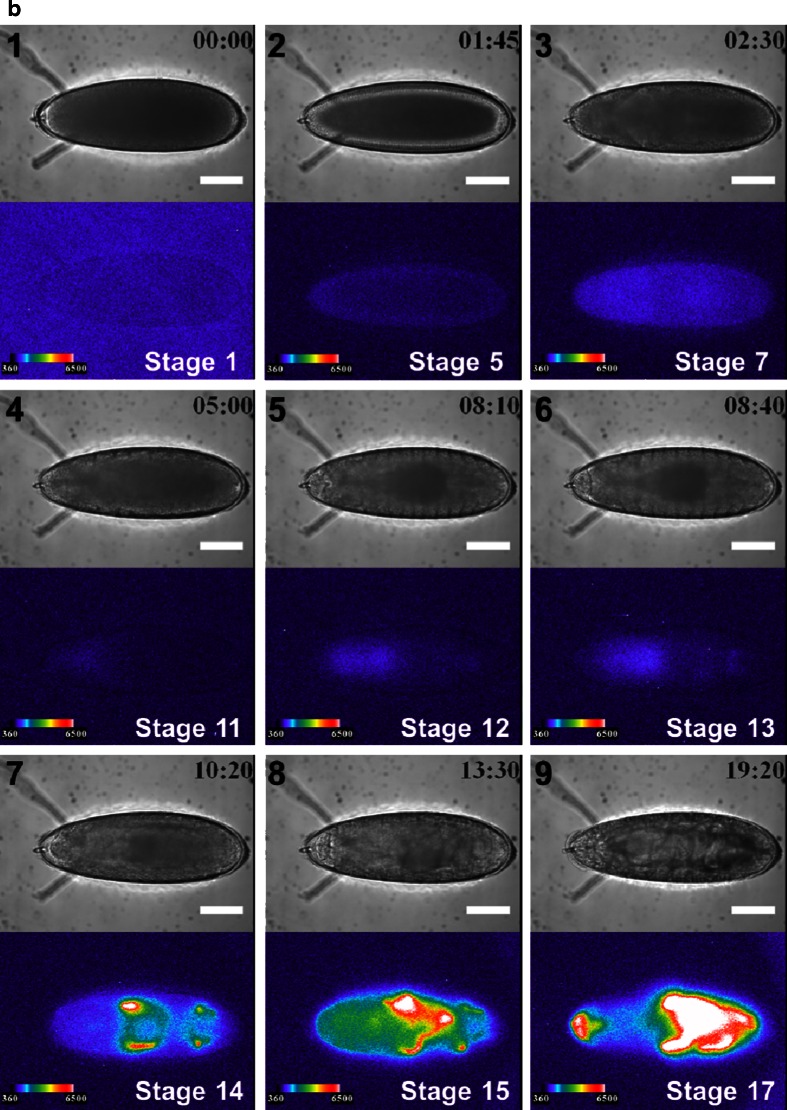
We performed BLI of arm::ELuc expression in whole Drosophila embryos, which have a high level of autofluorescence, hampering quantitative analysis with a fluorescence imaging. The arm gene encodes the Drosophila homologue of β-catenin, a key mediator of Wnt signaling pathway [28], and is also involved in cell–cell adhesion [29]. Thus it plays a critical role during embryogenesis in Drosophila. Although arm expression has been characterized during the early stages of embryogenesis using mRNA in situ hybridization [18], we attempted BLI of arm expression for the entire process of embryogenesis continuously. We constructed an ELuc-expressing reporter vector (pElucPelican + attB, Fig. S1), and cloned the promoter region of arm into the vector (arm::ELuc, Fig. S1). ELuc expression was analyzed as an indicator of arm transcriptional activity. Immediately after fertilization, no arm expression was observed (Fig. 1a (1), b (1)). Expression was first detected at stage 5 (1 h and 45 min after fertilization), with weak signals that were likely from the superficial cells of the cellular blastoderm (Fig. 1a (2), b (2)). arm expression then spread uniformly over the whole embryo during early gastrulation at stages 6 to 7 (from 2 h 10 min to 3 h 25 min) (Fig. 1a (3), b (3)), and then increased (Fig. 2a, b).
Fig. 1.
BFI of normal development (upper panel) and BL images of arm expression (lower panel) are shown at several stages with lateral (a) and dorsal (b) views, with the anterior end to the left. The bright intensity of BLI from 360 to 6,500 of a 16-bit output scale of the CCD camera was assigned rainbow pseudocolors from violet to white. 1, Stage 1 (0 h after fertilization), no arm expression; 2, stage 5 (1 h 45 min), expression at the cortical cytoplasmic region of the cellular blastoderm; 3, stage 6 (2 h 30 min), expression in all cell types of the early gastrula; 4, stage 11 (5 h), expression at 0 % EL; 5, stage 12 (8 h 10 min), expression in the dorsal side at 75–65 % EL; 6, stage 13 (8 h 40 min), expression in the dorsal side at 75–65, 35, and 20 % EL. 7, Stage 15 (10 h 20 min), the expression pattern changed dramatically with morphogenesis; 8, stage 16 (13 h 30 min), expression moved to 60–0 % EL; 9, stage 17 (17 h (lateral view), 19 h 20 min (dorsal view)), expression was maximal at 60–0 % EL, and further appeared in the cephalic region just before hatching. No bioluminescence signal was observed from promoterless control ELuc (pELucPelican + attB) construct-inserted embryos (data not shown). Scale bar = 100 μm
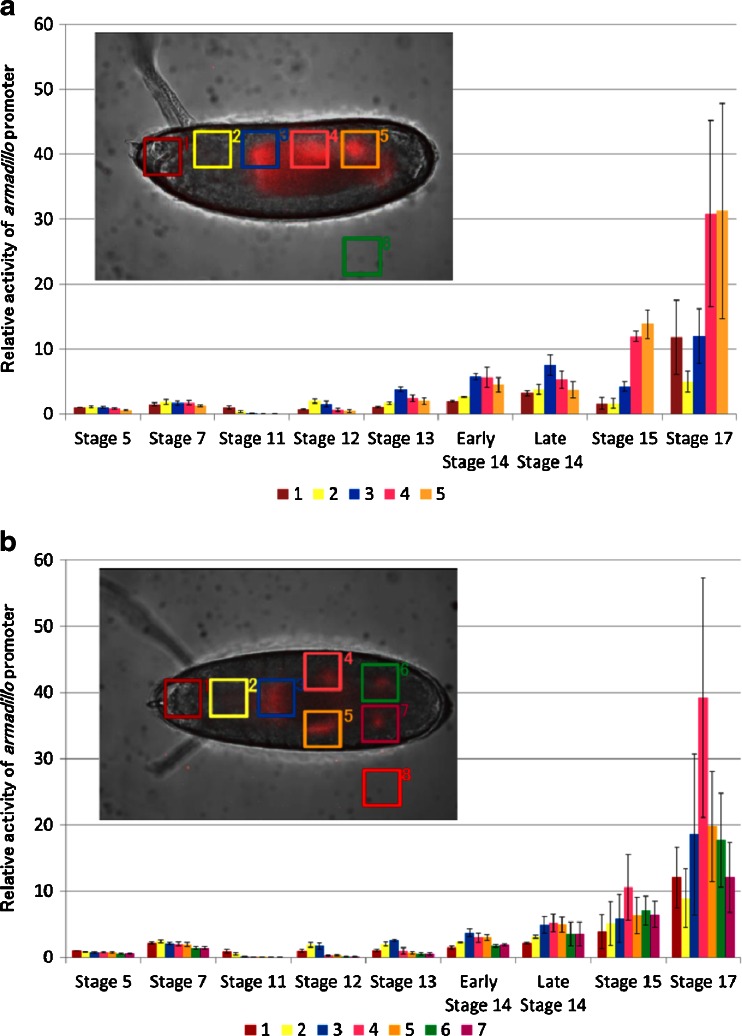
Fig. 2.
Time course analysis of arm expression at six regions of interest (ROI) at several stages with lateral (a) and dorsal (b) views, with the anterior end to the left. arm expression is shown as the luminescent signal ratio of each ROIs per ROI 1 in stage 5 of (a) or (b) after subtraction of the background obtained from ROI-6 (a) or ROI-8 (b). Data are presented as mean ± SE (n = 3). ROIs were assigned at presumptive areas of the cephalic region (1), the proventriculus (2), the anterior midgut rudiment region (3), myoblasts of the dorsal/lateral musculature region (a (4), b (4 and 5)), the posterior spiracle region (a (5), b), and the background area (a (6), b (8))
Figure 2 shows the temporal expression profile of arm from the lateral and dorsal sides. The ROIs assigned in the embryo were presumptive areas of the cephalic region (Fig. 2a (1), b (1)), the proventriculus (Fig. 2a (2), b (2)), the anterior midgut rudiment region (Fig. 2a (3), b (3)), myoblasts of the dorsal/lateral musculature region (Fig. 2a (4), b (4 and 5)), the posterior spiracle region (Fig. 2a (5), b (6 and 7)), and background area (Fig. 2a (6), b (8)). The arm expression disappeared between stages 8 and 10 (3.5–4 h). To exclude the possibility that these expression patterns were produced by nearby enhancers, we generated control transgenic embryos that harbored promoterless ELuc (pELucPelican + attB) at the same genomic insertion site. However, no bioluminescence signal was detected in these embryos (data not shown). Therefore, it is likely that the observed expression patterns represent arm transcriptional activity.
A previous study showed that arm mRNA was expressed abundantly at the preblastoderm stage [18]; however, there was no detectable ELuc signal in the current study (Fig. 1a (1), b (1)). This suggests that arm mRNA might not be translated at this stage. However, the subsequent spatiotemporal distribution patterns of ELuc signal were mostly consistent with the arm mRNA expression pattern reported previously [18], suggesting that the ELuc expression pattern observed in the current study consistently reflected endogenous arm expression.
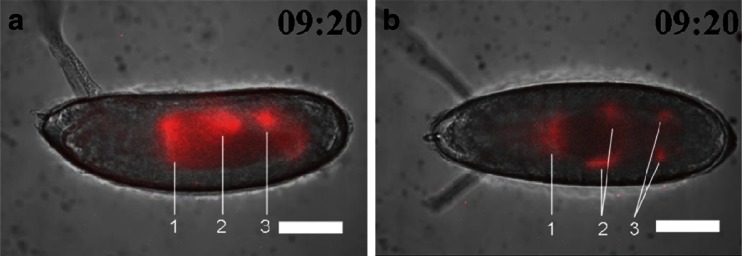
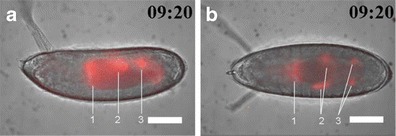
At stage 11 (4 h 5 min to 5 h 25 min), arm expression reappeared at the dorsal region of 100–70 % EL (percent egg length) during the formation of the parasegmental furrow (Fig. 1a (4), b (4)). At stage 12 (5 h 30 min–8 h 10 min), the expression area moved to the dorsal region of 75–65 % EL during germ band shortening and segment formation (Fig. 1a (5), b (5)), and additional expression appeared in two regions at 35 and 20 % EL (stage 13, 8 h 40 min) (Fig. 1a (6), b (6)). These transition processes were confirmed as luminescence intensity in the ROIs from stages 11 to 13 (Fig. 2a, b). Based on the merged BFI and BL images from the lateral and dorsal side at stage 13, the arm-positive regions were considered to be in the anterior midgut rudiment, myoblasts of the dorsal/lateral musculature, and the posterior spiracle (Fig. 3). After this stage, the anterior and posterior midgut rudiments elongated longitudinally and fused to become the midgut primordium. The lateral musculature forms muscle fibers to hold the internal organs, and the posterior spiracle forms a tubular structure that connects the tracheal system to the outside of the embryo [26]. Arm protein forms part of the complex that regulates cell growth and cell–cell adhesion [29]. Therefore, the expression pattern changed drastically as morphogenesis proceeded (Figs. 1a (7 to 9), b (7 to 9) and 2a, b; Electronic supplementary material Movie S1). During this period, arm expression increased in the 60–0 % EL region (from stage 15, 13 h 30 min to stage 16, 16 h 55 min) (Fig. 1a (8), b (8)). Furthermore, arm expression increased dramatically at the cephalic region just before hatching at stage 17 (17 h to 19 h 20 min) (Figs. 1a (9), b (9) and 2a, b), suggesting that arm might facilitate the hatching process.
Fig. 3.
Merged BFI and BL images of arm transcriptional activity at stage 14 (9 h 20 min after fertilization) from the lateral (a) and dorsal (b) side. Increased arm expression was observed in the anterior midgut rudiment (1), myoblasts of the dorsal/lateral musculature (2), and the posterior spiracle (3). Scale bar = 100 μm
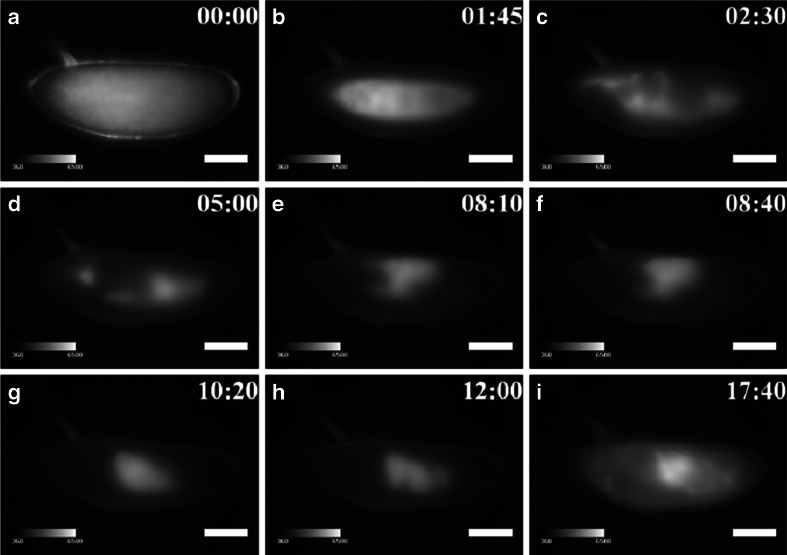
Figure 4 shows fluorescent images of embryos excited by blue light (460–480 nm) at several stages from the fertilized egg to hatching using a green-to-yellow (495–540 nm) band-pass filter. Strong autofluorescence was observed throughout embryogenesis, particularly in the yolk and gut system, which would cause problems during the fluorescence imaging of Drosophila embryos.
Fig. 4.
Autofluorescence image of Drosophila embryo. Autofluorescence imaging (495–540-nm band-pass) of Drosophila embryo excited by blue light (460–480-nm band-pass) shown at several stages with a lateral view and the anterior end to the left. Scale bar = 100 μm
Effects of ionomycin on arm::Eluc expression
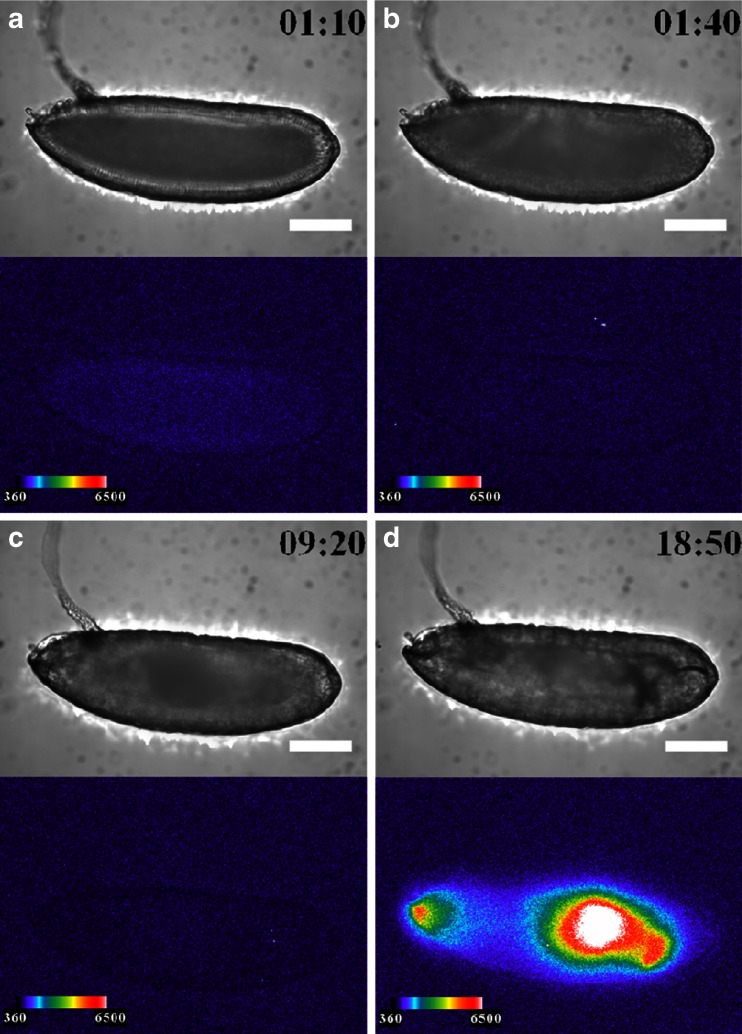
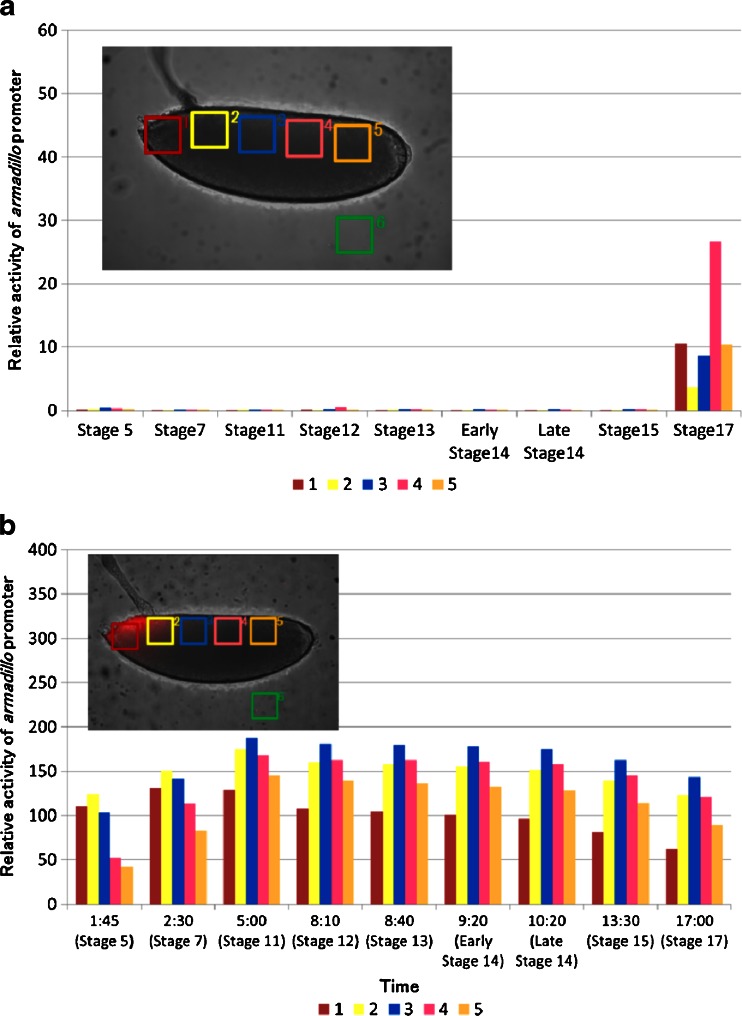
As an application of our BLI technique, we performed pharmacological manipulations of the Wnt signaling pathway, and observed arm::Eluc expression during embryogenesis. The pathway regulates the stability and the intracellular localization of Arm protein [28]; however, little is known about the relationship between the Wnt signaling pathway and transcriptional regulation of the arm gene. Therefore, we examined whether arm expression is altered when embryos were treated with ionomycin, which is known to inhibit β-catenin/transcription factor (TCF) complex formation [19]. Compared with normal development, arm::Eluc expression levels were low in the cellular blastoderm embryos treated with ionomycin (stage 5, 1 h 10 min, Figs. 5a and 7a). The expression almost disappeared at stage 6 (1 h 40 min, Figs. 5b and 7a) and remained at low levels until stage 15 (13 h 30 min, Fig. 7a), except for a limited increase in ROI-4 at stage 12. These results suggest that the inhibition of Arm/TCF function caused the transcriptional downregulation of arm. During this period, intestinal formation could be observed clearly using BFI during normal development but not in embryos treated with ionomycin (Fig. 5c; Electronic supplementary material Movie S2). Expression of arm::Eluc reappeared at 60 % EL after stage 15, and then increased and spread to the 60–0 % EL region gradually, similar to the pattern observed during normal development (Figs. 5d and 7a (stage 17)). Throughout embryogenesis, arm expression was lower in the embryos treated with ionomycin compared with untreated embryos (Fig. 7a). The results suggested that the effects of ionomycin on arm expression could be visualized by BLI.
Fig. 5.
BFI of an embryo treated with ionomycin (upper panel) and BL images of arm expression (lower panel) are shown at several stages with the dorsal side to the top and the anterior end to the left. Bright BLI intensity from 360 to 6,500 of a 16-bit output scale of the CCD camera was assigned rainbow pseudocolors from violet to white. a Stage 5 (1 h 10 min after fertilization), arm expression at the cortical cytoplasmic region of the cellular blastoderm; b stage 6 (1 h 40 min), no expression; c stage 14 (9 h 20 min), no expression; d stage 17 (18 h 50 min), expression was maximal at 60–0 % EL and further appeared at the cephalic region just before hatching. However, embryonic development was not observed clearly by BFI. Scale bar = 100 μm
Fig. 7.
Time course analysis of arm promoter activity in six regions of interest (ROI) after treatment with ionomycin (a) and BIO (b). arm expression is presented as the luminescent signal intensity of ROIs relative to ROI-1 in stage 5 of untreated embryos after subtracting the background obtained from ROI-6. ROIs were defined at presumptive areas of the cephalic region (1), the proventriculus (2), the anterior midgut rudiment region (3), myoblasts of the dorsal/lateral musculature region (4), the posterior spiracle region (5), and the background area (6). Because there was no obvious progression in the developmental stages of BIO-treated embryo (b), relative intensity of luminescent signal was calculated at the indicated time after egg laying. The embryonic stages in normal development corresponding to each time were shown in parentheses
Effects of 6-bromoindirubin-3-oxime on arm::Eluc expression
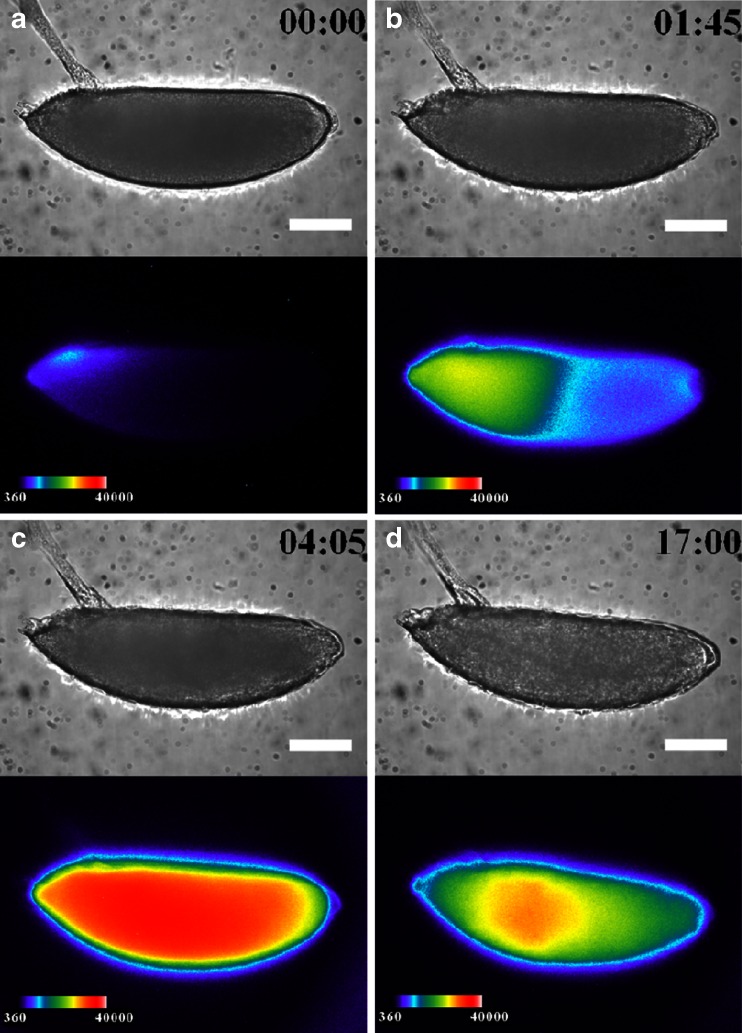
Inhibiting Arm/TCF function using ionomycin seemed to suppress arm transcriptional activity. Therefore, we examined the effect of BIO, a glycogen synthase kinase (GSK)-3β inhibitor [20] on arm::ELuc expression. Because GSK-3β suppresses the nuclear localization of Arm, its inhibition is expected to promote Arm/TCF function. Unlike normal embryogenesis, arm::ELuc expression was detected at dorsal area at 90 % EL immediately after fertilization (Fig. 6a), and then increased and spread over the whole embryo from the anterior to the posterior region (Fig. 6b, c). We quantified the arm:Eluc expression level as relative luminescence intensity in the ROIs from 1:45 to 5:00 (Fig. 7b). During this period, no embryonic development was observed using BFI (Electronic supplementary material Movie S3). Finally, the expression gradually decreased from 5:00 to 17:00 (Fig. 7b) and the embryo failed to hatch (Fig. 6d), suggesting that inhibiting GSK-3β impaired embryonic development. Throughout embryogenesis, arm::ELuc expression level appeared to be increased after BIO treatment (Fig. 7b). These results suggest that arm transcription in early embryogenesis might be regulated by the activity of Wnt signaling pathway. However, because these results were described using a single promoter reporter (arm) without normalization to an unrelated promoter reporter, the specificity of the effects of these treatments on arm expression needs to be confirmed in a future study. Nevertheless, it appears that our BLI system using the ELuc reporter is sufficiently sensitive to detect the effects of drugs on arm expression during Drosophila embryogenesis.
Fig. 6.
BFI of an embryo treated with 6-bromoindirubin-3-oxime (upper panel) and BL images of arm expression (lower panel) are shown at several stages with the dorsal side to the top of the page and the anterior end to the left. Bright BLI intensity from 360 to 40,000 of a 16-bit output scale of the CCD camera was assigned rainbow pseudocolors from violet to white. a Stage 1 (0 h after fertilization), arm expression in the dorsal side at 90 % EL; b 1 h 45 min and c 4 h 5 min: expression increased and spread over the whole embryo from the anterior to the posterior region; d 17 h, expression decreased. Embryonic development was not observed, and the embryo could not hatch. Scale bar = 100 μm
Conclusions
In the present study, we performed BLI of arm gene expression throughout Drosophila embryogenesis in the same live embryo, and described the detailed arm expression pattern in later embryogenesis for the first time. We also demonstrated the superiority of BLI for Drosophila embryogenesis compared with fluorescence imaging, which has challenges that are associated with high levels of an autofluorescent background. In addition, we revealed the arm::ELuc expression pattern in embryos treated with ionomycin or BIO, an inhibitor and an activator of Wnt/β-catenin signaling, respectively. In summary, we established a BLI method using ELuc reporter in Drosophila, which could increase the utility of this model organism to study gene expression and regulation in vivo.
Electronic supplementary material
Below is the link to the electronic supplementary material.
(PDF 117 kb)
(MPG 29.1 MB)
(MPG 9.41 MB)
(MPG 9.90 MB)
Acknowledgments
The authors thank Y. Hatta-Ohashi, T. Takahashi, and S. Karaki (Olympus) for their supervision and continuous encouragement during this study, and S. Tomioka (Tokyo Metropolitan University) and T. Matsuo (University of Tokyo) for providing the pGreenPelican + attB expression vector.
Footnotes
Published in the topical collection Analytical Bioluminescence and Chemiluminescence with guest editors Elisa Michelini and Mara Mirasoli.
References
- 1.Mandal L, Martinez-Agosto JA, Evans CJ, Hartenstein V, Banerjee U. A Hedgehog- and Antennapedia-dependent niche maintains Drosophila haematopoietic precursors. Nature. 2007;446:320–324. doi: 10.1038/nature05585. [DOI] [PMC free article] [PubMed] [Google Scholar]
- 2.Johnson AA, Sarthi J, Pirooznia SK, Reube W, Elefant F. Increasing Tip60 HAT levels rescues axonal transport defects and associated behavioral phenotypes in a Drosophila Alzheimer’s disease model. J Neurosci. 2013;33:7535–7547. doi: 10.1523/JNEUROSCI.3739-12.2013. [DOI] [PMC free article] [PubMed] [Google Scholar]
- 3.Michael IP, Monetti C, Chiu AC, Zhang P, Baba T, Nishino K, Agha-Mohammadi S, Woltjen K, Sung HK, Nagy A. Highly efficient site-specific transgenesis in cancer cell lines. Mol Cancer. 2012;11:89. doi: 10.1186/1476-4598-11-89. [DOI] [PMC free article] [PubMed] [Google Scholar]
- 4.Soboleski MR, Oaks J, Halford WP. Green fluorescent protein is a quantitative reporter of gene expression in individual eukaryotic cells. FASEB J. 2005;19:440–442. doi: 10.1096/fj.04-3180fje. [DOI] [PMC free article] [PubMed] [Google Scholar]
- 5.Rizzo MA, Davidson MW, Piston DW. Fluorescent protein tracking and detection. In: Goldman RD, Swedlow JR, Spector DL, editors. Live cell imaging: a laboratory manual. 2. New York: Cold Spring Harbor laboratory Press; 2010. pp. 3–34. [Google Scholar]
- 6.Choy G, O’Connor S, Diehn FE, Costouros N, Alexander HR, Choyke P. Comparison of noninvasive fluorescent and bioluminescent small animal optical imaging. Biotechniques. 2010;35:1022–1026. doi: 10.2144/03355rr02. [DOI] [PubMed] [Google Scholar]
- 7.Dixit R, Cyr R. Cell damage and reactive oxygen species production induced by fluorescence microscopy: effect on mitosis and guidelines for non-invasive fluorescence microscopy. Plant J. 2003;36:280–290. doi: 10.1046/j.1365-313X.2003.01868.x. [DOI] [PubMed] [Google Scholar]
- 8.Schneckenburger H, Weber P, Wagner M, Schickinger S, Richter V, Bruns T, Strauss WSL, Wittig R. Light exposure and cell viability in fluorescence microscopy. J Microscopy. 2012;245:311–318. doi: 10.1111/j.1365-2818.2011.03576.x. [DOI] [PubMed] [Google Scholar]
- 9.Hooper CE, Ansorge RE, Browne HM, Tomkins P. CCD imaging of luciferase gene expression in single mammalian cells. J Biolumi Chemilumi. 1990;5:123–130. doi: 10.1002/bio.1170050208. [DOI] [PubMed] [Google Scholar]
- 10.Greer LF, III, Szalay AA. Imaging of light emission from the expression of luciferases in living cells and organisms: a review. Luminescence. 2002;17:43–74. doi: 10.1002/bio.676. [DOI] [PubMed] [Google Scholar]
- 11.Welsh DK, Kay SA. Bioluminescence imaging in living organisms. Curr Opin Biotech. 2005;16:1–6. doi: 10.1016/j.copbio.2004.12.006. [DOI] [PubMed] [Google Scholar]
- 12.Frawley LS, Faught WJ, Nicholson J, Moomaw B. Real time measurement of gene expression in living endocrine cells. Endocrinology. 1994;135:468–471. doi: 10.1210/endo.135.1.8013386. [DOI] [PubMed] [Google Scholar]
- 13.Maire E, Lelievre E, Brau D, Lyons A, Woodward M, Fafeur V, Vandenbunder B. Development of an ultralow-light-level luminescence image analysis system for dynamic measurements of transcriptional activity in living and migrating cells. Anal Biochem. 2000;280:118–127. doi: 10.1006/abio.2000.4503. [DOI] [PubMed] [Google Scholar]
- 14.Kwon HJ, Enomoto T, Shimogawara M, Yasuda K, Nakajima Y, Ohmiya Y. Bioluminescence imaging of dual gene expression at the single-cell level. BioTechniques. 2010;48:460–462. doi: 10.2144/000113419. [DOI] [PubMed] [Google Scholar]
- 15.Suzuki T, Kondo C, Kanamori T, Inouye S. Video rate bioluminescence imaging of secretory proteins in living cells: localization, secretory frequency, and quantification. Anal Biochem. 2011;415:182–189. doi: 10.1016/j.ab.2011.03.039. [DOI] [PubMed] [Google Scholar]
- 16.Ogoh K, Akiyoshi R, May-Maw-Thet ST, Dosaka S, Hatta-Ohashi Y, Suzuki H. Bioluminescence microscopy using a short focal-length imaging lens. J Microsc. 2014;253:191–197. doi: 10.1111/jmi.12109. [DOI] [PMC free article] [PubMed] [Google Scholar]
- 17.Nakajima Y, Yamazaki T, Nishii S, Noguchi T, Hoshino H, Niwa K, Viviani VR, Ohmiya Y. Enhanced beetle luciferase for high-resolution bioluminescence imaging. PLoS One. 2010;5:e10011. doi: 10.1371/journal.pone.0010011. [DOI] [PMC free article] [PubMed] [Google Scholar]
- 18.Riggleman B, Wieschaus E, Schedl P. Molecular analysis of the armadillo locus: uniformly distributed transcripts and a protein with novel internal repeats are associated with a Drosophila segment polarity gene. Genes Dev. 1989;3:96–113. doi: 10.1101/gad.3.1.96. [DOI] [PubMed] [Google Scholar]
- 19.Park CH, Hahm ER, Lee JH, Jung KC, Rhee HS, Yang CH. Ionomycin downregulates β-catenin/Tcf signaling in colon cancer cell line. Carcinogenesis. 2005;26:1929–1933. doi: 10.1093/carcin/bgi145. [DOI] [PubMed] [Google Scholar]
- 20.Kehn-Hall K, Guendel I, Carpio L, Skaltsounis L, Meijer L, Al-Harthi L, Steiner JP, Nath A, Kutsch O, Kashanchi F. Inhibition of Tat-mediated HIV-1 replication and neurotoxicity by novel GSK-3β inhibitors. Virology. 2011;20:56–68. doi: 10.1016/j.virol.2011.03.025. [DOI] [PMC free article] [PubMed] [Google Scholar]
- 21.Tomioka S, Aigaki T, Matsuo T. Conserved cis-regulatory elements of two odorant-binding protein genes, Obp57d and Obp57e, in Drosophila. Genes Genet Syst. 2012;87:323–329. doi: 10.1266/ggs.87.323. [DOI] [PubMed] [Google Scholar]
- 22.Cavener DR. Comparison of the consensus sequence flanking translational start sites in Drosophila and vertebrates. Nucleic Acids Res. 1987;15:1353–1361. doi: 10.1093/nar/15.4.1353. [DOI] [PMC free article] [PubMed] [Google Scholar]
- 23.Vincent JP, Girdham C. In: Promoters to express cloned genes uniformly in Drosophila, Methods of Molecular Biology 62:385–392. Tuan R, editor. Human Press: Totowa; 1997. [DOI] [PubMed] [Google Scholar]
- 24.Bateman JR, Lee AM, Wu CT. Site-specific transformation of Drosophila via phiC31 integrase-mediated cassette exchange. Genetics. 2006;173:769–777. doi: 10.1534/genetics.106.056945. [DOI] [PMC free article] [PubMed] [Google Scholar]
- 25.Bischof J, Maeda RK, Hediger M, Karch F, Basler K. An optimized transgenesis system for Drosophila using germ-line-specific phiC31 integrases. Proc Natl Acad Sci USA. 2007;27:3312–3317. doi: 10.1073/pnas.0611511104. [DOI] [PMC free article] [PubMed] [Google Scholar]
- 26.Campos-Ortega JA, Hartenstein V. The embryonic development of Drosophila melanogaster. Berlin: Springer; 1985. [Google Scholar]
- 27.Hartenstein V. Atlas of Drosophila development. New York: Cold Spring Harbor Laboratory Press; 1993. [Google Scholar]
- 28.Peifer M, Rauskolb C, Williams M, Riggleman B, Wieschaus E. The segment polarity gene armadillo interacts with the wingless signaling pathway in both embryonic and adult pattern formation. Development. 1991;111:1029–1043. doi: 10.1242/dev.111.4.1029. [DOI] [PubMed] [Google Scholar]
- 29.Peifer M, Orsulic S, Sweeton D, Wieschaus E. A role for the Drosophila segment polarity gene armadillo in cell adhesion and cytoskeletal integrity during oogenesis. Development. 1993;118:1191–11207. doi: 10.1242/dev.118.4.1191. [DOI] [PubMed] [Google Scholar]
Associated Data
This section collects any data citations, data availability statements, or supplementary materials included in this article.
Supplementary Materials
(PDF 117 kb)
(MPG 29.1 MB)
(MPG 9.41 MB)
(MPG 9.90 MB)


