

Abstract
Background
Atopic sensitization or atopy is the most commonly reported risk factor for asthma. Recent studies have begun to suggest that atopy, as conventionally defined, may be an umbrella term that obfuscates more specific allergic disease types.
Objective
To determine if distinct and meaningful atopic phenotypes exist within a racially diverse birth cohort using ten allergen-specific IgE (sIgE) measurements from children of age 2 years.
Methods
Using the WHEALS birth cohort (62% Black), we analyzed sIgE data from ten allergens (Der f, dog, cat, Timothy grass, ragweed, Alternaria alternata, egg, peanut, milk, and German cockroach) among 594 children measured at age 2 years. Conventional atopy was defined as at least one sIgE ≥ 0.35 IU/ml.
Results
A four-class solution (latent class model) was the best fit. Class types were labeled “Low to no sensitization (76.9% of sample)”, “Highly sensitized (2.7%)”, “Milk and egg dominated (15.3%)” and “Peanut and inhalant(s) (5.1%)”. Almost one-third (32.2%) of the “low to no sensitization” group met the criteria for conventional atopy. The “Highly sensitized” group was significantly associated with doctor diagnosis of asthma after age 4 years, odds ratio [OR]=5.3, 95% Cl, 1.6–17.4) while the “Milk and egg dominated” and “Peanut and inhalant(s)” groups were not, OR=1.6 (0.8–3.0) and OR=1.8 (0.6–4.9), respectively. Children of Black race were more likely to be in the three multi-sensitized groups, p=0.04.
Conclusion
Classification by sIgE patterns defined groups whose membership is more strongly associated, as compared to conventional atopy, with atopic dermatitis, wheeze, and asthma.
Keywords: Atopy, phenotype, latent class analysis, birth cohort
Introduction
Atopic sensitization or atopy, commonly defined as having at least one positive allergen-specific serum IgE (sIgE) test, is often reported as a risk factor for asthma(1). However the definition of atopy has been inconsistent, with studies often differing on the number and/or type (e.g. inhalant, food, animal) of allergens used for testing. Although this variability is often present due to understandable reasons such as financial constraints and/or regional variations in allergen prevalence, this imprecision can corrupt potential associations between atopy and allergic disease outcomes. Further, several recent publications hypothesize that atopy, as typically defined, may lack specificity and that nuances in the pattern and/or measurement timing of specific allergen sensitization may also be important in allergic disease development(1–4). Custovic et al. state that atopy encompasses a number of different endotypes (‘distinct disease entities’), which differ in their association with asthma(2). Simpson et al. demonstrated that atopy in their birth cohort of children represented separate phenotypes with a marked variation in their associations with disease(1).
The approach of using atopic phenotypes in analyses, if consistently applied and proven insightful, represents a paradigm shift in allergic disease research. We sought to explore whether distinct and meaningful atopic phenotypes exist within our racially diverse, general risk, birth cohort using the results of ten allergen-specific IgE measurements at age 2 years. Using an unsupervised statistical tool that ignores outcomes and only considers individual sensitization patterns to suggest groupings (latent class mixture models), we identified patterns of “classes” of allergen sensitization based on sIgE measurements at age 2 years. We then examined whether numerous risk factors varied across the classes. Finally, rates of allergic diseases (atopic dermatitis, wheeze, doctor diagnosis of asthma) were compared between these classes to determine if any class carried a different risk for any of these clinical outcomes.
Methods
Study population
The Wayne County Health, Environment, Allergy and Asthma Longitudinal Study (WHEALS) is a birth cohort from southeastern Michigan that has previously been described (5, 6). Briefly, women were eligible for inclusion in the study if they were in their second or third trimester of pregnancy, were between 21 and 49 years of age, and lived in a predefined cluster of zip codes in Detroit and its surrounding suburbs. Recruitment was completed between August 2003 and November 2007. There have been five follow-up contacts to date at 1, 6, 12, 24 and 48-months after the child’s birth. This research was approved by the Henry Ford Hospital Institutional Review Board.
Total and specific IgE
Blood was collected at the 2 year clinic visit to determine levels of total and sIgE to 10 allergens: Der f, dog, cat, Timothy grass, ragweed, Alternaria alternata, egg, peanut, milk, and German cockroach. Total and sIgE were measured using the Pharmacia UniCAP system (ThermoFisher Scientific, Michigan, USA). Conventional atopic sensitization, or atopy, was defined as at least 1 positive test (sIgE≥0.35 IU/mL) to any of the 10 allergens.
Asthma
During the interview at age 4 years, parents were asked to report whether the child had ever received a doctor’s diagnosis of asthma.
Atopic dermatitis
At a physical exam of the child at the two year clinic visit, physicians recorded whether they concluded the child currently had atopic dermatitis (AD), had a history of AD without presently having it, or had no history of AD.
Wheeze
Parents reported if their child had at least 1 episode of “wheezing or whistling in the chest” in the past 12 months during the age 2 years interview.
Parental allergic history
Parental allergic history was defined as positive if there was a report of ever having a doctor diagnosis of hay fever or allergic rhinitis. For 19% (234/1258) of the families, father’s self-report of history was used, otherwise mother’s report of the father’s history was substituted. Parental history of asthma was defined similarly.
Maternal Atopy
Maternal blood was collected during pregnancy or at 1 month after delivery. Atopy was defined as having at least one sIgE≥0.35 IU/mL for any of the following eight allergens: Der f, dog, cat, Timothy grass, ragweed, Alternaria alternata, egg and German cockroach. We have previously shown that there is little change in sensitization during pregnancy compared to one month post-partum(7).
Obstetrical History
During the prenatal interview, women were asked to report the timing, duration and outcome of all prior pregnancies. The child’s delivery type (vaginal or caesarean-section) was collected from the mother’s medical record.
Endotoxin and Allergen Levels in Dust Samples
Dust samples were collected from the children’s bedroom floors at the one-month home visit. Samples were analyzed for cat allergen (Fel d 1), dog allergen (Can f 1), dust mite allergen (Der f), cockroach allergen (Bla g 2) and endotoxin using methods we have previously published(8).
Statistical analysis
Latent class analysis (LCA) is an unsupervised statistical method that simultaneously considers a number of variables to identify homogeneous, mutually exclusive groups (or “classes”) that exist within a heterogeneous population. The latent class groupings are not known in advance but are inferred from the data(9). LCA was used to determine if children could be grouped together based on their specific pattern of sensitization to the 10 allergens measured. The conventional definition of atopy (having at least one of any sIgE≥0.35 IU/mL) classifies children into two groups, atopic (sensitized) and non-atopic (all measured sIgEs<0.35 IU/mL). This approach typically does not take into consideration the types of allergen to which they are sensitized (e.g., food versus aeroallergen) or, for children with more than one positive sensitization, the particular combination of allergens to which they are sensitized.
Using Mplus version 7.2(10), the latent class model was fit using full-information maximum likelihood (FIML) under the missing at random assumption. By employing FIML, subjects with partially missing data were not excluded from the analysis. Due to insufficient blood quantity, the percent of missing measurements for each of the 10 sIgEs ranged from 0.8%(n=5) to 4.4% (n=26). The appropriate number of classes was determined using an iterative process where the model was fit with an increasing number of classes and the model with the best representation of the data was selected. We used the likelihood ratio test to determine the number of classes along with the Bayesian Information Criteria (BIC) to determine the best fit (see Table E1 in this article’s Online Repository at www.jacionline.org). (11).
Using the final LCA model, the posterior probability of latent class membership for each individual was derived, and each individual was assigned to the class for which they had the maximum posterior probability. The assignment process ensures that subjects within a class are more homogeneous than are those between classes. The average posterior probability (also called entropy) for our final model was high at 0.92 (1 represents perfect classification and 0 represents perfect misclassification). Given the high entropy of the final model, we used the straight-forward “classify-analyze” approach (12) as the primary analyses. Where possible, we repeated the analyses incorporating the posterior probability via weighting and results were, as expected, very consistent.
Odds ratios and 95% confidence intervals were calculated using multinomial logistic regression. Multinomial logistic regression models were used to assess the relationship between risk factors and phenotype (class).
Results
Cohort characteristics
Of the 1258 women originally enrolled in the WHEALS study, 594 (47%) children had blood drawn and at least 1 specific IgE value measured at a two year clinic visit (average age 2.3 years). The 594 included in this analysis are comparable to the 664 excluded children (see Table 1) in terms of mother’s age at birth (mean = 29.8 (standard deviation (sd) = 5.2) versus mean=29.4 (sd=5.3), respectively; p=0.14) and racial distribution (60.6% versus 63.7% Black, p=0.26). Family size at birth and maternal allergic history were also similar. However the included children were slightly more likely to have a mother with more than a high-school education (79.6% versus 72.7%, p=0.004).
Table 1.
Participant characteristics by Inclusion in analysis (N=1258)
| Included N=594 |
Excluded N=664 |
p-value | |
|---|---|---|---|
| Maternal age at birth, mean (standard deviation (s.d.)) | 29.8 (5.2) | 29.4 (5.3) | 0.14 |
| Black race, n (%) | 360 (60.6%) | 423 (63.7%) | 0.26 |
| Maternal allergic history1, n (%) | 178 (30.5%) | 207 (31.6%) | 0.67 |
| High school education or less, n (%) | 121 (20.4%) | 181 (27.3%) | 0.004 |
| Children (< age 18 years) in household at birth, mean (s.d.) | 1.0 (1.2) | 1.1 (1.3) | |
| Family Size at birth, mean (s.d.) 2 | 3.8 (1.3) | 3.9 (1.4) | 0.17 |
19 with missing information;
Count includes newborn, mother, spouse or significant other and sibling(s)
Latent Classes Characterized
Using our latent class model, we characterized the following classes: 1) Low to no Sensitization; 2) Highly Sensitized; 3) Milk and egg Dominated Sensitization; and 4) Peanut and/or Inhalant Allergen – No Milk Sensitization. Figure 1 gives the rate of sensitization to each of the 10 allergens among the four latent classes. Descriptions of each class follow.
Figure 1.
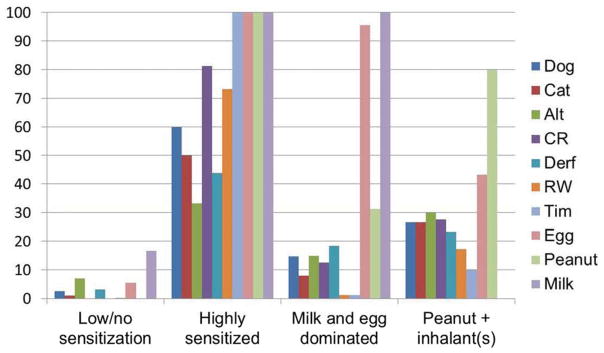
Prevalence of sensitization (allergen sIgE ≥ 0.35) to individually tested allergens within each latent class
Class 1 (N=457) – Low to no sensitization
The majority (67.8%; n=310) assigned to this class had no sensitization (no sIgE≥0.35 IU/mL) which is the traditional criterion used to define someone as non-atopic or non-sensitized. Of the remaining 147 in this class, nearly all (91%; n=134) were mono-sensitized (only one sIgE≥0.35 IU/mL) to the following: 17.2% (n=23) egg; 16.4% (n=22) Alternaria; 7.5% (n=10) Der f; 4.5% (n=6) dog; 1.5% (n=2) cat; 0.8% (n=1) Timothy grass. This class is used as the reference group for odds ratios calculations involving the latent class groupings.
Class 2 (N=16) – Highly sensitized
All sixteen children in this group were sensitized to at least four of the same allergens: milk, egg, peanut and Timothy grass. The median number of allergens to which a child in this class is sensitized was seven and 18.7% (n=3) were sensitized to all 10 allergens. The rate of sensitization was lowest for Alternaria (31.2%; n=5) and Der f (43.7%; n=7); all other allergens had a rate greater than 50%.
Class 3 (N=91) – Milk and egg dominated
Nearly all (94.5%; n=86) of the 91 children in this group were sensitized to both milk and egg and a quarter of those (27.9%; n=24) were sensitized to, at minimum, all three food allergens tested. Sensitization to two (n=39) or three (n=30) allergens comprise 75.8% of this group, with n=36 of the 39 with two sensitizations being milk plus egg. The milk and egg combination also dominated the remaining group with three or more total allergen sensitizations (n=50, all but two had milk and egg). Peanut was the most common co-allergen at 48.0% (n=24). The remaining 26 children who were sensitized to milk plus egg (no peanut) plus at least one inhalant allergen (no one inhalant dominated).
Class 4 (N=30) – Peanut and inhalant(s)/no milk
Peanut was the most common single allergen identified in this class (80%; n=24), with the remaining 20% (n=6) sensitized to two or more aero-allergens. A total of 24 (80%) were sensitized to at least one aero-allergen. Egg sensitization occurred 43.3% (n=13) of the time and always in co-occurrence with peanut. There were no milk sensitized children in this class. The majority were sensitized to a total of two (n=12) or three (n=8) allergens. There was no dominant aero-allergen sensitization (n=9 to Alternaria, n=8 to each of dog, cat and cockroach, n=7 to Der f, n=5 to ragweed and n=3 to Timothy grass).
Latent class membership and AD, wheeze and doctor diagnosis of asthma
Being atopic, as defined by the traditional definition, was associated with having AD (odds ratio=OR=1.8, 95% confidence interval (95% CI) 1.1–2.8) (Table 2). Table 2 shows that the odds of the clinical outcomes of AD and doctor diagnosis of asthma (age 4 years interview) are the highest when comparing Class 2 (Highly sensitized), Class 3 (Milk and Egg) and Class 4 (Peanut and inhalant(s)/no milk) to Class 1 (Low/no sensitization); however, the greatest odds were among those in Class 2 (Highly Sensitized) (OR=5.2, 95% CI 1.8–14.7). Results of analyses with the outcome of current AD are similar (see Table E2 in this article’s Online Repository at www.jacionline.org).
Table 2.
Odds ratios (and 95% confidence intervals) for AD, Doctor Diagnosis of Asthma and Wheeze.
| Conventional Atopy (any sensitization versus no sensitization) | Class 2 (Highly sensitized) versus Class 1 (no/low sensitization) | Class 3 (Milk and Egg) versus Class 1 (no/low sensitization) | Class 4 (Peanut and inhalant(s)) versus Class 1 (no/low sensitization) | |
|---|---|---|---|---|
| Ever had atopic dermatitis | 1.8 (1.1–2.8) | 5.2 (1.8–14.7) | 2.4 (1.4–4.0) | 2.8 (1.2–6.5) |
| Any wheeze in the last 12 months | 1.4 (0.8–2.4) | 2.0 (0.7–5.4) | 0.9 (0.5–1.4) | 2.9 (1.4–6.1) |
| Parental report of child’s doctor diagnosis of asthma | 1.1 (0.8–1.6) | 5.3 (1.6–17.4) | 1.6 (0.8–3.0) | 1.8 (0.6–4.9) |
Traditional atopy was not associated with either wheeze (OR=1.4, 95% CI 0.8–2.4) or a doctor diagnosis of asthma (OR=1.1, 95% CI 0.8–1.6) (Table 2). Only those who were in Class 4 (Peanut and inhalant(s)/no milk) were more likely to have wheezed (OR=2.9, 95% CI 1.4–6.1) than those in Class 1 (Low/no sensitization). Class 2 (Highly sensitized) was the only group to have increased odds of having a doctor diagnosis of asthma (OR=5.3, 95% CI 1.6–17.4).
Risk factors and latent class membership
Table 3 shows the extensive list of possible risk factors that were tested for association with latent class membership. These are factors we have previously used in our WHEALS analyses (6, 13, 14). While there was variability in the distribution of most of the risk factor across the classes for many variables considered (e.g., smoker, exposure, delivery type, pet exposure), only a few reached statistical significance. Maternal atopy was positively associated with the higher risk classes (Classes 2 – 4). Cord blood total IgE level was statistically significantly higher (both p<0.01) in both Class 2 (Highly sensitized) and Class 3 (Milk and egg dominated), but not Class 4 (Peanut and inhalant(s)) compared to Class 1 (p=0.25). As expected, Black race was associated with the higher risk classes – but the associations reached statistical significance for Class 3 compared to Class 1 (OR=1.8, 95% CI=1.1 – 2.9).
Table 3.
Cohort characteristics by atopic phenotype
| Class 1 Low to no sensitization |
Class 2 Highly sensitized |
Class 3 Milk and egg dominated |
Class 4 Peanut + inhalant(s) |
p-value | |
|---|---|---|---|---|---|
| N | 457 | 16 | 91 | 30 | |
| Number of positive sIgE tests, mean (s.d.) | 0.4 (0.6) Median=0 |
7.2 (1.9) Median=7 |
2.9 (1.1) Median=3 |
2.8 (1.1) Median=3 |
<0.001 |
| Cord IgE, GM1 (95% CI) | 0.25 (0.22–0.29) | 0.68 (0.32–1.43) | 0.64 (0.48–0.86) | 0.33 (0.19–0.55) | <0.001 |
| Maternal total IgE, GM1 (95% CI) | 32.7 (27.9–38.4) | 81.3 (30.9–214) | 57.3 (40.5–81.2) | 67.7 (36.6–125) | <0.001 |
| % Mom atopic | 53.9 | 75.0 | 65.6 | 78.6 | 0.008 |
| % Black | 57.3 | 68.8 | 70.3 | 73.3 | 0.044 |
| % Household smoke exposure | 23.8 | 31.2 | 30.8 | 20.0 | 0.44 |
| % C-section | 35.4 | 31.3 | 36.7 | 44.8 | 0.75 |
| % Child’s BMI ≥ 85th percentile | 18.5 | 20.0 | 15.0 | 25.9 | 0.65 |
| % Firstborn | 36.1 | 50.0 | 35.2 | 40.0 | 0.68 |
| % Pre-delivery pet | 41.1 | 43.8 | 31.9 | 43.3 | 0.39 |
| % Breast-fed ever | 77.0 | 87.5 | 83.5 | 80.0 | 0.43 |
| % Breast-fed < 6 months | 73.4 | 62.5 | 74.4 | 75.9 | 0.77 |
| % introduction to solid food before 4 months of age | 39.2 | 25.0 | 44.0 | 40.0 | 0.53 |
| % Mom smoked during pregnancy | 9.4 | 6.2 | 12.1 | 10.0 | 0.84 |
| % Married | 65.4 | 81.2 | 61.5 | 66.7 | 0.49 |
| % Parental history of asthma | 29.3 | 35.7 | 36.9 | 34.5 | 0.53 |
| % Maternal history of allergy | 30.2 | 25.0 | 28.6 | 33.3 | 0.93 |
| % Maternal current asthma | 10.5 | 18.7 | 7.7 | 10.0 | 0.58 |
| % Parental history of allergy | 39.6 | 38.5 | 40.5 | 35.7 | 0.98 |
| % Male | 50.8 | 56.3 | 53.9 | 66.7 | 0.38 |
| % Unemployed | 18.7 | 18.8 | 14.4 | 16.7 | 0.81 |
| % Post-high school degree | 32.0 | 43.7 | 33.0 | 36.7 | 0.75 |
| % At least 1 alcoholic drink in year prior to pregnancy | 59.3 | 75.0 | 63.7 | 70.0 | 0.36 |
| %Household income ≥ $80000 | 29.7 | 37.5 | 38.0 | 52.0 | 0.069 |
| % HAP insurance | 43.2 | 62.5 | 55.0 | 40.0 | 0.091 |
| % Detectable Der F | 18.3 | 6.3 | 13.8 | 14.8 | 0.47 |
| % Detectable Fel d 1 | 47.0 | 50.0 | 39.5 | 40.7 | 0.59 |
| % Detectable Can f 1 | 30.8 | 50.0 | 22.5 | 40.7 | 0.085 |
| Living room floor endotoxin level, GM1 (95% CI) | 18.8 (16.5–21.4) | 16.4 (8.2–32.9) | 15.0 (11.0–20.6) | 14.9(9.7–21.4) | 0.35 |
| Maternal age in years, mean (s.d.) | 29.7 (5.3) | 31.4 (5.8) | 30.4 (5.1) | 28.9 (4.4) | 0.28 |
| Gestational age, mean (s.d.) | 38.8 (1.7) | 38.9 (1.2) | 38.7 (1.8) | 38.7 (2.1) | 0.83 |
| Birth weight in grams, mean (s.d.) | 3358 (596) | 3384 (348) | 3309 (575) | 3199 (743) | 0.54 |
| % At least 1 Antibiotic prescription given before 6 months of age | 19.2 | 13.3 | 14.5 | 26.1 | 0.55 |
GM=Geometric mean
Discussion
These data suggest that class membership defined by allergen-specific IgE patterns may identify groups whose membership is more strongly associated with important allergic manifestations such as atopic dermatitis and having a doctor diagnosis of asthma compared to using the conventional atopy grouping defined by having at least one elevated sIgE. The data suggest that the children who are highly sensitized (Class 2) are the most likely to have ever had AD and are more likely than those who have minimal sensitization (Class 1) to wheeze and to have a doctor diagnosis of asthma. The identified associations are stronger than the association that compared children who had any sensitization to those who had none. Interestingly, the associations between class and asthma diagnosis were similar in Class 3 and Class 4, suggesting that food allergens were not as strongly associated with asthma as being highly sensitized.
While some of our odds ratio estimates were not extremely precise, the observed associations suggest that risk for allergic disease outcomes do vary by sensitization patterns and that patterns should be considered in allergic disease analyses. Similarly, while only a few statistically significant associations between risk factors and classes were identified, there were also notable variations in the distributions of risk factors across classes that likely did not reach statistical significance due to small sample size. This work, which utilizes a racially diverse cohort in the United States, supports recent discussions and study results that have been urging researchers to refine the way in which we think about patterns of allergic sensitization in relationship to allergic diseases. A logical next step is for various cohorts to apply this approach – alone and in combination with other cohorts to increase sample size. This approach would provide more precise estimates and allow the identification of groups at highest risk of AD and asthma, as well as associated risk factors, as it appears that use of the traditional definition of atopy may obscure varying levels of risk in subgroups defined by their sensitization patterns.
The number and type of classes characterized here is not intended to be an exhaustive list, as the analytical approach used needs to be replicated and compared in other cohorts. For example, classes may vary by population (age, gender, race) or region. Our study uniquely extends the work of others by examining a more recently born, younger and racially mixed cohort. We additionally introduce some potentially interesting co-sensitization patterns from our cross-sectional analyses, with peanut sensitization as equally likely to be paired with at least 1 inhalant sensitization as with the two other foods. Milk and egg co-sensitization was the most common pairing, perhaps due to the age of this cohort and relatively common exposure, but this pairing was also consistently associated with the lowest rate of allergic disease outcomes among the three higher risk groups.
Other researchers have applied latent class/cluster analytical methods in a similar way, primarily to explore asthma or wheeze phenotypes (15) (16–25). The few publications that report analyses exploring atopic phenotypes are from racially homogeneous populations and older birth cohorts with sensitization measured at several time points involving two European birth cohorts (Manchester (MAAS)(1) and Isle of Wight (IoW))(26). Our results are difficult to directly compare to these other published results, partly because we have sIgE measured only once (at age 2). For example, Simpson identified five classes when considering measures at 1, 3, 5 and 8 years of age (multiple early, multiple late, dust mite, non-dust mite, and no latent vulnerability) and concluded only multiple early atopy was associated with asthma. Our results are consistent in that the highly sensitized class (at least 4 elevated sIgE) was significantly associated with asthma diagnosis. In contrast, we do not show any dust mite dominated group. This also suggests that there may be geographic differences in key allergens related to allergic diseases, perhaps related to differences in the average concentrations of inhalant allergens.
Both of these populations are largely White, and the cohorts were begun in 1989 (MAAS) and 1990 (IofW), respectively (1, 4, 26). Our birth cohort began enrollment in 2003 and is racially diverse with 62% Black race. Although examination of longitudinal patterns is a strength for those cohorts, in clinical practice serial determination of sensitization (by sIgE or SPT) is not commonly available.
In the Australian Childhood Asthma Prevention Study(3), four classes were identified among 509 children enrolled in a randomized control trial of an intervention of dust mite avoidance and omega-3 fatty acid supplementation: 1) late mixed inhalant sensitization, 2) mixed food and inhalant sensitization, 3) dust mite monosensitized; and, 4) no atopy. The latent classes were derived from skin prick tests administered at 1.5, 3, 5 and 8 years of age, and members of the classes with sensitization were more likely to have had eczema, rhinitis, asthma, airway hyperresponsiveness, poor asthma control, and airflow obstruction compared to the children without atopy. While our study differs due to the use of sIgE rather than skin prick tests and the lack of multiple time points, we also characterized a mixed food and inhalant group, but not a dust mite monosensitized group. This may be due to geographic or socioeconomic variations as well as the earlier age (2 years) of our cohort. They also looked at a limited number of common risk factors in relation to the groupings and found no differences except for an inverse association of maternal smoking that we did not duplicate.
Limitations of our study include the relatively small sample size of our higher risk groupings, impacting the precision of estimated associations (e.g., confidence intervals) between some of the classes and the allergic diseases and risk factors. In particular, larger studies, perhaps even through the combination of multiple birth cohorts, are needed in order to obtain adequate power to fully explore which potentially modifiable risk factors may be driving the “allergic march”. Further, while asthma, which is difficult to diagnose in young children, was based on doctor diagnosis as reported in the age 4 years interview, asthma in this study may have been better classified with latent class analyses if we had additional information on lung function, cytokines, and eosinophils to combine with sIgE results in order to examine potential risk factors(19, 23, 25, 27). We also acknowledge that the outcome of parental report of wheeze can be non-specific; however, it is only one outcome we examined and parental report of wheeze has been used in numerous important allergic disease studies (22, 28, 29).
We want to emphasize that the classes were determined using sensitization to the 10 allergens alone and no outcome data were involved in the calculations to perform the groupings. Therefore, the different risks associated with different classes observed in our study population provide evidence of the hypothesis that distinct endotypes are present in our study population. Also, since we further hypothesized that using these alternative groups in analyses may serve as more specifically defined endotypes, we also compared how the new classes relate to allergic outcome as compared to that of a traditionally used risk factor, atopy(any sIgE≥0.35).
There is a need for examination of sensitization patterns in young children from a racially mixed population. There were few differences in common risk factors across the classes, with race being a notable exception. The racial difference observed could play a role in the racial disparities seen in asthma if early life food allergen sensitization is more strongly associated with asthma than other types of sensitization. This insight could lead to understanding ways to reduce racial disparities in asthma incidence and exacerbation.
In conclusion, we agree with Simpson and others who suggest “viewing atopic sensitization as a dichotomous trait in its relationship to asthma may be an oversimplification”(1). A notable finding of our analysis is that 32% of the lowest risk group would be considered ‘atopic’ by the conventional definition. If these 32% are truly at low to no risk for subsequent development of allergic diseases, then using the conventional definition of atopy would incorrectly force risk estimates closer to the null and thus, perhaps, lead to false negative findings. If these phenotypes do represent “different” diseases, then surveillance, risk factor and prognostic studies, clinical trials and genome-wide genetic association studies that have used the crude definitions may be misleading, missed true associations or have even created false ones. Larger studies are needed to fully explore this possibility, offering hope that this new conceptualization of defining distinct endotypes in analyses will yield tangible evidence to inform prevention and treatment strategies.
Supplementary Material
Key Messages.
Evidence that allergic sensitization (or atopy) as defined by at least one allergen-specific IgE ≥ 0.35 IU/ml is a non-specific classification system to assess risk of subsequent allergic disease is mounting. This report adds to that evidence by identifying four distinct classes within a racially mixed, recently born birth cohort of 2 year old children.
Failure to consider distinct patterns of co-sensitization may limit the clinician’s or researcher’s ability to accurately identify associations that will help inform prevention and treatment strategies.
Acknowledgments
Funding: This work was funded by the National Institutes of Health, USA R01 AI051598 and P01 AI089473
Abbreviations used
- IgE
immunoglobulin E
- sIgE
allergen-specific serum IgE
- GM
geometric mean
- CI
confidence interval
- FIML
full-information maximum likelihood
- WHEALS
Wayne County Health, Environment, Allergy and Asthma Longitudinal Study
- AD
atopic dermatitis
- LCA
latent class analysis
- BIC
Bayesian Information Criteria
- OR
odds ratio
- CI
confidence interval
- s.d
standard deviation
- BMI
body mass index
- LMR
Lo-Mendell-Rubin likelihood ratio test
Footnotes
Publisher's Disclaimer: This is a PDF file of an unedited manuscript that has been accepted for publication. As a service to our customers we are providing this early version of the manuscript. The manuscript will undergo copyediting, typesetting, and review of the resulting proof before it is published in its final citable form. Please note that during the production process errors may be discovered which could affect the content, and all legal disclaimers that apply to the journal pertain.
References
- 1.Simpson A, Tan VY, Winn J, Svensen M, Bishop CM, Heckerman DE, et al. Beyond atopy: multiple patterns of sensitization in relation to asthma in a birth cohort study. American journal of respiratory and critical care medicine. 2010 Jun 1;181(11):1200–6. doi: 10.1164/rccm.200907-1101OC. Epub 2010/02/20.eng. [DOI] [PubMed] [Google Scholar]
- 2.Custovic A, Lazic N, Simpson A. Pediatric asthma and development of atopy. Current opinion in allergy and clinical immunology. 2013 Apr;13(2):173–80. doi: 10.1097/ACI.0b013e32835e82b6. Epub 2013/02/07.eng. [DOI] [PubMed] [Google Scholar]
- 3.Garden FL, Simpson JM, Marks GB. Atopy phenotypes in the Childhood Asthma Prevention Study (CAPS) cohort and the relationship with allergic disease: Clinical Mechanisms in Allergic Disease. Clinical and experimental allergy : journal of the British Society for Allergy and Clinical Immunology. 2013 Jun;43(6):633–41. doi: 10.1111/cea.12095. Epub 2013/05/29.eng. [DOI] [PubMed] [Google Scholar]
- 4.Lazic N, Roberts G, Custovic A, Belgrave D, Bishop CM, Winn J, et al. Multiple atopy phenotypes and their associations with asthma: similar findings from two birth cohorts. Allergy. 2013 Jun;68(6):764–70. doi: 10.1111/all.12134. Epub 2013/04/30.eng. [DOI] [PubMed] [Google Scholar]
- 5.Havstad S, Wegienka G, Zoratti EM, Lynch SV, Boushey HA, Nicholas C, et al. Effect of prenatal indoor pet exposure on the trajectory of total IgE levels in early childhood. The Journal of allergy and clinical immunology. 2011 Oct;128(4):880–5 e4. doi: 10.1016/j.jaci.2011.06.039. Epub 2011/08/09.eng. [DOI] [PMC free article] [PubMed] [Google Scholar]
- 6.Wegienka G, Havstad S, Joseph CL, Zoratti E, Ownby D, Woodcroft K, et al. Racial disparities in allergic outcomes in African Americans emerge as early as age 2 years. Clinical and experimental allergy : journal of the British Society for Allergy and Clinical Immunology. 2012 Jun;42(6):909–17. doi: 10.1111/j.1365-2222.2011.03946.x. Epub 2012/08/23.eng. [DOI] [PMC free article] [PubMed] [Google Scholar]
- 7.Perry LM, Ownby DR, Wegienka GR, Peterson EL, Woodcroft KJ, Joseph CL, et al. Differences in total and allergen specific IgE during pregnancy compared with 1 month and 1 year post partum. Annals of allergy, asthma & immunology : official publication of the American College of Allergy, Asthma, & Immunology. 2009 Oct;103(4):342–7. doi: 10.1016/S1081-1206(10)60535-2. [DOI] [PMC free article] [PubMed] [Google Scholar]
- 8.Ownby DR, Peterson EL, Williams LK, Zoratti EM, Wegienka GR, Woodcroft KJ, et al. Variation of dust endotoxin concentrations by location and time within homes of young children. Pediatric allergy and immunology : official publication of the European Society of Pediatric Allergy and Immunology. 2010 May;21(3):533–40. doi: 10.1111/j.1399-3038.2009.00918.x. Epub 2010/01/22.eng. [DOI] [PMC free article] [PubMed] [Google Scholar]
- 9.McLachlan G, Peel D. Wiley, editor. Finite Mixture Models. 1. New York: Wiley-Interscience; 2000. [Google Scholar]
- 10.Muthen LK, Muthen BO. Mplus user’s guide. Los Angeles, CA: Muthen & Muthen; 1998–2013. [Google Scholar]
- 11.Nylund KL, Asparouhov T, Muthen BO. Deciding on the number of classes in latent class analysis and growth mixture modeling: A Monte Carlo simulation study. Structural Equation Modeling. 2007;14(4):535–69. [Google Scholar]
- 12.Clogg CC. In: Handbook of statistical modling for the social and behavioral sciences. Arminger G, Clogg CC, Sobel ME, editors. New York: Plenum Press; 1995. [Google Scholar]
- 13.Wegienka G, Johnson CC, Havstad S, Ownby DR, Nicholas C, Zoratti EM. Lifetime dog and cat exposure and dog- and cat-specific sensitization at age 18 years. Clinical and experimental allergy : journal of the British Society for Allergy and Clinical Immunology. 2011 Jul;41(7):979–86. doi: 10.1111/j.1365-2222.2011.03747.x. Epub 2011/06/15.eng. [DOI] [PMC free article] [PubMed] [Google Scholar]
- 14.Joseph CL, Ownby DR, Havstad SL, Woodcroft KJ, Wegienka G, MacKechnie H, et al. Early complementary feeding and risk of food sensitization in a birth cohort. The Journal of allergy and clinical immunology. 2011 May;127(5):1203–10 e5. doi: 10.1016/j.jaci.2011.02.018. Epub 2011/04/05.eng. [DOI] [PMC free article] [PubMed] [Google Scholar]
- 15.Woodruff PG, Modrek B, Choy DF, Jia G, Abbas AR, Ellwanger A, et al. T-helper type 2-driven inflammation defines major subphenotypes of asthma. American journal of respiratory and critical care medicine. 2009 Sep 1;180(5):388–95. doi: 10.1164/rccm.200903-0392OC. Epub 2009/06/02.eng. [DOI] [PMC free article] [PubMed] [Google Scholar]
- 16.Haldar P, Pavord ID, Shaw DE, Berry MA, Thomas M, Brightling CE, et al. Cluster analysis and clinical asthma phenotypes. American journal of respiratory and critical care medicine. 2008 Aug 1;178(3):218–24. doi: 10.1164/rccm.200711-1754OC. Epub 2008/05/16.eng. [DOI] [PMC free article] [PubMed] [Google Scholar]
- 17.Moore WC, Bleecker ER, Curran-Everett D, Erzurum SC, Ameredes BT, Bacharier L, et al. Characterization of the severe asthma phenotype by the National Heart, Lung, and Blood Institute’s Severe Asthma Research Program. The Journal of allergy and clinical immunology. 2007 Feb;119(2):405–13. doi: 10.1016/j.jaci.2006.11.639. Epub 2007/02/13.eng. [DOI] [PMC free article] [PubMed] [Google Scholar]
- 18.Moore WC, Meyers DA, Wenzel SE, Teague WG, Li H, Li X, et al. Identification of asthma phenotypes using cluster analysis in the Severe Asthma Research Program. American journal of respiratory and critical care medicine. 2010 Feb 15;181(4):315–23. doi: 10.1164/rccm.200906-0896OC. Epub 2009/11/07.eng. [DOI] [PMC free article] [PubMed] [Google Scholar]
- 19.Fitzpatrick AM, Teague WG, Meyers DA, Peters SP, Li X, Li H, et al. Heterogeneity of severe asthma in childhood: confirmation by cluster analysis of children in the National Institutes of Health/National Heart, Lung, and Blood Institute Severe Asthma Research Program. The Journal of allergy and clinical immunology. 2011 Feb;127(2):382–9. e1–13. doi: 10.1016/j.jaci.2010.11.015. Epub 2011/01/05.eng. [DOI] [PMC free article] [PubMed] [Google Scholar]
- 20.Just J, Gouvis-Echraghi R, Rouve S, Wanin S, Moreau D, Annesi-Maesano I. Two novel, severe asthma phenotypes identified during childhood using a clustering approach. The European respiratory journal. 2012 Jul;40(1):55–60. doi: 10.1183/09031936.00123411. Epub 2012/01/24.eng. [DOI] [PubMed] [Google Scholar]
- 21.Spycher BD, Silverman M, Brooke AM, Minder CE, Kuehni CE. Distinguishing phenotypes of childhood wheeze and cough using latent class analysis. The European respiratory journal. 2008 May;31(5):974–81. doi: 10.1183/09031936.00153507. Epub 2008/01/25.eng. [DOI] [PubMed] [Google Scholar]
- 22.Savenije OE, Granell R, Caudri D, Koppelman GH, Smit HA, Wijga A, et al. Comparison of childhood wheezing phenotypes in 2 birth cohorts: ALSPAC and PIAMA. The Journal of allergy and clinical immunology. 2011 Jun;127(6):1505–12 e14. doi: 10.1016/j.jaci.2011.02.002. Epub 2011/03/18.eng. [DOI] [PubMed] [Google Scholar]
- 23.Henderson J, Granell R, Heron J, Sherriff A, Simpson A, Woodcock A, et al. Associations of wheezing phenotypes in the first 6 years of life with atopy, lung function and airway responsiveness in mid-childhood. Thorax. 2008 Nov;63(11):974–80. doi: 10.1136/thx.2007.093187. Epub 2008/08/06.eng. [DOI] [PMC free article] [PubMed] [Google Scholar]
- 24.Weinmayr G, Keller F, Kleiner A, du Prel JB, Garcia-Marcos L, Batlles-Garrido J, et al. Asthma phenotypes identified by latent class analysis in the ISAAC phase II Spain study. Clinical and experimental allergy : journal of the British Society for Allergy and Clinical Immunology. 2013 Feb;43(2):223–32. doi: 10.1111/cea.12035. Epub 2013/01/22.eng. [DOI] [PubMed] [Google Scholar]
- 25.Smith JA, Drake R, Simpson A, Woodcock A, Pickles A, Custovic A. Dimensions of respiratory symptoms in preschool children: population-based birth cohort study. American journal of respiratory and critical care medicine. 2008 Jun 15;177(12):1358–63. doi: 10.1164/rccm.200709-1419OC. [DOI] [PubMed] [Google Scholar]
- 26.Roberts G, Zhang H, Karmaus W, Raza A, Scott M, Matthews S, et al. Trends in cutaneous sensitization in the first 18 years of life: results from the 1989 Isle of Wight birth cohort study. Clinical and experimental allergy : journal of the British Society for Allergy and Clinical Immunology. 2012 Oct;42(10):1501–9. doi: 10.1111/j.1365-2222.2012.04074.x. Epub 2012/09/22.eng. [DOI] [PubMed] [Google Scholar]
- 27.Fitzpatrick AM, Baena-Cagnani CE, Bacharier LB. Severe asthma in childhood: recent advances in phenotyping and pathogenesis. Current opinion in allergy and clinical immunology. 2012 Apr;12(2):193–201. doi: 10.1097/ACI.0b013e32835090ac. [DOI] [PMC free article] [PubMed] [Google Scholar]
- 28.Yao W, Barbe-Tuana FM, Llapur CJ, Jones MH, Tiller C, Kimmel R, et al. Evaluation of airway reactivity and immune characteristics as risk factors for wheezing early in life. The Journal of allergy and clinical immunology. 2010 Sep;126(3):483–8. e1. doi: 10.1016/j.jaci.2010.06.028. [DOI] [PMC free article] [PubMed] [Google Scholar]
- 29.Behbod B, Sordillo JE, Hoffman EB, Datta S, Muilenberg ML, Scott JA, et al. Wheeze in infancy: protection associated with yeasts in house dust contrasts with increased risk associated with yeasts in indoor air and other fungal taxa. Allergy. 2013 Oct 10; doi: 10.1111/all.12254. [DOI] [PMC free article] [PubMed] [Google Scholar]
Associated Data
This section collects any data citations, data availability statements, or supplementary materials included in this article.