Summary
Activated Ras GTPase signalling is a critical driver of oncogenic transformation and malignant disease. Cellular models of RAS-dependent cancers have been used to identify experimental small-molecules, such as SCH51344, but their molecular mechanism of action remains generally enigmatic. Here, using a chemical proteomic approach we identify the target of SCH51344 as the human mutT homologue MTH1, a nucleotide pool sanitising enzyme. Loss-of-function of MTH1 impaired growth of KRAS tumour cells whereas MTH1 overexpression mitigated sensitivity toward SCH51344. Searching for more drug-like inhibitors, we identified the kinase inhibitor crizotinib as a nanomolar suppressor of MTH1 activity. Surprisingly, the clinically used (R)-enantiomer of the drug was inactive, whereas the (S)-enantiomer selectively inhibited MTH1 catalytic activity. Enzymatic assays, chemical proteomic profiling, kinome-wide activity surveys, and MTH1 co-crystal structures of both enantiomers provided a rationale for this remarkable stereospecificity. Disruption of nucleotide pool homeostasis via MTH1 inhibition by (S)-crizotinib induced an increase in DNA single strand breaks, activated DNA repair in human colon carcinoma cells, and effectively suppressed tumour growth in animal models. Our results propose (S)-crizotinib as an attractive chemical entity for further pre-clinical evaluation and small molecule inhibitors of MTH1 in general as a promising novel class of anti-cancer agents.
Keywords: DNA repair, stereoselectivity, drug, MTH1, crizotinib, cancer
Mutations in RAS isoforms are prevalent in human cancers, accompanied by poor prognosis and low survival, highlighting the need to develop new therapies1-3. Direct modulation of RAS activity has posed a significant challenge in drug discovery. Alternative approaches have been used, for example by interfering with RAS posttranslational modifications to prevent maturation and translocation of the active protein to the plasma membrane4-6. Phenotypic screens have been employed to search for small molecules that selectively target RAS-transformed cancer cells7. In 1995, this led to the discovery of a compound termed SCH51344 that suppressed the anchorage-independent growth of RAS-transformed fibroblasts8. As SCH51344 did not affect MAPKsignalling, which is thought to be the primary mediator of RAS oncogenic activity, a novel but enigmatic mode of action was proposed9.
Identification of MTH1 as the main cellular target of SCH51344
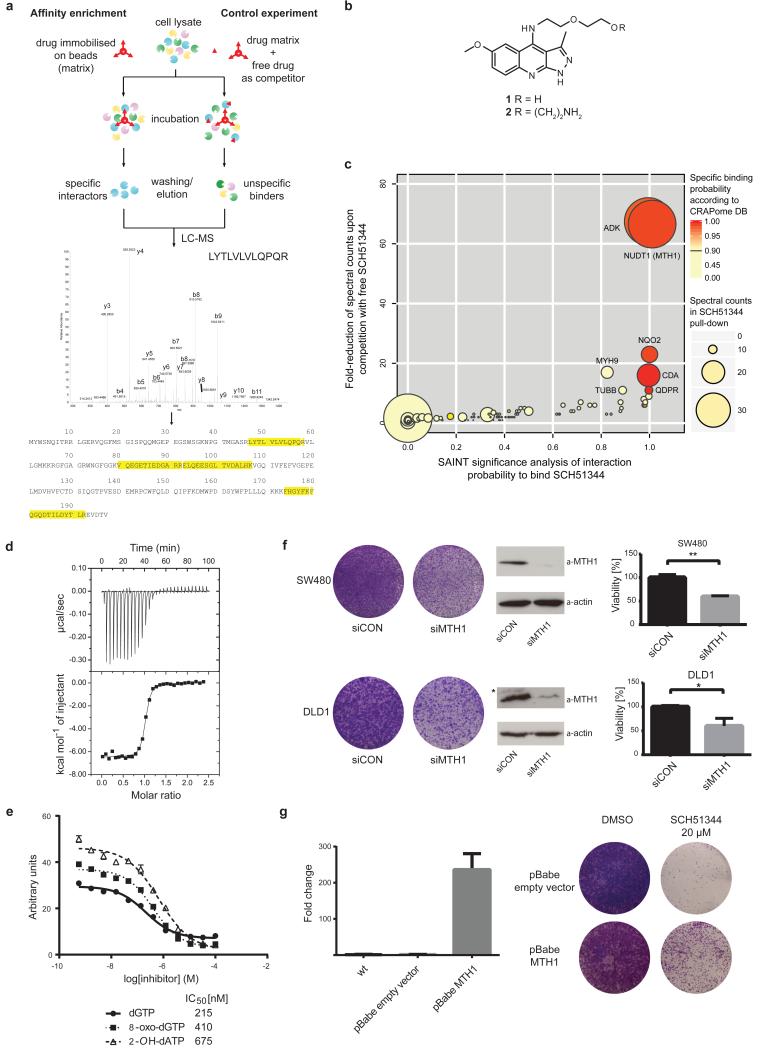
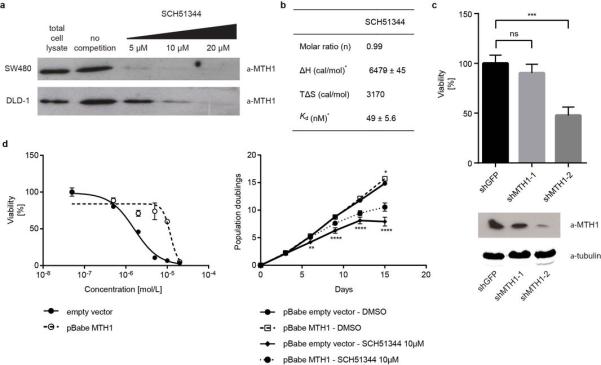
We set out to identify the cellular targets of SCH51344 using a chemical proteomic strategy (Fig. 1a). We generated a SCH51344 affinity probe (Fig. 1b) which we incubated with lysates of KRAS-positive SW480 cells, which are sensitive to SCH51344, and analysed the binding proteins by mass spectrometry. High affinity binders were discriminated against highly abundant low affinity proteins by competition with the free unmodified compound. Bioinformatic analysis revealed the human 7,8-dihydro-8-oxoguanine triphosphatase MTH1 (also known as NUDT1) and adenosine kinase (ADK) as the primary cellular targets of SCH51344 (Fig. 1c). MTH1 has been implicated in aiding RAS-transformed cells to overcome oncogene-induced senescence by preventing reactive oxygen species (ROS)-induced DNA damage10. On the contrary, little was known about the role of ADK in malignant disease but in line with published RNAi data11 we did not observe any growth impairment of SCH51344-sensitive8 PANC1 human pancreatic carcinoma cells upon treatment with the ADK inhibitor ABT-702 (data not shown). We focussed on MTH1 as the most likely relevant target of SCH51344. Having confirmed the binding of SCH51344 to MTH1 in both SW480 and DLD1 cells by immunoblot (Extended Data Fig. 1a), we used isothermal titration calorimetry (ITC) to determine a Kd value of 49 nM for SCH51344 (Fig. 1d, Extended Data Fig. 1b). MTH1 is a homologue of the bacterial mutT, a nucleotide pool sanitising enzyme which cleaves oxidised nucleotides such as 8-oxo-deoxyguanosinetri-phosphate (8-oxo-dGTP) thereby converting the triphosphates into the corresponding mono-phosphates12. The hydrolysis reaction assures that the oxidised nucleotides can no longer be recognised by DNA polymerase, preventing the mispairing of bases during replication and transversion mutations13,14. To investigate the effect of SCH51344 on MTH1 catalytic activity we monitored the production of pyrophosphate (PPi) as a result of nucleotide triphosphate hydrolysis15. We determined IC50 values of 215 nM, 410 nM, and 675 nM for SCH51344 against the MTH1 substrates dGTP, 8-oxo-dGTP, and 2-OH-dATP, confirming a direct effect of SCH51344 on MTH1 catalytic activity (Fig. 1e). To validate MTH1 as the causal target for the antiproliferative effects of SCH51344, we transfected human SW480 and DLD1 cells with MTH1-siRNA which impaired colony formation (Fig. 1f). Stable knockdown using lentiviral shRNAs16 phenocopied results obtained using the inhibitor (Extended Data Fig. 1c). Conversely, overexpression of MTH110 reduced sensitivity of SW480 cells against SCH51344 (Fig. 1g, Extended Data Fig. 1d), mechanistically corroborating the evidence that MTH1 is the main cellular target of SCH51344.
Figure 1. MTH1 is the target of SCH51344.
a, Representation of the chemical proteomic workflow. b, Sructures of SCH51344 (1) and the probe used for affinity purification (2). c, Results from MS-based proteomic affinity purification experiment using SAINT and competition analysis. Data shown are based on two independent experiments for each condition (n = 2/condition), and each replicate was analysed in two technical replicates. d, ITC data for MTH1 with SCH51344. The measured Kd was 49 nM (n = 1). e, SCH51344 inhibits hydrolysis of the MTH1 substrates dGTP, 8-oxo-dGTP, and 2-OH-dATP, respectively. Data are shown for two technical replicates ± SEM and representative for at least duplicate experiments (n ≥ 2). f, Silencing of MTH1 by siRNA impairs colony formation of KRAS-positive SW480 (top) and DLD1 (bottom) cells. Data shown as mean ± SEM and images are representative for triplicate experiments (n = 3) (P < 0.05, t-test). Asterisk denotes unspecific band. g, MTH1 overexpression as monitored by real-time PCR (left) restores SW480 cell viability upon SCH51344 treatment (right). Data shown as mean ± SEM and images are representative for three independent experiments (n = 3).
The (S)-enantiomer of crizotinib inhibits MTH1 activity
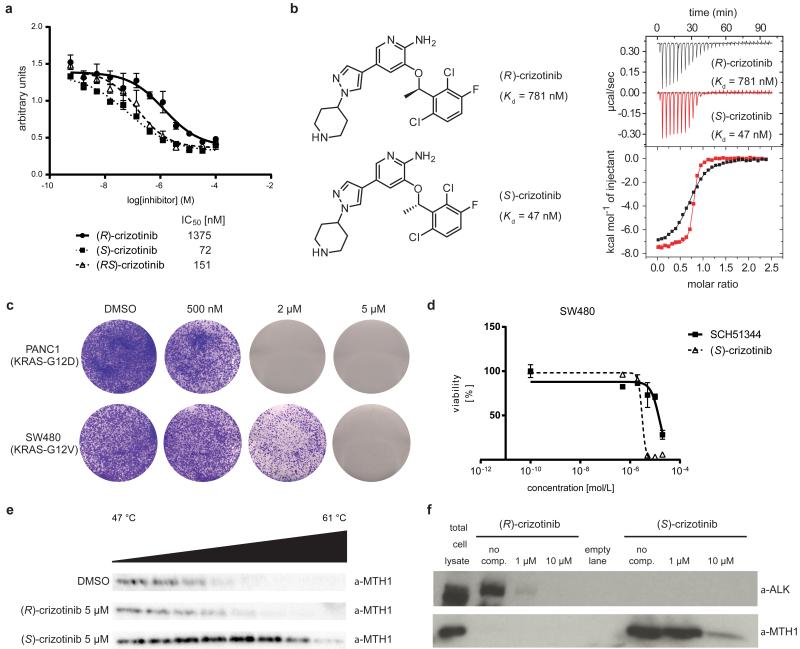
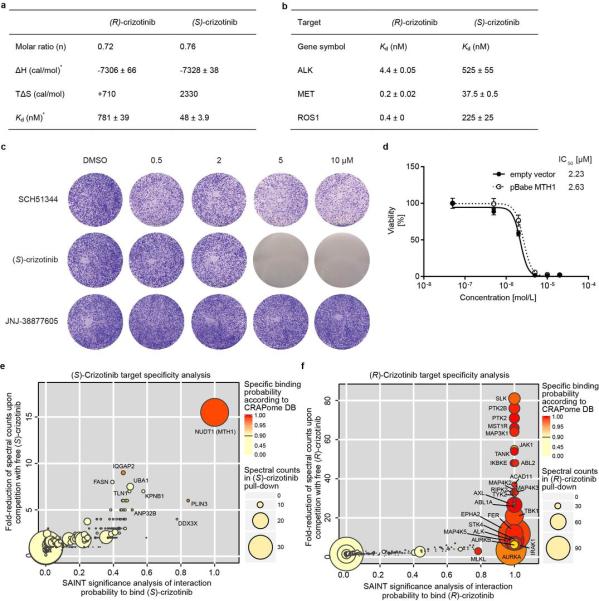
Since SCH51344 has not been evaluated in a clinical setting, we decided to screen for other, more potent MTH1 inhibitors with favourable pharmacokinetic and pharmacodynamic properties. Based on substrates and active site architecture we hypothesised that kinase inhibitors may target MTH1. Screening a kinase inhibitor collection in a thermal shift stability asay17 we found that the dual Met/ALK inhibitor crizotinib18,19 exhibited high affinity toward MTH1 (data not shown). Crizotinib recently received approval for the treatment of EML4-ALK-positive non-small cell lung cancer (NSCLC) and is in several other clinical trials20-23. However, using the catalytic MTH1 assay, we found that crizotinib batches obtained from different vendors resulted in varying IC50 values. This could not be explained by impurities or degradation products as analytical data were in accordance with literature18. Since crizotinib bears a chiral centre, we speculated that variable amounts of crizotinib stereoisomers may occur in different batches of inhibitor. We prepared and tested both the pure, clinically used (R)-as well as the so far unexplored (S)-enantiomer of crizotinib in the MTH1 catalytic assay, which suggested that the screening hit batch contained a racemic mixture. We found that pure (S)-crizotinib was a low nanomolar MTH1 inhibitor whereas the (R)-enantiomer gave IC50 values in the micromolar range (Fig. 2a). These data were confirmed by direct binding assays (ITC) indicating a 16-fold higher affinity of the (S)-enantiomer toward MTH1 (Fig. 2b, Extended Data Fig. 2a). Using Km concentrations of substrates,12,15 we determined average IC50 values of 330 nM and 408 nM for (S)-crizotinib and the MTH1 substrates 8-oxo-dGTP and 2-OH-dATP, respectively (n = 2). Consistent with these data, (S)-crizotinib efficiently inhibited colony formation of SW480 and KRAS mutated PANC1 cells, similar to SCH51344 (Fig. 2c, d). In vitro Kd measurements indicated that (S)-crizotinib was considerably less potent than the (R)-enantiomer against the established targets ALK, MET and ROS1 (Extended Data Fig. 2b).Treatment of SW480 cells with a specific c-MET inhibitor, a potential off-target for (S)-crizotinib,18 did not lead to the detection of any significant effects on proliferation (Extended Data Fig. 2c). However, investigating whether MTH1 overexpression could rescue SW480 cells from cell death induced by (S)-crizotinib in a similar manner as for SCH51344, we failed to observe any significant shift in IC50 values (Extended Data Fig. 2d), raising the question if other targets contributed to the cell killing effect. We started investigating whether MTH1 was indeed targeted by (S)-crizotinib in intact cells. If a cellular protein is bound by a chemical agent, it is stabilized by the physical engagement as compared to the non-engaged counterpart24. In a cellular thermal shift assay using BJ-KRASV12 cells, (S)-crizotinib, in contrast to (R)-crizotinib, efficiently stabilized MTH1 validating the differential targeting within cells (Fig. 2e).
Figure 2. (S)-Crizotinib is a nanomolar MTH1 inhibitor.
a, MTH1 catalytic assay. Data are shown for both crizotinib enantiomers and the racemic mixture at 100 μM dGTP. Results indicate two technical replicates ± SEM representative for at least duplicate experiments (n ≥ 2). b, ITC for MTH1 with (R)- and (S)-crizotinib (n = 1). c, (S)-Crizotinib inhibits colony formation of PANC1 and SW480 cells. Images are representative for three independent experiments (n = 3). d, Comparison of antiproliferative efficacy of (S)-crizotinib versus SCH51344 against SW480 cells. Data shown as mean ± SEM for three independent experiments (n = 3). e, Cellular thermal shift assay MTH1 target engagement by (S)-crizotinib in intact KRASV12-expressing BJ cells. Images are representative of two independent experiments (n = 2). f, The (S)-crizotinibaffinity probe selectively binds MTH1, but not ALK, in SW480 lysates, whereas the (R)-enantiomer exerts inverse properties.
Target specifity of (S)-crizotinib and structural analysis of binding mode
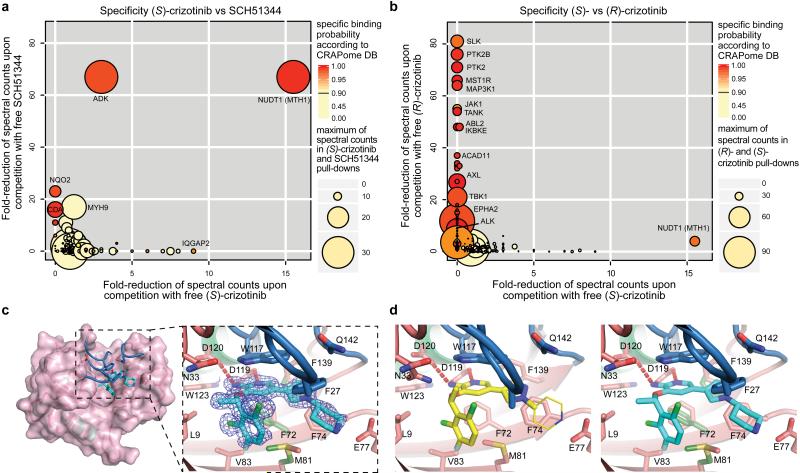
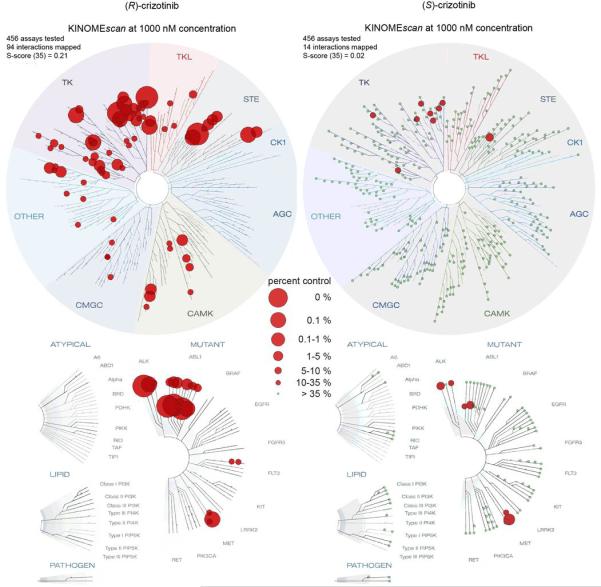
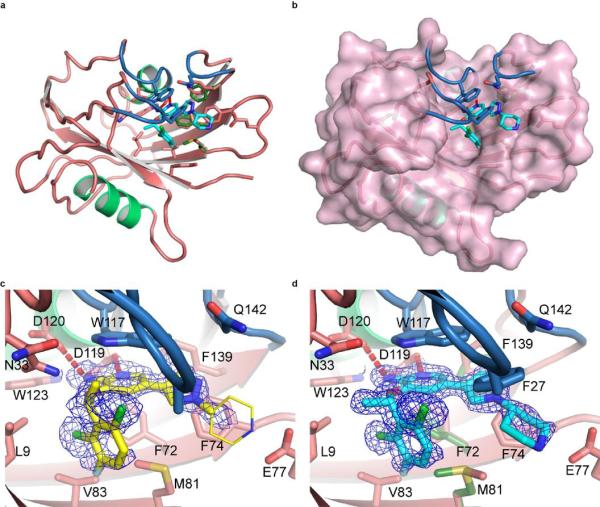
To further investigate the ability of the two crizotinib enantiomers to engage cellular proteins we derived chemical probes suitable for drug pull-downs (Supplementary Information). We tested the two derivatized compounds for their ability to target ALK and MTH1 in SW480 cell extracts. The two enantiomers were remarkably specific for their cognate targets (Fig. 2f). If MTH1 was indeed the key target of (S)-crizotinib in other RAS-transformed cells, it should rank at the top of the specific interactors in an unbiased chemical proteomic experiment as done before with SCH51344. MTH1 was by far the most specific and prominent interactor of (S)-crizotinib (Extended Data Fig. 2e). Plotting the chemical proteomic results of SCH51344 and (S)-crizotinib against each other singled out MTH1 as the only common high-significance interactor (Fig. 3a). We also performed the reciprocal analysis with (R)-crizotinib which identified a plethora of protein kinases, all efficiently competed by free drug, but not MTH1 (Extended Data Fig. 2f). Notably, comparison of both profiles did not reveal any proteins that were significantly bound by both enantiomers (Fig. 3b). To exclude that either crizotinib enantiomer may target kinases of low abundance we interrogated a panel of 456 different recombinant kinases (KINOMEscan, Extended Data Fig. 3)25. In line with the chemoproteomic results the two enantiomers displayed a remarkable stereoselectivity with very distinct profiles. The few kinases to which (S)-crizotinib showed some affinity were not calculated to be significantly inhibited. (R)-Crizotinib not only bound to ten times more kinases, but also was predicted to efficiently inhibit at least ten of them, including the well characterized cognate targets ALK, MET, but also LCK, IRAK1, JAK3, LOK and SLK. To understand the differences in MTH1 binding, we co-crystallised both (R)- and (S)-crizotinib with recombinant protein. The structure revealed an unfavourable eclipsed conformation of the methyl group at the chiral centre and the halogen substituents on the benzyl ring is likely to reduce the energetic favourability of (R)-crizotinib binding (Fig. 3c,d, Extended Data Fig. 4, 5). ITC data confirmed that the difference in binding between (R)- and (S)-crizotinib was entirely entropic and therefore not due to different binding interactions with the protein (Fig. 2b).
Figure 3. Specificity and MTH1 co-crystal structure of (S)-crizotinib.
a, Comparison of (S)-crizotinib specificity versus SCH51344 and b, (R)-crizotinib. MTH1 is the only shared target with SCH51344 and is specific to (S)-crizotinib when compared to (R)-crizotinib. Data represent two independent experiments for each condition (n = 2/condition), and each replicate was analysed in two technical replicates. c, Co-crystal structure of (S)-crizotinib and MTH1. MTH1 is in pink with light green alpha-helices and the loops covering the binding site in blue. Hydrogen-bonding interactions are shown by dashed red lines. d, MTH1 interactions with (R)- and (S)-crizotinib. Left panel shows (R)-crizotinib in yellow; the thinner lines indicate part of the (R)-crizotinib that was not resolved in the electron density. Right panel shows (S)-crizotinib in cyan; alternate protein conformations in the absence of (S)-crizotinib are shown in dark green.
MTH1 inhibitors induce DNA damage in cancer cells and reduce tumour growth
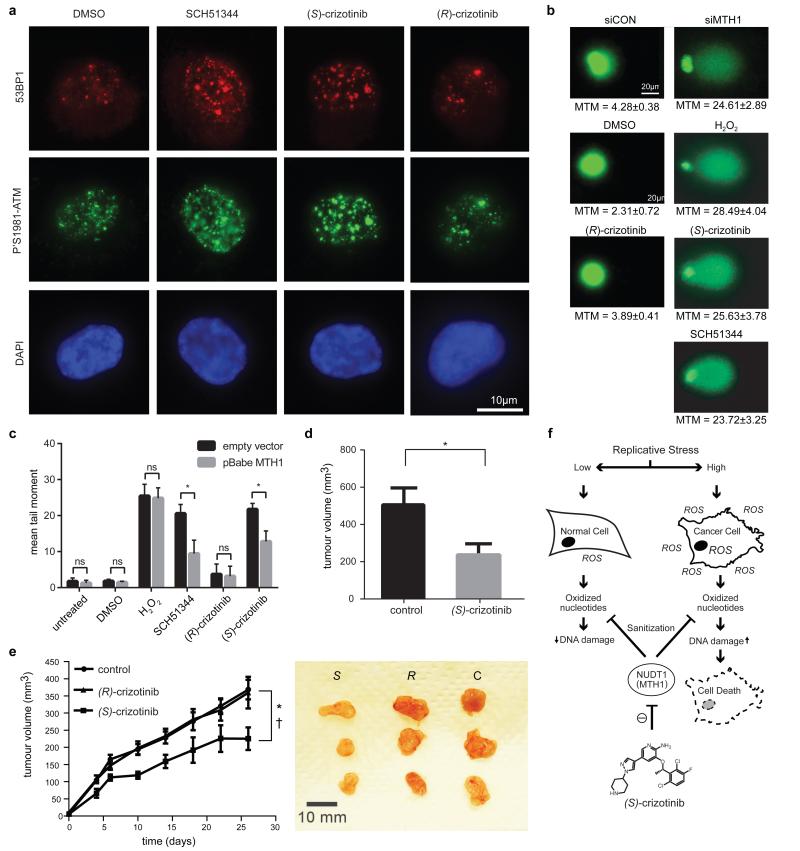
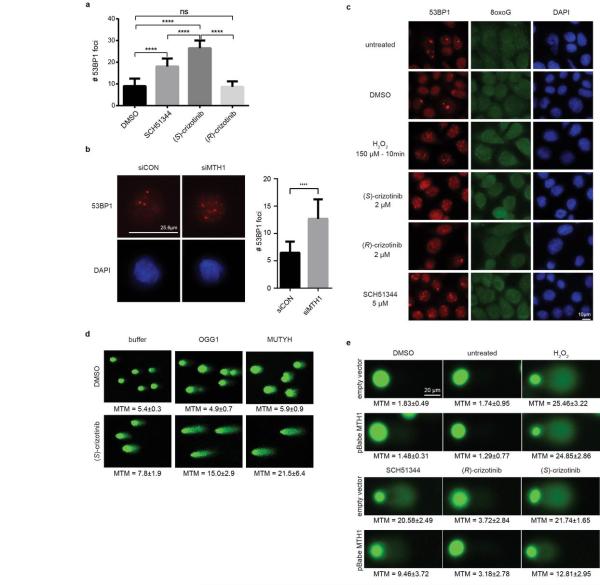
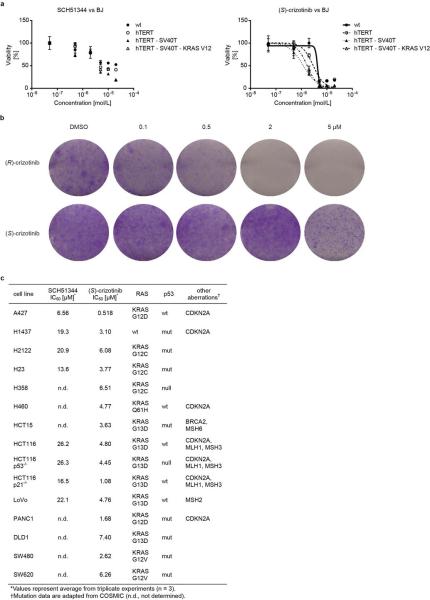
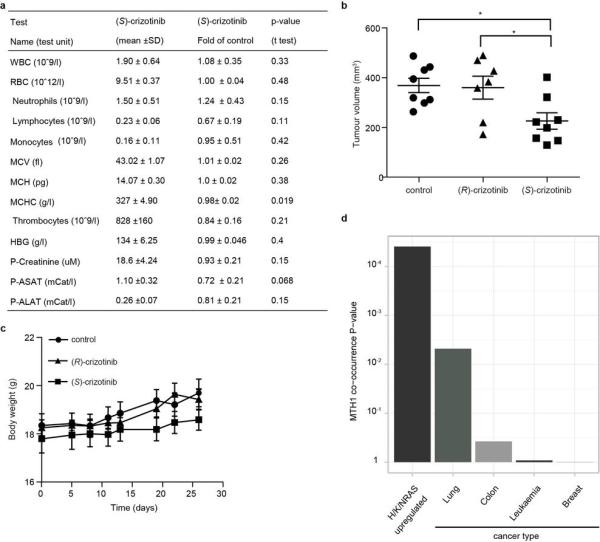
Since MTH1 is thought to prevent incorporation of oxidised nucleotides into DNA, we reasoned that our new MTH1 inhibitors should increase the content of genomic 8-oxoguanine, and thus induce DNA damage. Immunofluorescence staining for both 53BP1 and autophosphorylated ATM, specific markers for DNA damage, was increased in SW480 cells treated with MTH1 inhibitors (Fig. 4a, Extended Data Fig. 6a). 53BP1 foci, which we also observed in cells transfected with MTH1-siRNA, were enriched in nuclei of cells with higher levels of 8-oxoguanine due to increased genomic incorporation (Extended Data Fig. 6b, c). We also tried to quantify the oxidized nucleotides by HPLC-MS, however, due to high experimental background we failed to obtain reliable results. Since accumulation of 8-oxoguanine should activate base excision repair (BER)16 and induce DNA single strand breaks, we tested our inhibitors in an alkaline comet assay. Both (S)-crizotinib as well as SCH51344, but not (R)-crizotinib, yielded a significant tail moment, similar to cells transfected with MTH1-siRNA (Fig. 4b). Addition of the purified 8-oxoguanine- or 2-hydroxy-adenine-specific DNA glycosylases OGG1 and MUTYH, increased tail moments for (S)-crizotinib dramatically, providing evidence for strong accumulation of these lesions upon inhibitor treatment (Extended Data Fig. 6d). MTH1 overexpression significantly reduced the number of DNA single strand breaks induced by (S)-crizotinib as well as SCH51344, but not by H2O2 (Fig. 4c, Extended Data Fig. 6e) providing evidence for MTH1 being the functionally relevant target. To explore the role of p53 in the cellular response to MTH1 suppression16 we created a SW480 Tet-on system26 allowing for the inducible expression of p53 shRNAs and treated the cells with our inhibitors (Extended Data Fig. 7) which indicated a p53-independent mode of action. Treatment of SW480 cells expressing anti-MTH1 shRNA with the ATM- and ATR-inhibitors KU55933 and VE821, respectively, also did not display any differential effects (Extended Data Fig. 8). Similarly, ATM−/− MEFs were equally sensitive to MTH1 inhibitors as their ATM-proficient counterparts. Investigating cell lines bearing additional mutations in DNA repair genes we found that HCT116 deficient for p21 were particularly sensitive to (S)-crizotinib. We tested our inhibitors in BJ skin fibroblasts that were either wild type, immortalized by hTERT, or transformed by SV40T and/or mutant KRAS. Both SCH51344 and (S)-crizotinib exhibited highest toxicity toward the SV40T and KRAS-V12 cells (Extended Data Fig. 9). Importantly, when we treated wild type BJ cells with (R)- or (S)-crizotinib, we found that the (S)-enantiomer did not exhibit any increased toxicity on non-transformed cells. Among a panel of human cancer cell lines, we consistently observed a strong antiproliferative effect for (S)-crizotinib, in line with its lower catalytic assay IC50 value. To explore the in vivo potential of (S)-crizotinib to impair tumour growth we performed mouse xenograft studies using SW480 cells. These experiments indicated that (S)-crizotinib, but not the (R)-enantiomer, was able to impair overall tumour progression as well as specifically reduce tumour volume by more than 50% (Fig. 4d, e, Extended Data Fig. 10a-c). This suggested that the two enantiomers have clearly diverse antitumoural profiles and was consistent with their distinct molecular mechanism of action.
Figure 4. (S)-Crizotinib is a selective MTH1 inhibitor with in vivo anticancer activity.
a, The MTH1 inhibitors SCH51344 (5 μM) and (S)-crizotinib (2 μM), but not (R)-crizotinib (2 μM), induce DNA damage as indicated by an increase in 53BP1 foci and ATM autophosphorylation. Images are representative for three independent experiments (n = 3). b, Comet assay. Similar to MTH1 gene silencing both SCH51344 (5 μM) and (S)-crizotinib (2 μM), but not (R)-crizotinib (2 μM), induce DNA single strand breaks (MTM, mean tail moment). H2O2 was used as positive control (150 μM, 10 min). Images are representative for three independent experiments (n = 3), data are shown as mean ± SD. c, MTH1 overexpression reduces the number of DNA single strand breaks induced by SCH51344 and (S)-crizotinib. Compound concentrations are as in b. d, Results from SW480 mouse xenograft study. Effect on tumour growth following 35 days treatment with the MTH1 inhibitor (S)-crizotinib (25mg/kg q.d., s.c. daily, data are shown as mean ± SEM, n = 8/group). e, (S)-Crizotinib, but not (R)-crizotinib, impairs tumour growth in an SW480 colon carcinoma xenograft model (50mg/kg p.o., q.d.) Data show mean ± SEM, n=7-8 animals/group. Statistical analysis performed by 2-way repeat measurement ANOVA, Sidak’s multiple comparison; * p < 0.05 (S)-crizotinib vs control; † p < 0.05 (S)-crizotinib vs (R)-crizotinib. Images depict representative tumours for each treatment group (C, control). f, Proposed mechanism for MTH1-inhibitor-induced cancer cell death.
Disruption of nucleotide pool homeostasis as a novel anticancer strategy
Increased levels of ROS in fast-proliferating cancer cells impair nucleotide pool homeostasis and contribute to mutations and DNA damage10. Removal of oxidised nucleotides by MTH1 may relieve cancer cells from proliferative stress and thereby represent a vulnerability factor and an attractive target for antitumoural compounds (Fig. 4f)27. MTH1 levels are increased in RAS-expressing cancers (Extended Data Fig. 10d) ranging from lung cancer28,29 to renal carcinoma30, supportive of the notion that there is a connection between oncogenic transformation and oxidative stress. A potential more global role of MTH1 in tumourigenesis is supported by the observed antiproliferative effects for the inhibitors on cancer cells transformed by mechanisms other than RAS mutations (Extended Data Fig. 9c)8. Although prolonged clinical application will need to be evaluated critically in light of an increased long-term tumour burden in Mth1−/− (Nudt1) mice, the mild phenotype of these knockout animals31, and the specificity of MTH1 inhibitors speak for an appropriate therapeutic window. We propose that MTH1, together with other enzymes controlling sanitisation of oxidised nucleotides, may represent a new attractive targeting strategy for difficult-to-treat tumours that display high levels of replicative and oxidative stress. The identification of the chemical mirror image of a recently clinically approved anticancer agent, crizotinib, as a nanomolar inhibitor of a yet pharmacologically unexploited cellular process, argues for further high-priority pre-clinical and clinical studies. A thorough investigation of the pharmacodynamics and pharmacokinetic properties of (S)-crizotinib will be necessary to understand why overexpression of MTH1 failed to rescue its cell-killing effects under the conditions tested. Until then, the possibility remains that targets other than MTH1 contribute to the effects of (S)-crizotinib. While (S)-crizotinib is technically a new chemical entity and would require a new, separate drug approval process, the fact that it differs from a safe and bioavailable drug only in one chiral centre makes it somewhat more likely to have favourable, drug-like properties32 and thus may be auspicious for an efficient evaluation of the potential therapeutic merits.
Online Only Methods
Cell culture
BJ, H1437, H2122, H23, H358, H460, HCT116, and U2OS cells were obtained from ATCC and DMSZ. SW480, DLD1, and SW620 were kindly provided by Walter Berger, PANC1 were a generous gift from Rudolf Oehler. The BJ-hTERT, BJ-SV40T and BJ-RasV12 were generously provided by William Hahn. HCT116 p53−/− and HCT116 p21−/− were used by kind permission of Bert Vogelstein. HCT116 +chr3 were generously provided by Rick Boland, LoVo and HCT15 were a kind gift from Christoph Gasche. ATM wild type and ATM−/− MEFs were kindly provided by Andre Nussenzweig. All cells were cultured in the recommended media containing 10% fetal bovine serum and 10 U/mL penicillin/streptomycin (Gibco) and checked for mycoplasma by PCR or ELISA prior to experimental use.
Immunoblotting
The following antibodies were used according to manufacturer’s instructions: rabbit anti-MTH1 (NB100-109, Novus Biologicals),16 rabbit anti-actin (AAN01, Cytoskeleton), mouse anti-tubulin (DM1A, Abcam), goat anti-p53 (C-19, Santa Cruz Biotechnology), goat Alexa Fluor 680 anti-mouse IgG (Life Technologies).
Expression of recombinant MTH1
Codon-optimised human MTH1 cDNA subloned into a pETM-11 vector (Gunther Stier, EMBL) featuring a His-tag and TEV site was obtained from GenScript (GenScript, NJ, USA) and expressed in the E. coli strain BL21 DE3 (Life Technologies). After harvesting, bacteria were lysed using buffer (50 mM Tris-HCl pH 7.5, 500 mM NaCl, 5% glycerol, 5 mM β-mercaptoethanol, 1 mM PMSF) containing lysozyme (Sigma-Aldrich) and DNase I (Roche). His-tagged protein was purified with NiNTA agarose (Qiagen), washed with buffer, and eluted with an imidazole gradient. Following removal of the His-tag by incubation with TEV protease, fractions were dialysed and purified using size-exclusion chromatography (Sephadex, GE Healthcare). Protein concentration of the purified fractions was determined by UV (A280). The identity of the protein was confirmed by MALDI-TOF and protein activity determined by kinetic analysis which gave values in accordance with literature data.15
MTH1 catalytic assay
Half-maximal inhibitory concentrations (IC50) were determined using a luminescence-based assay as described previously15 with some minor modifications. Briefly, serial dilutions of compounds were dissolved in assay buffer (100 mM Tris-acetate pH 7.5, 40 mM NaCl and 10 mM Mg(OAc)2 containing 0.005% Tween-20 and 2 mM dithiothreitol (DTT). Upon addition of MTH1 recombinant protein (final concentration 2 nM), plates were incubated on a plate shaker for 15 min at room temperature. After addition of the substrate dGTP (Fermentas, final concentration 100 μM), 8-oxo-dGTP (TriLink Biotechnologies, final concentration 13.2 μM), or 2-OH-dATP (Jena Bioscience, final concentration 8.3 μM) the generation of pyrophosphate (PPi) as a result of nucleotide triphosphate hydrolysis by MTH1 was monitored over a time course of 15 min using the PPiLight Inorganic Pyrophosphate Assay kit (Lonza Rockland). IC50 values were determined by fitting a dose response curve to the data points using non-linear regression analysis utilizing the GraphPad Prism software.
siRNA experiments
Both a commercial MTH1-siRNA set (SMARTpool ON-TARGETplus, Dharmacon) as well as a custom-synthesised siRNA (Sigma-Aldrich) were obtained. The custom siRNA sequence was CGACGACAGCUACUGGUUU, AllStars Negative Control siRNA (Qiagen) was used as control. For transfections, cells were seeded in 24-well plates at approximately 30% confluency 24 h prior to siRNA treatment. The next day, medium was aspirated and transfections performed with INTERFERin (Polyplus) according to manufacturer’s instructions using a final siRNA concentration of 10 nM. Cells were incubated for 2-3 days, washed, detached with trypsin and replated in 6-well plates. After 7-10 days, medium was aspirated, cells were washed with PBS, fixed with ice-cold methanol, stained with crystal violet solution (0.5% in 25% methanol) and left to dry overnight. For quantification of results, UV absorbance of crystal violet was determined at 595 nm following solubilisation by 70% ethanol. Data were analysed using the GraphPad Prism software (t test, P < 0.05).
Target engagement assay
The ability of compounds to interact with, and thereby stabilize the target in intact cells, was analyzed essentially as described by Molina et al.24 Briefly, BJ SV40T RasV12-cells cultured in T150 flasks to 80% confluency, were treated with cell media containing 1% DMSO and 5 or 50 μM either (R)- and (S)-crizotinib for 3 hours. After treatment, cells were harvested in trypsin, collected by centrifugation and subsequently resuspended in TBS. The cell suspension was aliquoted into eight PCR tubes and heated for 3 minutes to 47, 49, 51, 53, 54, 57, 59 or 61°C. Subsequently, cells were lysed using liquid nitrogen and three repeated cycles of freeze-thawing. Precipitated proteins were separated from the soluble fraction by centrifugation at 17,000g for 20 minutes. Soluble proteins, collected in the supernatant, were kept at −80°C until Western blot analysis. Half of each aliquot was loaded onto 4-25% SDS-PAGE gels, blotted on nitrocellulose membranes and analyzed for MTH1-expression using the MTH1-antibody from Novus Biologicals at a concentration of 1:500.
Cloning of miR30-based shRNAs
To obtain inducible anti-p53-TRMPV-Neo miR30 shRNAs, pMLP plasmids containing p53-targeting sequences33 were digested with EcoRI and XhoI, followed by ligation into the TRMPV-Neo vector.26
Retro- and lentivirus production
For stable knockdown and MTH1 overexpression studies, 293T cells were transfected with helper plasmids and either pBABE-puro (Addgene plasmid 1764) or pBabe puro MTH1 (Addgene plasmid 21295), pLKO-eGFP-shRNA-control, pLKO.1 shMTH1-1 (Addgene plasmid 21297), or pLKO.1 shMTH1-2 (Addgene plasmid 21298). SW480 cells were then treated with 48h supernatants containing polybrene (8 μg/mL) for three hours. The next day cells were selected with puromycin (5 μg/mL). Tet-on competent SW480 were established by transduction of cells with pMSCV-rtTA3-IRES-EcoR-PGK-PuroR.26 After selection with puromycin (5 μg/mL), cells were transduced with TRMPV-Neo-shRNAs using Plat-E cells and ecotropic packaging. After subsequent selection with G418 (1 mg/mL) the expression of shRNAs was induced using doxycycline (2 μg/mL) and monitored by FACS.
Real-time PCR analysis
Total RNA was isolated using the RNeasy Mini Kit (Qiagen). 500 ng RNA was reverse transcribed using oligo(dT) primers using RevertAid Reverse Transcriptase (Fermentas). Quantitative PCR was carried out on a RotorGene RG-600 (Qiagen) PCR machine using the SensiMix SYBR kit (Bioline). Results were quantified using the 2-ddC(t) method, using GAPDH expression levels for normalization.
Primer sequences
NUDT1-F 5′-CTCAGCGAGTTCTCCTGG-3′; NUDT1-R 5′-GGAGTGGAAACCAGTAGCTGTC-3′.
Colony formation assay
One day before treatment, 5×10³ or 104 cells were seeded per well in 6-well plates and incubated for 24 h. The next day DMSO (equal to highest amount of compound dilution, maximum 0.2%) or compounds in increasing concentrations were added and cells incubated at 37°C, 5% CO2, for 7-10 days. After washing with PBS (Gibco), cells were fixed with ice-cold methanol, stained with crystal violet solution (0.5% in 25% methanol) and left to dry overnight. For quantification of results, UV absorbance of crystal violet was determined at 595 nm following solubilisation by 70% ethanol. Data were analysed using non-linear regression analysis utilizing the GraphPad Prism software.
Proliferation Rate Measurements
Population doublings (PD) were determined as described16. Briefly, 1×10⁵cells were plated in triplicate in 6-well plates followed by addition of drug or DMSO 6 h later and counting the number of cells every three days, after which 1×10⁵cells were replated for the next count. The numbers were converted into population doublings using the following formula: [log (no. of cells counted)-log (no. of cell plated)]/log (2).
Comet assay
Cells were treated with compounds for 3 or 6 days, upon which DNA single-strand breaks were assayed using the comet assay under alkali conditions. For the H2O2 control, cells were treated with H2O2 (Sigma-Aldrich) in PBS at 150 μM for 10 minutes. Cells were washed twice with PBS, harvested using a rubber scraper, pelleted by centrifugation, resuspended in PBS and mixed with 1% low-gelling-temperature agarose (Sigma type VII) that was maintained at 37°C. The mixture of cells and agarose was layered onto frosted glass slides pre-coated with 0.5% agarose and slides were placed on ice to gel. Slides were maintained in the dark for all subsequent steps. Slides were immersed in pre-chilled lysis buffer (2.5 M NaCl, 0.1 M EDTA, 10 mM Tris-HCL pH 7.70, 1% Triton X-100, 1% DMSO) for 1 hour, washed in pre-chilled distilled water 3 times for 20 minutes and incubated for 45 minutes in pre-chilled alkaline electrophoresis buffer (50 mM NaOH, 1 mM EDTA, 1 % DMSO, pH 12.8). After electrophoresis for 25 minutes at 25 volts, slides were placed at 4°C over-night, in the dark. The following day, slides were neutralized with 0.4 M Tris-HCl pH 7.0 for 1 hour and stained with SYBR Gold (Invitrogen, diluted 1:10,000 in distilled water) for 30 minutes. Comet tail moments (defined as the average distance migrated by the DNA multiplied by the fraction of DNA in the comet tail) were scored using the CellProfiler cell image analysis software. For the OGG1/MUTYH enzyme modified comet assay, 150,000 U2OS cells were seeded in triplicate on 6-well plates. After overnight incubation, cells were treated either with buffer or (S)-crizotinib (5 μM) for 24 h. Cells (1 million/ml) suspended in 1.2 % low melting agarose were layered over the first layer of a 1% agarose gel on a frosted slide. Slides were then stored at 4°C overnight in lysis buffer containing 100 mM sodium EDTA, 2.5 M NaCl, 10 mM Tris-HCl (pH 10), 1% Triton X-100 and 10% DMSO. After incubation, slides were washed 2×15 min each with enzyme buffer (40 mM HEPES, 0.1 M KCl, 0.5 mM EDTA and 0.2 mg/ml BSA, pH 8 adjusted with KOH). OGG1 or MUTYH in enzyme buffer were added on top and slides were incubated at 37°C for 45 min. After incubation, alkaline denaturation with alkali buffer (300 mM NaOH, 1 mM sodium EDTA) was done in an electrophoresis chamber for 20 min. Electrophoresis was then conducted at 25 V and 300 mA in the same buffer for 30 min. Slides were later neutralised with neutralising buffer [250 mM Tris–HCl (pH 7.5)] for at least 30 min, and then stained with 20 μM YOYO-1 dye. Images were acquired with a confocal microscope and analysed using comet score software.
Indirect immunofluorescence
Cells were treated with compounds for 3 days, following which they were adhered to glass coverslips, washed with PBS and then fixed with 3% paraformaldehyde in PBS for 20 minutes. Fixed cells were rinsed with PBS and permeabilised with 0.5% Triton-X-100 for 5 minutes. PBS washed slides were incubated for 1 hour with 10 % FCS and 0.1% Triton-X-100 in PBS following which cells were stained with an anti-53BP1 monoclonal antibody (H-300, Santa Cruz, diluted 1:600), in combination with an 8-oxoguanine antibody (2Q2311, AbCam, diluted 1:400), where indicated, in 10 % FCS and 0.1% Triton-X-100 in PBS. After rinsing with PBS coverslips were incubated with an Alexa fluor® 568 goat anti-rabbit IgG secondary antibody in combination with an Alexa fluor® 488 anti-mouse IgM secondary antibody, where indicated, for 1 hour (Invitrogen, diluted 1:400) in 10 % FCS and 0.1% Triton-X-100 in PBS. After a PBS wash, DNA was counterstained with DAPI (Sigma-Aldrich) for 10 minutes and the coverslips were mounted in Fluorescent Mounting Medium (Dako). Images were analysed with a Zeiss fluorescent microscope at 63 times magnification with supporting software.
Xenograft study
All animals were acclimatised for one week, and had free access to water and food during the experiment. Animals were under a 12-hour light cycle, and temperature, humidity and housing according to laboratory animal guidelines and regulations. The group size was based on previous experience on variability of tumour growth within control groups. Animals were grouped based on body weight, exclusion/inclusion criteria were pre-established in the ethical permit, and outliers in body weight were excluded. When assessing tumour volume, the experimenter was blinded. Tumour volume and body weight were analyzed using two-way ANOVA (GraphPad Prism 4.0, GraphPad Software Inc.) and pairwise Bonferroni comparisons between groups, using a general linear model with repeat measures with experimental groups (treatment, control) as between factors and day as within-subject factor. Sidak’s post hoc test was used for further analysis of significant interactions.
SCID mice (female, 5-6 weeks, Scanbur, Germany, n = 8/group) were s.c. injected with 1×10⁶ SW480 cells together with a matrix gel (1:1) in the sacral area. Treatment was initiated one day after cell inoculation. Vehicle or MTH1 inhibitor was administered subcutaneously once daily at 25mg/kg for 35 days. MTH1 inhibitor was diluted in 1% DMSO, 10% ethanol, 10% cremaphore, 10% Tween 80, 69% PBS. Tumour size was measured twice weekly and body weight once weekly. At termination, a gross postmortem inspection was performed; blood was collected for haematological parameters and ASAT, ALAT, creatinine measurements. For oral dosing, SCID mice (female, 5-6 weeks, Scanbur, Germany, (S)-crizotinib group, n = 8; (R)-crizotinib group, n = 7; control group, n=8) were s.c. injected with 1×10⁶ SW480 cells together with Matrigel (1:1) in the sacral area and two days later treatment was initiated. Vehicle, (S)-crizotinib or (R)-crizotinib were administered by oral gavage once daily for 26 days. The compounds were diluted in sterile water. Tumour size was measured twice weekly (calculated as length × width × width × 0.52). The mice were weighed at least once weekly. At termination, a gross postmortem inspection was performed. All experiments involving animals followed protocols approved by Stockholms Norra djurförsöksetiska nämnd (laboratory animal ethical committee Stockholm) and were in compliance with 2010/63/EU directive.
Statistical analysis
Unless stated otherwise, a normal distribution of data was assumed and appropriate test were applied.
Extended Data
Extended Data Figure 1. Confirmation of MTH1 as the main cellular target of SCH51344.
a, Immunoblot showing a dose-dependent competition between MTH1 and free SCH51344 for the affinity probe (n = 1/condition). b, Isothermal titration calorimetry results for SCH51344. Data were measured at 15°C in 50 mM Tris-HCl pH 7.8, 150 mM NaCl. Error given in the table represent the error of the nonlinear least squares fit to the experimental data (n = 1). c, Stable knock-down of MTH1 by shRNA reduces SW480 cell viability in a colony formation assay. Data are shown as mean ± SEM and are based on three independent experiments (n = 3). Asterisks indicate significance by one-way ANOVA, ns, not significant. d, MTH1 overexpression decreases SW480 sensitivity toward SCH51344 as reflected by a shift in IC50 value (left). Data are shown as mean ± SEM and are based on three independent experiments (n = 3). Similarly, MTH1 overexpression partially restores SW480 proliferation as compared to empty vector at a sub-lethal dose of SCH51344 (right). Notably, the overall proliferation rate is comparable for empty vector- and pBabe-MTH1-transduced cells. Bottom asterisks indicate significance between SCH51344-treated empty vector- and pBabe-MTH1 cells as calculated by two-way ANOVA, DMSO-treated empty vector versus DMSO-treated pBabe-MTH1 is not significant except for the last data point. Data are shown as mean ± SEM and are based on three independent experiments (n = 3).
Extended Data Figure 2. (S)-Crizotinib target specificity.
a, Isothermal titration calorimetry results for both crizotinib enantiomers. Data were measured at 15°C in 50 mM Tris-HCl pH 7.8, 150 mM NaCl. *Error given in the table represent the error of the nonlinear least squares fit to the experimental data (n = 1). b, Kd binding constants of both crizotinib enantiomers for the (R)-crizotinib cognate targets ALK, MET, and ROS1. Data are shown as mean ± SEM (n = 2). c, Pharmacologic c-MET kinase inhibition by a highly potent inhibitor (JNJ-38877605, MET IC50 = 4 nM) does not suppress growth of KRAS-mutated SW480 cells in contrast to the MTH1 inhibitors SCH51344 and (S)-crizotinib. Images are representative of three independent experiments (n = 3). d, MTH1 overexpression does not alter SW480 sensitivity toward (S)-crizotinib. Data are shown as mean ± SEM and are based on three independent experiments (n = 3). e, (S)-Crizotinib target specificity analysis. Comparison of the probability of true interaction (SAINT) versus the magnitude of spectral count reduction upon competition with the free compound. MTH1 is clearly the only significant target identified by chemoproteomics as further supported by a high spectral count (disc diameter) and very low frequency of appearance in AP-MS negative control experiments found in the CRAPome database (colour code). f, In contrast, analysis of (R)-crizotinib targets reveals a large number of kinases as specific interactors of the clinical enantiomer. Data shown in panels e and f are based on two independent experiments for each condition (n = 2/condition), and each replicate was analysed in two technical replicates.
Extended Data Figure 3. KINOMEscan results for both crizotinib enantiomers.
Screening of both (R)- and (S)-crizotinib against a panel of 456 recombinant human protein kinases indicates a dramatic difference in the ability of the two enantiomers to bind kinases. (R)-crizotinib has high affinity toward a large number of kinases including its cognate targets MET, ALK, and ROS1. Selectivity Score or S-score is a quantitative measure of compound selectivity. It is calculated by dividing the number of kinases that compounds bind to by the total number of distinct kinases tested, excluding mutant variants. S(35) = (number of non-mutant kinases with %Ctrl <35)/(number of non-mutant kinases tested).
Extended Data Figure 4. Co-crystal structures of (S)- and (R)-crizotinib bound to MTH1.
a, MTH1 crystal structure overview with (S)-crizotinib. (S)-Crizotinib is shown in cyan, MTH1 is in pink with light green alpha-helices and the loops covering the binding site in blue. b, as a with a molecular surface shown covering MTH1 apart from the binding site loops. c, MTH1 crystal structures with (R)- and (S)-crizotinib showing 2Fo-Fc electron density maps contoured at 1σ. (R)-Crizotinib is shown in yellow, MTH1 is in pink with light green alpha-helices and the loops covering the binding site in blue. d, as c except with (S)-crizotinib shown in cyan.
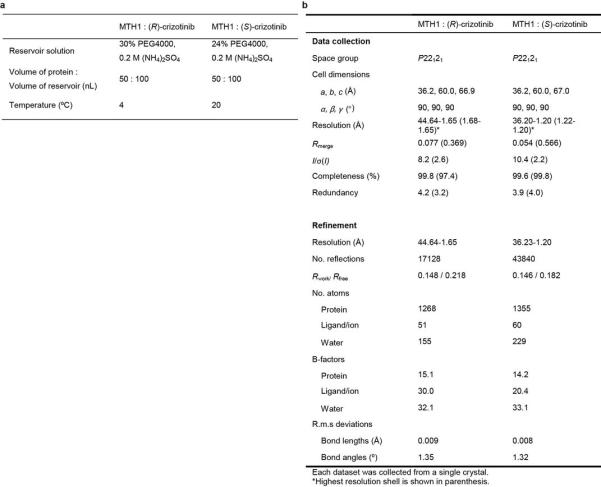
Extended Data Figure 5. Data collection and refinement statistics.
a, Crystallization of MTH1 complexes. b, Data collection and refinement statistics.
Extended Data Figure 6. MTH1 suppression by siRNA or small molecule inhibitors induces DNA damage.
a, Quantification of 53BP1 foci formation in SW480 cells upon MTH1 inhibitor treatment. Concentrations are 5 μM for SCH51344 and 2 μM for each crizotinib enantiomer. Data are shown as mean ± SD (n = 3). Asterisks indicate significance by two-way ANOVA, ns, not significant. b, In line with results obtained for the MTH1 inhibitors SCH51344 and (S)-crizotinib, transient knock-down of MTH1 also induces formation of 53BP1 foci in SW480 cells. Images are representative and data are shown as mean ± SD based on three independent experiments (n = 3) (P < 0.05, t-test). c, Formation of 53BP1 foci correlates with increased 8-oxoguanine staining in SW480 cells treated with the MTH1 inhibitors SCH51344 and (S)-, but not (R)-crizotinib. Images are representative of three independent experiments (n = 3). d, Modified OGG1-MUTYH comet assay. Treatment of U2OS cells with the MTH1 inhibitor (S)-crizotinib (5 μM) induces formation of DNA single strand breaks due to activation of endogenous base excision repair. Addition of the 8-oxoguanine- and 2-hydroxy-adenine-specific DNA glycosylases OGG1 and MUTYH leads to an increase in the mean tail moment (MTM) due to increased DNA cleavage at lesion sites. Data are shown as mean ± SEM of three independent experiments (n = 3). e, The occurrence of DNA single strand breaks induced by the MTH1 inhibitors SCH51344 and (S)-crizotinib is significantly decreased in SW480 cells overexpressing human MTH1 as compared to empty vector transfected cells. Concentrations used are as in c. Numbers depict MTM ± SD, statistical significance was determined using the Holm-Sidak method (p < 0.05) (n = 2).
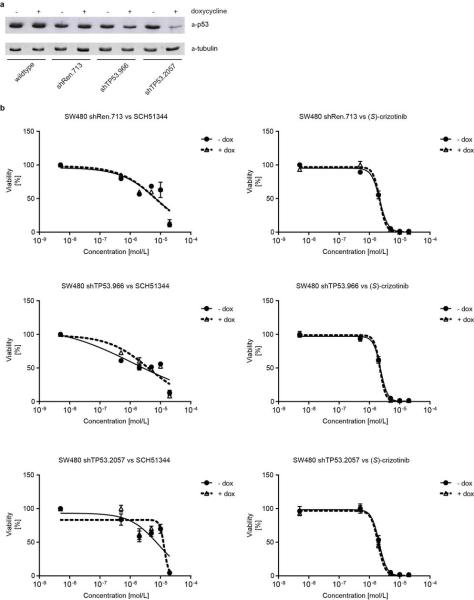
Extended Data Figure 7. MTH1 inhibitor efficacy is not affected by loss of p53.
a, Western blot evaluation of p53-shRNA knock-down efficiency. b, Viability curves from colony formation assays of SW480 cells expressing inducible non-targeting (shRen.713), or targeting anti-p53 shRNAs. Cells were cultured for two days either with or without doxycycline, plated in triplicate in 6-well plates, and drugs added 24 h later. Colonies were stained with crystal violet and quantified using UV absorbance after dye solubilisation with ethanol. Data are shown as mean ± SEM and are based on three independent experiments (n = 3).
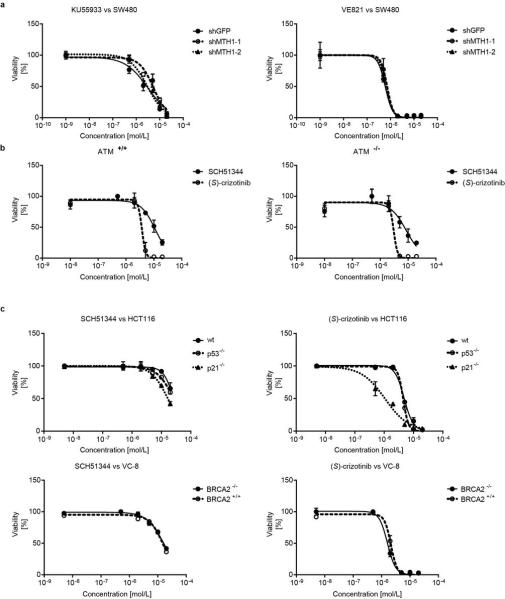
Extended Data Figure 8. Interplay of MTH1 activity and DNA damage proteins.
a, Stable knock-down of MTH1 does not alter SW480 sensitivity toward ATM (KU55933) or ATR (VE821) kinase inhibition. Data are shown as mean ± SEM and are based on three independent experiments (n = 3). b, Conversely, ATM status does not affect MTH1 inhibitor efficacy in immortalised MEFs. Data are shown as mean ± SEM and are based on three independent experiments (n = 3). c, As observed for SW480, loss of p53 does not impair the sensitivity of KRAS-mutant HCT116 toward MTH1 inhibitors, however, p21−/− cells are more sensitive, in particular to the more potent MTH1 inhibitor (S)-crizotinib (top). Data are shown as mean ± SEM and are based on three independent experiments (n = 3). Similarly, BRCA2 function does not alter MTH1 inhibitor sensitivity of VC-8 cells (bottom). Data are shown as mean ± SEM and are based on three independent experiments (n = 3).
Extended Data Figure 9. MTH1 inhibitors exert selective toxicity toward transformed cells.
a, BJ cells transformed by KRASV12 or SV40T are more sensitive to the MTH1 inhibitors SCH51344 and (S)-crizotinib than wild type fibroblasts or cells immortalized by telomerase expression. Data are shown as mean ± SEM for three independent experiments (n = 3). b, (S)-Crizotinib does not exhibit any increased unspecific cytotoxicity compared to (R)-crizotinib. In contrast, the (R)-enantiomer significantly impairs the growth of untransformed BJ skin fibroblasts at low micromolar concentrations in a colony formation assay. Compounds were added 24 h after seeding the cells and plates were incubated for 10 days, washed, fixed, and stained with crystal violet. Images are representative of two independent experiments (n = 2). c, IC50 values for MTH1 inhibitors tested against a cancer cell line panel.
Extended Data Figure 10. Xenograft supplementary data and Oncomine MTH1 meta-analysis.
a, Mouse haematology and liver/heart/kidney parameters comparing treatment versus controls. SCID mice (n = 8/group) were subcutaneously administered vehicle or (S)-crizotinib (25mg/kg) for 35 days. Blood samples were obtained by orbital bleeding (under anaesthesia), blood parameters were analysed using whole blood and ASAT, ALAT and creatinine were analysed in EDTA collected plasma by the Karolinska Universitetslaboratoriet, Clinical Chemistry. The mean values of white blood cells (WBC), red blood cells (RBC), neutrophils, lymphocytes, monocytes, mean corpuscular volume (MCV), mean cell haemoglobin (MCH), mean cell haemoglobin concentration (MCHC) from the different groups are presented in the table. The results did not show any significant differences between control and treated groups apart from a minor change in MCHC. b, Effect of (R)-crizotinib (50mg/kg p.o., q.d.), (S)-crizotinib (50mg/kg p.o., q.d.) or vehicle on tumour volume at day 26 in SW480 xenograft mice. Individual data is shown, n = 7-8 animals/group. Statistical analysis performed by 2-way repeat measurement ANOVA, followed by Sidak’s multiple comparison. c, Effect of treatment on body weight. Data show mean ± SEM. d, Meta-analysis of Oncomine data. MTH1 expression strongly correlates with upregulated RAS which is also reflected by the fact that cancers with high prevalence of RAS mutations such as lung and colon carcinoma express higher levels of MTH1 than other unrelated cancer types.
Supplementary Material
Acknowledgements
The team at CeMM was supported by the Austrian Academy of Sciences, the GEN-AU initiative of the Austrian Federal Ministry for Science and Research, and “ASSET”, a project funded by the European Union within FP7. SK, ES and JE are grateful for financial support from the SGC, a registered charity (number 1097737) that receives funds from the Canadian Institutes for Health Research, the Canada Foundation for Innovation, Genome Canada, GlaxoSmithKline, Pfizer, Eli Lilly, Takeda, AbbVie, the Novartis Research Foundation, Boehringer Ingelheim, the Ontario Ministry of Research and Innovation and the Wellcome Trust (Grant No. 092809/Z/10/Z). ES was supported by the European Union FP7 Grant No. 278568 “PRIMES”. TH was supported by the Torsten and Ragnar Söderberg Foundation, the Knut and Alice Wallenberg Foundation, the Swedish Research Council, the European Research Council and the Swedish Cancer Society. We are grateful to Daniel Treiber, Jeremy Hunt, Paul Gallant, and Gabriel Pallares of DiscoveRx Corporation for the KdELECT and scanMAX studies. We thank Wolfgang Lindner and Norbert Maier for chiral HPLC analyses, Roman Lichtenecker for NMR measurements, André C. Müller for the annotation of the MSMS spectrum, Marc Brehme for help with the figures. We are very grateful to the following colleagues for the respective reagents: Scott Lowe for the miR30 vectors, pMLP-p53; Robert Weinberg for pLKO.1 shMTH1, and pBABE-puro, plasmids; Walter Berger for SW480, DLD1, SW620 cells; Rudolf Oehler for PANC1; William Hahn and Annica Gad for BJ-hTERT, BJ-hTERT-SV40T, BJ-hTERT-SV40T-KRASV12 cells, Bert Vogelstein for HCT116 p53−/− and p21−/−; Christoph Gasche for LoVo and HCT15 cells; Andre Nussenzweig for ATM wild-type and ATM−/− MEFs.
Footnotes
Atomic coordinates for MTH1 in complex with (R)- and (S)-crizotinib have been deposited at the Protein Data Bank under the accession codes 4c9w ((R)-crizotinib), and 4c9× ((S)-crizotinib), respectively. The confident drug-protein interactions dataset was submitted to IntAct and is pending review by IntAct curators. Reprints and permissions information is available at www.nature.com/reprints. A patent has been filed with data generated in this manuscript where K.H. and G.S.-F. are listed as inventors.
References
- 1.Pylayeva-Gupta Y, Grabocka E, Bar-Sagi D. RAS oncogenes: weaving a tumorigenic web. Nat Rev Cancer. 2011;11:761–774. doi: 10.1038/nrc3106. [DOI] [PMC free article] [PubMed] [Google Scholar]
- 2.Parada LF, Tabin CJ, Shih C, Weinberg RA. Human EJ bladder carcinoma oncogene is homologue of Harvey sarcoma virus ras gene. Nature. 1982;297:474–478. doi: 10.1038/297474a0. [DOI] [PubMed] [Google Scholar]
- 3.Der CJ, Krontiris TG, Cooper GM. Transforming genes of human bladder and lung carcinoma cell lines are homologous to the ras genes of Harvey and Kirsten sarcoma viruses. Proceedings of the National Academy of Sciences of the United States of America. 1982;79:3637–3640. doi: 10.1073/pnas.79.11.3637. [DOI] [PMC free article] [PubMed] [Google Scholar]
- 4.Dekker FJ, et al. Small-molecule inhibition of APT1 affects Ras localization and signaling. Nat Chem Biol. 2010;6:449–456. doi: 10.1038/nchembio.362. [DOI] [PubMed] [Google Scholar]
- 5.Xu J, et al. Inhibiting the palmitoylation/depalmitoylation cycle selectively reduces the growth of hematopoietic cells expressing oncogenic Nras. Blood. 2012;119:1032–1035. doi: 10.1182/blood-2011-06-358960. [DOI] [PMC free article] [PubMed] [Google Scholar]
- 6.Zimmermann G, et al. Small molecule inhibition of the KRAS-PDE[dgr] interaction impairs oncogenic KRAS signalling. Nature. 2013;497:638–642. doi: 10.1038/nature12205. [DOI] [PubMed] [Google Scholar]
- 7.Yagoda N, et al. RAS-RAF-MEK-dependent oxidative cell death involving voltage-dependent anion channels. Nature. 2007;447:865–868. doi: 10.1038/nature05859. [DOI] [PMC free article] [PubMed] [Google Scholar]
- 8.Kumar CC, et al. SCH 51344 Inhibits ras Transformation by a Novel Mechanism. Cancer Research. 1995;55:5106–5117. [PubMed] [Google Scholar]
- 9.Walsh AB, Dhanasekaran M, Bar-Sagi D, Kumar CC. SCH 51344-induced reversal of RAS-transformation is accompanied by the specific inhibition of the RAS and RAC-dependent cell morphology pathway. Oncogene. 1997;15:2553–2560. doi: 10.1038/sj.onc.1201424. [DOI] [PubMed] [Google Scholar]
- 10.Rai P, et al. Enhanced elimination of oxidized guanine nucleotides inhibits oncogenic RAS-induced DNA damage and premature senescence. Oncogene. 2011;30:1489–1496. doi: 10.1038/onc.2010.520. [DOI] [PubMed] [Google Scholar]
- 11.Barbie DA, et al. Systematic RNA interference reveals that oncogenic KRAS-driven cancers require TBK1. Nature. 2009;462:108–112. doi: 10.1038/nature08460. [DOI] [PMC free article] [PubMed] [Google Scholar]
- 12.Fujikawa K, et al. The Oxidized Forms of dATP Are Substrates for the Human MutT Homologue, the hMTH1 Protein. Journal of Biological Chemistry. 1999;274:18201–18205. doi: 10.1074/jbc.274.26.18201. [DOI] [PubMed] [Google Scholar]
- 13.Oka S, et al. Two distinct pathways of cell death triggered by oxidative damage to nuclear and mitochondrial DNAs. EMBO J. 2008;27:421–432. doi: 10.1038/sj.emboj.7601975. [DOI] [PMC free article] [PubMed] [Google Scholar]
- 14.Yoshimura D, et al. An Oxidized Purine Nucleoside Triphosphatase, MTH1, Suppresses Cell Death Caused by Oxidative Stress. Journal of Biological Chemistry. 2003;278:37965–37973. doi: 10.1074/jbc.M306201200. [DOI] [PubMed] [Google Scholar]
- 15.Svensson LM, et al. Crystal structure of human MTH1 and the 8-oxo-dGMP product complex. FEBS Letters. 2011;585:2617–2621. doi: 10.1016/j.febslet.2011.07.017. [DOI] [PubMed] [Google Scholar]
- 16.Rai P, et al. Continuous elimination of oxidized nucleotides is necessary to prevent rapid onset of cellular senescence. Proceedings of the National Academy of Sciences of the United States of America. 2009;106:169–174. doi: 10.1073/pnas.0809834106. [DOI] [PMC free article] [PubMed] [Google Scholar]
- 17.Fedorov O, et al. Specific CLK Inhibitors from a Novel Chemotype for Regulation of Alternative Splicing. Chemistry and Biology. 2011;18:67–76. doi: 10.1016/j.chembiol.2010.11.009. [DOI] [PMC free article] [PubMed] [Google Scholar]
- 18.Cui JJ, et al. Structure Based Drug Design of Crizotinib (PF-02341066), a Potent and Selective Dual Inhibitor of Mesenchymal-Epithelial Transition Factor (c-MET) Kinase and Anaplastic Lymphoma Kinase (ALK) Journal of Medicinal Chemistry. 2011;54:6342–6363. doi: 10.1021/jm2007613. [DOI] [PubMed] [Google Scholar]
- 19.Zou HY, et al. An Orally Available Small-Molecule Inhibitor of c-Met, PF-2341066, Exhibits Cytoreductive Antitumor Efficacy through Antiproliferative and Antiangiogenic Mechanisms. Cancer Research. 2007;67:4408–4417. doi: 10.1158/0008-5472.CAN-06-4443. [DOI] [PubMed] [Google Scholar]
- 20.Camidge DR, et al. Activity and safety of crizotinib in patients with ALK-positive non-small-cell lung cancer: updated results from a phase 1 study. The Lancet Oncology. 2012;13:1011–1019. doi: 10.1016/S1470-2045(12)70344-3. [DOI] [PMC free article] [PubMed] [Google Scholar]
- 21.Kwak EL, et al. Anaplastic Lymphoma Kinase Inhibition in Non-Small-Cell Lung Cancer. New England Journal of Medicine. 2010;363:1693–1703. doi: 10.1056/NEJMoa1006448. [DOI] [PMC free article] [PubMed] [Google Scholar]
- 22.Gerber DE, Minna JD. ALK Inhibition for Non-Small Cell Lung Cancer: From Discovery to Therapy in Record Time. Cancer Cell. 2010;18:548–551. doi: 10.1016/j.ccr.2010.11.033. [DOI] [PMC free article] [PubMed] [Google Scholar]
- 23.Butrynski JE, et al. Crizotinib in ALK-Rearranged Inflammatory Myofibroblastic Tumor. New England Journal of Medicine. 2010;363:1727–1733. doi: 10.1056/NEJMoa1007056. [DOI] [PMC free article] [PubMed] [Google Scholar]
- 24.Martinez Molina D, et al. Monitoring Drug Target Engagement in Cells and Tissues Using the Cellular Thermal Shift Assay. Science. 2013;341:84–87. doi: 10.1126/science.1233606. [DOI] [PubMed] [Google Scholar]
- 25.Fabian MA, et al. A small molecule-kinase interaction map for clinical kinase inhibitors. Nat Biotechnol. 2005;23:329–336. doi: 10.1038/nbt1068. [DOI] [PubMed] [Google Scholar]
- 26.Zuber J, et al. An integrated approach to dissecting oncogene addiction implicates a Myb-coordinated self-renewal program as essential for leukemia maintenance. Genes and Development. 2011;25:1628–1640. doi: 10.1101/gad.17269211. [DOI] [PMC free article] [PubMed] [Google Scholar]
- 27.Sakumi K, et al. Ogg1 Knockout-associated Lung Tumorigenesis and Its Suppression by Mth1 Gene Disruption. Cancer Research. 2003;63:902–905. [PubMed] [Google Scholar]
- 28.Speina E, et al. Contribution of hMTH1 to the Maintenance of 8-Oxoguanine Levels in Lung DNA of Non-Small-Cell Lung Cancer Patients. Journal of the National Cancer Institute. 2005;97:384–395. doi: 10.1093/jnci/dji058. [DOI] [PubMed] [Google Scholar]
- 29.Kennedy CH, Cueto R, Belinsky SA, Lechner JF, Pryor WA. Overexpression of hMTH1 mRNA: a molecular marker of oxidative stress in lung cancer cells. FEBS Letters. 1998;429:17–20. doi: 10.1016/s0014-5793(98)00505-5. [DOI] [PubMed] [Google Scholar]
- 30.Okamoto K, et al. Overexpression of human mutT homologue gene messenger RNA in renal-cell carcinoma: evidence of persistent oxidative stress in cancer. Int J Cancer. 1996;65:437–441. doi: 10.1002/(SICI)1097-0215(19960208)65:4<437::AID-IJC7>3.0.CO;2-Y. [DOI] [PubMed] [Google Scholar]
- 31.Tsuzuki T, et al. Spontaneous tumorigenesis in mice defective in the MTH1 gene encoding 8-oxo-dGTPase. Proceedings of the National Academy of Sciences of the United States of America. 2001;98:11456–11461. doi: 10.1073/pnas.191086798. [DOI] [PMC free article] [PubMed] [Google Scholar]
- 32.Hutt AJ. Chirality and pharmacokinetics: an area of neglected dimensionality? Drug Metabol. Drug Interact. 2007;22:79–112. doi: 10.1515/dmdi.2007.22.2-3.79. [DOI] [PubMed] [Google Scholar]
- 33.Aksoy O, et al. The atypical E2F family member E2F7 couples the p53 and RB pathways during cellular senescence. Genes and Development. 2012;26:1546–1557. doi: 10.1101/gad.196238.112. [DOI] [PMC free article] [PubMed] [Google Scholar]
Associated Data
This section collects any data citations, data availability statements, or supplementary materials included in this article.


