

Abstract
Aims
We sought to evaluate the impact of coronary artery calcium (CAC) in individuals at the extremes of risk factor (RF) burden.
Methods and results
6698 individuals from the Multi-Ethnic Study of Atherosclerosis (MESA) were followed for coronary heart disease (CHD) events over mean 7.1 ± 1 years. Annualized CHD event rates were compared among each RF category (0, 1, 2, or ≥3) after stratification by CAC score (0, 1–100, 101–300, and >300). The following traditional modifiable RFs were considered: cigarette smoking, LDL cholesterol ≥3.4 mmol/L, low HDL cholesterol, hypertension, and diabetes. There were 1067 subjects (16%) with 0 RFs, whereas 1205 (18%) had ≥3 RFs. Among individuals with 0 RFs, 68% had CAC 0, whereas 12 and 5% had CAC >100 and >300, respectively. Among individuals with ≥3 RFs, 35% had CAC 0, whereas 34 and 19% had CAC >100 and >300, respectively. Overall, 339 (5.1%) CHD events occurred. Individuals with 0 RFs and CAC >300 had an event rate 3.5 times higher than individuals with ≥3 RFs and CAC 0 (10.9/1000 vs. 3.1/1000 person-years). Similar results were seen across categories of Framingham risk score.
Conclusion
Among individuals at the extremes of RF burden, the distribution of CAC is heterogeneous. The presence of a high CAC burden, even among individuals without RFs, is associated with an elevated event rate, whereas the absence of CAC, even among those with many RF, is associated with a low event rate. Coronary artery calcium has the potential to further risk stratify asymptomatic individuals at the extremes of RF burden.
Keywords: Coronary artery calcium, Risk factors, Coronary heart disease
Introduction
Cardiovascular risk assessment among asymptomatic individuals has traditionally been based on the presence or absence of risk factors (RFs). For example, the National Cholesterol Education Program Adult Treatment Panel III (NCEP ATP III) cholesterol-lowering guidelines recommend that individuals without a coronary heart disease (CHD) risk equivalent have an initial risk assessment based on number of RFs present.1 Using these tools, patients who have no RFs are categorically considered low risk, while those with many RFs are nearly always considered high risk. Despite the widespread use of RF-based assessments, most individuals are not recognized as high risk prior to their first CHD event.2–4
Non-contrast cardiac computed tomography (CT) for the assessment of coronary artery calcium (CAC) provides a non-invasive direct measure of coronary atherosclerosis. Coronary artery calcium scoring has been shown to be an independent predictor of CHD and to enhance traditional RF-based prediction models.5–8 Although the American Heart Association (AHA) and the European Society of Cardiology provide Class IIa recommendations for the use of CAC in asymptomatic adults at intermediate risk,9,10 less attention has been placed on the prognostic value of CAC among individuals at the extremes of RF burden in whom treatment decisions are usually considered unequivocal. The distribution and impact of CAC among individuals outside the intermediate risk category remains unclear. We sought to evaluate the distribution and impact of CAC on CHD events among asymptomatic individuals at the extremes of RF burden from the Multi-Ethnic Study of Atherosclerosis (MESA).
Methods
Study participants
Full details for the MESA study design have been published previously.11 MESA is a prospective observational cohort of 6814 men and women aged 45–84 years without known cardiovascular disease at enrolment. Individuals were enrolled between July 2000 through September 2002 at six different field centres in the USA (Baltimore, Chicago, Forsyth County, North Carolina, Los Angeles, New York, and St. Paul, Minnesota). Participants identified themselves as white, black, Chinese, or Hispanic at the time of enrolment. The study was conducted in accordance with the declaration of Helsinki and was approved by the institutional review board of each site. All participants gave written informed consent.
Risk factors
As part of the baseline examination, staff at each of the six centres collected information about cardiovascular RFs, including current smoking, hypertension, diabetes, and a family history of CHD. A central laboratory (University of Vermont, Burlington, VT, USA) measured levels of total and HDL cholesterol, triglycerides, and plasma glucose after a 12 h fast. Resting blood pressure was measured three times using a Dinamap Pro 1000 automated oscillometric sphygmomanometer (Critikon), with the participant in the seated position. The mean of the last two blood pressure readings was used.
Diabetes was defined as a fasting plasma glucose level >7.0 mmol/L (126 mg/dL) or a history of medical treatment for diabetes. Hypertension was defined by JNC 6 criteria or history of medical treatment for hypertension. High LDL cholesterol (LDL-C) was defined as >3.4 mmol/L and low HDL cholesterol (HDL-C) was defined as <1.0 mmol/L in men and <1.3 mmol/L in women. Smoking was defined as current use of cigarettes.
Family history of CHD was defined as any immediate family member (parents, siblings, and children) with a history of fatal/non-fatal myocardial infarction and/or coronary angioplasty/coronary artery bypass surgery. Family history of premature CHD was defined as above occurring before the age of 55 for male family members or 65 for female family members. Information pertaining to family history of premature CHD was obtained at the second examination and was not available for all participants.
Coronary artery calcium score measurements
Carr et al.12 have reported details of the methods used by MESA for CT scanning and interpretation. Each of the six centres measured CAC with either a cardiac-gated electron-beam CT scanner (Chicago, Los Angeles, New York) or a multidetector CT (Baltimore, Forsyth County, St. Paul). All participants were scanned twice with mean CAC (Agatston) score used for all analyses.13 Estimates of radiation dose determined according to the MESA protocol for a single scan obtained through the heart with the Imatron C150, Volume Zoom, and LightSpeed Pro 16 scanners were as follows: 0.6 and 0.7, 0.9 and 1.1, and 0.9 and 1.1 mSv for men and women, respectively.14 Images were interpreted at the MESA CT reading centre (Los Angeles Biomedical Research Institute at Harbor-University of California Los Angeles, Torrance, CA, USA). The intra- and interobserver agreements were κ = 0.93 and 0.90, respectively. Participants were told either that they had no coronary calcification or that the amount was less than average, average, or greater than average and that they should discuss the results with their physicians.
Follow-up
New occurrences of CHD were recorded over a mean follow-up of 7.1 ± 1 years. At intervals of 9–12 months, an interviewer contacted each participant or family member by telephone to inquire about interim hospital admissions, outpatient diagnoses of CHD and CVD, and deaths. Two physicians from the MESA mortality and morbidity review committee independently classified events. In the event of disagreement, the full committee made the final classification. To verify self-reported diagnoses, MESA obtained medical records for ∼98% of hospital events and 95% of outpatient diagnoses. For out of hospital cardiovascular deaths, next of kin were interviewed, and copies of death certificates were requested.
For the purpose of this study, all CHD events were classified as myocardial infarction, death from CHD, definite angina followed by coronary revascularization, definite angina not followed by coronary revascularization, and probable angina followed by coronary revascularization. Hard CHD events include myocardial infarction, resuscitated cardiac arrest, and CHD death.
The diagnosis of myocardial infarction was based on a combination of symptoms, electrocardiographic findings, and levels of cardiac biomarkers. We used hospital records and family interviews to determine whether deaths were related to CHD. A death was considered related to CHD if it occurred within 28 days after a myocardial infarction, if the participant had had chest pain within the 72 h before death or if the participant had a history of CHD and there was no known non-atherosclerotic, non-cardiac cause of death. In MESA, angina was classified as a symptomatic event generally involving ischaemic chest, left arm, or jaw pain, though the symptoms may be ‘atypical.’ Atypical anginal symptoms can include shortness of breath, exertional dyspnoea, epigastric discomfort, and back pain, in addition to pain that is isolated to the arm or the jaw. The adjudicators graded angina as definite, probable, or absent on the basis of their clinical judgement. A classification of definite or probable angina required clear and definite documentation of symptoms distinct from the diagnosis of myocardial infarction. A classification of definite angina also required objective evidence of reversible myocardial ischaemia or obstructive coronary artery disease.
Statistical analysis
Individuals were categorized by RF burden as having 0, 1, 2, or ≥3 of the following traditional modifiable RFs: current smoking, diabetes, hypertension, low HDL-C, and high LDL-C. Baseline characteristics were analysed according to RF category and in aggregate. Chi-square tests (for discrete variables and proportional frequencies) and analysis of variance tests (for continuous variables) were used to compare characteristics across RF categories. Kaplan–Meier estimates of cumulative event-free survival were used to describe the frequency of CHD events over time. The proportionality assumption for the Cox regression analysis was evaluated graphically using both the log–log plot of survival and by comparison of the Kaplan–Meier and predicted survival plots. This evaluation revealed that the proportionality assumption did hold.
The data were stratified by CAC score with the same cut points as Detrano et al.8 (0, 1–100, 101–300, and >300) across each RF category (0, 1, 2, and ≥3). Log-rank tests were performed to assess for statistically significant difference between curves.
The effect of RF burden was evaluated by calculating annualized absolute CHD event rates (number of events/number of person-years at risk) and Cox multivariable-adjusted hazard ratios (HRs; adjusted for age, gender, race/ethnicity, and MESA site) among each CAC score category (0, 1–100, 101–300, and >300) after stratification by RF burden (0, 1, 2, and ≥3).
To evaluate whether CAC could further risk stratify across varying levels of RF burden, annualized absolute CHD event rates (number of events/number of person-years at risk) and Cox multivariable-adjusted HRs (adjusted for age, gender, race/ethnicity, and MESA site) were compared among each RF category after stratification by CAC score (0, 1–100, 101–300, and >300). A similar analysis was performed comparing annualized absolute CHD event rates among each Framingham risk score15 (FRS) category (0–6, 6–10, 10–20, and >20%) after stratification by CAC score.
To assess whether CAC could further risk stratify across RF burden, when the population was stratified by age, a subgroup analysis was performed with the population separated into two groups: (i) men aged >55 and women aged >65 years and (ii) men aged ≤55 and women aged ≤65 years. Annualized absolute CHD event rates (number of events/number of person-years at risk) were calculated among each RF category after stratification by CAC score.
An additional subgroup analysis was performed looking at individuals with a family history of premature CHD. In this analysis, family history of premature CHD was considered as one of the RFs counted towards the categorization of RF burden (0, 1, 2, and ≥3). Annualized absolute CHD event rates (number of events/number of person-years at risk) were calculated among each RF category after stratification by CAC score.
All analyses were performed using Stata version 11 (StataCorp LP, College Station, TX, USA).
Results
Of the 6814 initial participants, 116 (1.7%) were missing information relating to at least one traditional modifiable RF and were excluded. The final study population consisted of 6698 individuals (mean age 62 ± 10 years, 47% men). Table 1 shows the baseline characteristics of the study cohort by RF burden. There were 1067 subjects (16%) with 0 RFs, whereas 2310 (34%), 2116 (32%), and 1205 (18%) had 1, 2, and ≥3 RFs, respectively. One-third (34%) of individuals had either 0 or ≥3 RFs, thereby falling into the extremes of RF burden. Differences in baseline RFs according to CAC score category are shown in Supplementary material online, Table S1.
Table 1.
Baseline characteristics by risk factor burden
| 0 RF (n = 1067) | 1 RF (n = 2310) | 2 RF (n = 2116) | ≥3 RF (n = 1205) | P-value | |
|---|---|---|---|---|---|
| Age (years) | 58.9 ± 10.1 | 61.8 ± 10.4 | 63.2 ± 10.1 | 64.1 ± 9.6 | 0.039 |
| Female sex (%) | 54.7 | 52.5 | 51.3 | 54.8 | 0.138 |
| Smoking (%) | 0 | 7.1 | 16.3 | 29.4 | <0.001 |
| Family history of heart disease (%) | 35.4 | 40.3 | 46.6 | 47.1 | <0.001 |
| Hypertension (%) | 0 | 31.8 | 61.5 | 80.4 | <0.001 |
| Systolic blood pressure (mmHg) | 113 ± 13 | 124 ± 20 | 131 ± 22 | 135 ± 22 | <0.001 |
| Medication for hypertension (%) | 0 | 26 | 50 | 71 | <0.001 |
| Diabetes (%) | 0 | 1.9 | 10.9 | 46.8 | <0.001 |
| LDL-C (mmol/L) | 2.7 ± 0.5 | 3.0 ± 0.8 | 3.2 ± 0.8 | 3.2 ± 0.9 | <0.001 |
| HDL cholesterol (mmol/L) | 1.6 ± 0.4 | 1.4 ± 0.4 | 1.2 ± 0.3 | 1.1 ± 0.3 | <0.001 |
| Lipid-lowering medication (%) | 0 | 8 | 22 | 37 | <0.001 |
| Body mass index (kg/m2) | 26.1 ± 4.9 | 27.6 ± 5.2 | 29.2 ± 5.5 | 30.3 ± 5.6 | <0.001 |
| Framingham risk score | 5.6 ± 4.3 | 8.4 ± 6.3 | 11.8 ± 8.2 | 17.0 ± 11.2 | <0.05 |
Overall, 50% of the study population had CAC 0, whereas 27% had CAC 1–100, 11% had CAC 101–300, and 12% had CAC >300. The distribution of CAC by RF burden is shown in Figure 1. Although individuals with RFs were less likely to have CAC 0, 35% of individuals with ≥3 RFs had 0 CAC. Conversely, 12% of individuals with 0 RFs had a CAC score of >100, and 5% had a CAC score of >300.
Figure 1.

Distribution of coronary artery calcium by risk factor burden.
A total of 339 (5.1%) all-cause and 204 (3.0%) hard CHD events occurred over a mean follow-up of 7.1 (±1) years. Table 2 shows the frequency of CHD events and corresponding event rates (per 1000 person-years) by both RF burden (A) and CAC score (B): when stratified by CAC score, although 50% of the population had a CAC score = 0, only 13% of all CHD events occurred in this group, whereas 62% of all CHD events occurred in the 23% of subjects with a CAC score of >100, and 40% of all CHD events occurred in the 12% of individuals with a CAC score of >300. Figure 2 shows Kaplan–Meier estimates of CHD event-free survival by CAC score among individuals with 0 and ≥3 RFs. As shown, CHD event-free survival was significantly lower with increasing CAC scores (P < 0.001).
Table 2.
Coronary heart disease events by risk factor burden (A) and coronary artery calcium score (B)
| n (%) | All CHD events (% of total events) | Total CHD event rate (per 1000 person-years) | Hard CHD events (% of total events) | Hard CHD event rate (per 1000 person-years) | |
|---|---|---|---|---|---|
| A | |||||
| 0 RF | 1067 (16%) | 16 (5%) | 2.1 | 11 (5%) | 1.4 |
| 1 RF | 2310 (34%) | 82 (24%) | 5.0 | 50 (25%) | 3.0 |
| 2 RF | 2116 (32%) | 126 (37%) | 8.7 | 83 (41%) | 5.7 |
| ≥3 RF | 1205 (18%) | 115 (34%) | 14.6 | 60 (29%) | 7.4 |
| B | |||||
| CAC 0 | 3349 (50%) | 44 (13%) | 1.8 | 31 (15%) | 1.3 |
| CAC 1–100 | 1774 (27%) | 85 (25%) | 6.9 | 54 (26%) | 4.3 |
| CAC 101–300 | 747 (11%) | 73 (22%) | 14.4 | 46 (23%) | 8.8 |
| CAC >300 | 828 (12%) | 137 (40%) | 26.3 | 73 (36%) | 13.3 |
RFs considered: high LDL-C, low HDL-C, hypertension, diabetes, current cigarette smoking. Coronary heart disease event rates were significantly different by RF burden (P < 0.001). Coronary heart disease event rates were significantly different by CAC score (P < 0.001).
Figure 2.

Kaplan-Meier estimates of coronary heart disease event free survival by coronary artery calcium score in individuals with 0 and ≥3 risk factors.
Figure 3 demonstrates that total (Figure 3A) and hard (Figure 3B) CHD event rates increased with increasing CAC scores at all levels of RF burden. Individuals with no RFs and CAC >300 had an event rate which was 3.5 times higher than the rate observed among individuals with ≥3 RFs and CAC 0 (10.9/1000 vs. 3.1/1000 person-years). Similar results were seen with hard CHD events (8.0/1000 vs. 1.4/1000 person-years). After adjustment for age, individuals with no RFs and CAC >300 had a non-significant two-fold increased risk for all and three-fold increased risk for hard CHD events compared with individuals with ≥3 RFs and CAC = 0 (P = 0.196 and 0.158, respectively). Similar results were noted for event rates among those with no RFs and CAC >100 when compared with those having ≥3 RFs and CAC 0.
Figure 3.
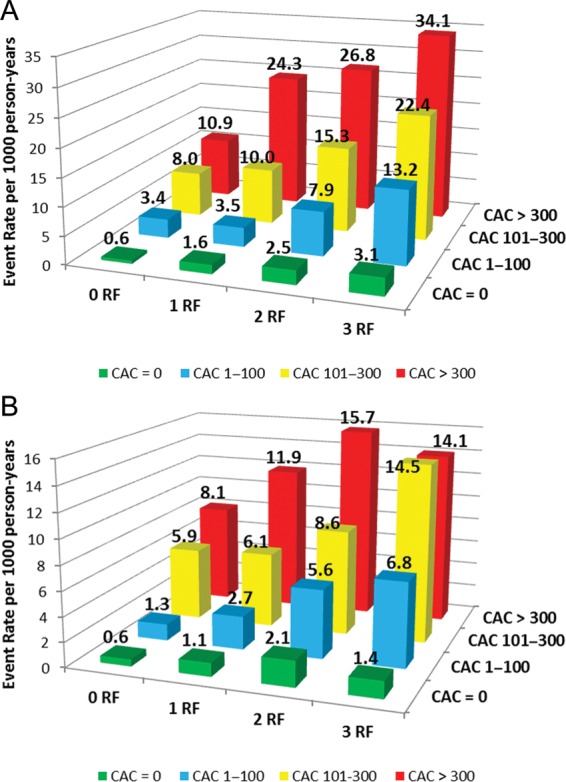
Total (A) and hard (B) coronary heart disease event rates (per 1000 person-years) with increasing coronary artery calcium score according to risk factor burden.
Among the 3348 (50%) study participants with CAC 0, the overall CHD event rate was 1.8/1000 person-years. Although the annualized CHD event rate increased slightly with increasing RF burden (0.6, 1.6, 2.5, and 3.1 per 1000 person-years for 0, 1, 2, and ≥3 RFs, respectively), the absolute event rates remained very low (Figure 3).
Table 3 shows the multivariable-adjusted HRs for CHD events associated with increasing RF burden (A) and CAC score (B). After taking into account age, gender, race/ethnicity, and CAC scores, the HR for CHD events ranged from 1.8- to 3.9-fold with increasing RFs. In comparison, the respective HRs associated with increasing CAC score category compared with those without any CAC were 2.8- to 8.0-fold higher. Similar trends were noted for hard CHD events. Table 4 shows the multivariable-adjusted HRs for CHD events associated with increasing CAC score within each RF category. When RFs and CAC were combined in a multivariable-adjusted model for CHD events (adjusted for age, gender, race, and MESA site), ≥3 RFs and CAC >100 was associated with an HR of 43.0, whereas ≥3 RFs and CAC >300 was associated with an HR of 48.0 when compared with those having 0 RFs and CAC = 0.
Table 3.
Multivariable-adjusted hazard ratios for coronary heart disease events associated with increasing risk factor burden (A) and coronary artery calcium score (B)
| All CHD events | Hard CHD events | |
|---|---|---|
| HRa (95% CI) | HRa (95% CI) | |
| A | ||
| 0 RF | Reference | Reference |
| 1 RF | 1.8 (1.1–3.1) | 1.6 (0.8–3.0) |
| 2 RF | 2.6 (1.6–4.5) | 2.5 (1.3–4.7) |
| ≥3 RF | 3.9 (2.3–6.7) | 2.9 (1.5–5.5) |
| B | ||
| CAC 0 | Reference | Reference |
| CAC 1–100 | 2.8 (1.9–4.1) | 2.4 (1.5–3.8) |
| CAC 101–300 | 5.1 (3.4–7.6) | 4.2 (2.6–6.9) |
| CAC >300 | 8.0 (5.4–11.7) | 5.3 (3.3–8.5) |
Hazard Ratios with 95% confidence interval (CI).
aAdjusted for age, gender, race/ethnicity, MESA site, and CAC score category.
bAdjusted for age, gender, race/ethnicity, MESA site, and RF burden.
Table 4.
Multivariable-adjusteda hazard ratios for coronary heart disease events associated with increasing coronary artery calcium score according to risk factor strata
| 0 RF | 1 RF | 2 RF | ≥3 RF | |
|---|---|---|---|---|
| HR (95% CI) | HR (95% CI) | HR (95% CI) | HR (95% CI) | |
| CAC 0 | Reference | Reference | Reference | Reference |
| CAC 1–100 | 3.6 (0.8–15.9) | 1.9 (0.9–4.0) | 2.5 (1.4–4.5) | 3.8 (1.8–8.0) |
| CAC 101–300 | 5.5 (1.0–29.9) | 5.1 (2.3–10.9) | 4.3 (2.2–8.3) | 5.9 (2.7–12.8) |
| CAC >300 | 6.8 (1.2–40.0) | 11.2 (5.5–22.8) | 6.7 (3.6–12.4) | 7.9 (3.7–16.8) |
Hazard Ratios with 95% confidence interval (CI).
aAdjusted for age, gender, race/ethnicity, and MESA site.
In addition to further risk stratification at the extremes of RF burden, CAC was able to further risk stratify individuals at the extremes of estimated risk calculated by the FRS. Low-risk individuals (FRS 0–6%) with a CAC score of >300 had a total CHD event rate of 20.5/1000 person-years (Figure 4A), with a corresponding hard event rate of 13.2/1000 person-years (Figure 4B). Conversely, high-risk individuals (FRS >20%) with CAC 0 had an event rate of 2.5/1000 person-years.
Figure 4.
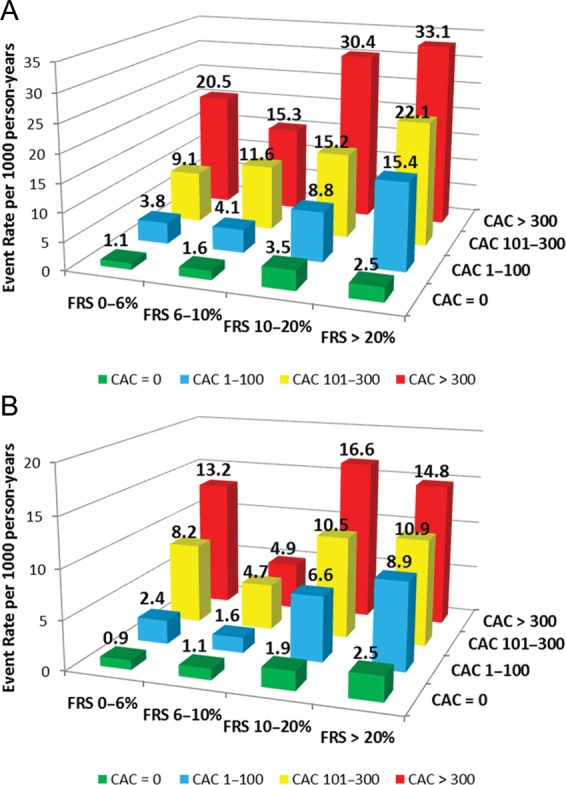
Total (A) and hard (B) coronary heart disease event rates (per 1000 person-years) with increasing coronary artery calcium scores according to Framingham risk score category.
In a subgroup analysis with the population stratified by age, the presence of CAC was associated with increasing event rates across the RF spectrum. Among men aged ≤55 and women aged ≤65 years, there was only 1 event in the 0 RF group as a whole, and therefore event rates were low at all levels of CAC among individuals with 0 RF. However, for the remaining RF categories, increasing CAC was associated with an increase in CHD events (Supplementary material online, Figure S1A). For the group with men aged >55 and women aged >65, CAC was able to further risk stratify at all levels of RF burden, including those with 0 RF (Supplementary material online, Figure S1B).
There were 5258 individuals with information pertaining to family history of premature CHD. Overall, 1032 participants (19%) had a family history of premature CHD. With family history of premature CHD included as an RF, the prevalence of RFs was as follows: 0 RF = 14%, 1 RF = 31%, 2 RF = 32%, and ≥3 RF = 23%. Similar to the main analysis, when family history of premature CHD was included as an RF, increasing CAC was associated with higher event rates at all levels of RF burden (Supplementary material online, Figure S2).
Discussion
In this multi-ethnic cohort, we demonstrate that although individuals with increasing RFs are more likely to have CAC as well as have a higher burden of CAC, large heterogeneity exists. Nearly one-third of individuals with ≥3 RF had no detectable CAC, whereas >10% of individuals with no RFs had CAC >100, with 7% having CAC 101–300 and 5% having CAC >300. Our data suggest that the presence of CAC is associated with increased CHD events (all and hard) across all levels of RF burden, even among individuals with no RFs. In contrast, among the 50% of the population with CAC 0, although RFs are associated with higher relative risk, the absolute risk of a CHD event over mean 7.1 years of follow-up in this group remains low (0.6, 1.6, 2.5, and 3.1 per 1000 person-years for individuals with 0, 1, 2, and ≥3 RFs, respectively). Similar results were noted when CHD events were assessed by CAC score group across the combined global risk score (FRS) categories that had incorporated age and gender along with these traditional RFs.
The results from our study are consistent with prior analyses demonstrating the heterogeneity of atherosclerosis in individuals at the extremes of traditional risk classification. Michos et al.16 found that 29% of asymptomatic women with an FRS ≤5% had significant CAC and almost 10% had CAC >100. Similarly, Greenland et al.6 showed that among low-risk individuals (FRS 0–9%) 34% had CAC >100 and 19% had CAC >300. Additionally, Maffei et al.17 demonstrated the heterogeneity of atherosclerosis across RF burden using cardiac CT angiography to identify ‘outliers’ defined as individuals with multiple RFs and ‘normal coronaries’ as well as individuals with 0 RFs and significant atherosclerosis burden.
Our results parallel an exploratory analysis performed by Nasir et al.18 in a cohort of 44 052 asymptomatic self-referred individuals for CAC testing and subsequently followed for all-cause mortality over a mean follow-up of 5.6 ± 2 years. Specifically, individuals with 0 RFs and elevated CAC had a mortality rate of 16.89/1000 person-years, whereas those with ≥3 RFs and CAC 0 had a mortality rate of 2.72/1000 person-years. Similarly, Shaw et al.1,9 demonstrated that low-risk individuals (based on traditional RF based assessments) with elevated CAC had a higher 5-year mortality rate than high-risk individuals with CAC < 10. Our results—which examine adjudicated CHD outcomes—extend these findings and support the concept that CAC scoring can further risk stratify individuals at the extremes of RF burden, and may have a prognostic role outside of intermediate risk patients.
Implications for clinical risk assessment and therapy
The novelty of our study is that it critically examines two paradigms of risk assessment—one exclusively RF based (predictor of atherosclerosis) and the other CAC based (direct measure of atherosclerosis). Although current guidelines recommend an initial RF-based approach followed by consideration of CAC testing for further risk assessment in select low-intermediate and intermediate risk groups,9,10 CAC testing may offer important prognostic information across a wider spectrum of individuals and questions the need for a paradigm shift from RFs to detection of subclinical atherosclerosis.
Value of coronary artery calcium testing in very ‘low-risk’ individuals
Although prior guidelines only recommended CAC testing for select intermediate risk individuals with 10-year risk of 10–20%, updated guidelines have now acknowledged the use of CAC testing for further risk stratification in lower risk individuals and have reduced the threshold to include individuals with an estimated 10-year CHD risk of 6–10%.9 However, current AHA guidelines recommend against CAC testing in those with 0–1 RFs as well as those with a very low global CHD risk score.9 Similarly, ESC guidelines recommend CAC testing for individuals at moderate risk; however, there are no specific recommendations regarding individuals at low risk.10
Our study adds to the current literature by demonstrating for the first time that even in subjects without any RFs, as well those with the 10-year global risk of <6%, coronary atherosclerosis is not uncommon. Among individuals with 0 RFs, 32% had CAC >0, whereas 12% had moderate or severe CAC (>100 or >300) and are at increased risk for all cause and hard CHD events. Among individuals with 0 RFs, the NNS to detect CAC >300 (severe) and CAC >100 (moderate) was 20 and 8, respectively, with the corresponding estimated 10-year event rates of 10.9 and 9.2%. Similarly, for individuals with FRS 0–6%, the corresponding NNS was 15 and 7, respectively, with the corresponding estimated 10-year event rates of 20.5 and 14.3%.
These findings support the current ESC and AHA guidelines recommending for CAC scoring to further risk stratify asymptomatic adults with moderate- and low-intermediate risk, and can be instrumental in guiding preventive therapies.9,10 The low NNS required to identify an individual with moderate–severe CAC, which is associated with an elevated risk of events even among individuals with little or no RFs, provides rationale for extending CAC testing to lower risk individuals in future guidelines.
Whether individuals classified as low risk by traditional RF-based methods but with significant CAC burden would benefit from pharmacologic intervention remains untested in dedicated randomized controlled trials; however, proper risk assessment may at least highlight to clinicians and patients the importance of emphasizing and achieving lifestyle modification and primordial prevention in a group that might not otherwise receive much attention. Additionally, both AHA and ESC guidelines recommend for therapeutic lifestyle changes alone for low-risk individuals with an elevated LDL-C that is <190 mg/dL (4.9 mmol/L), above which clinicians may consider pharmacologic intervention.1,10 For individuals with few or no RFs but with elevated CAC, in addition to emphasizing lifestyle changes, clinicians could consider lower LDL-C goals and treatment thresholds for statin therapy given the elevated risk associated with an increased CAC burden.20
Significance of coronary artery calcium 0 in ‘high-risk’ individuals
While high CAC scores can be useful in identifying high-risk individuals among those with no RFs, equally important is the fact that the absence of CAC confers a very low risk for future CVD events and mortality across all ranges of RF burden. A meta-analysis by Sarwar et al.21 showed that among 29 312 individuals without evidence of CAC, only 0.56% of subjects without CAC experienced a cardiovascular event during a mean follow-up period of 51 months. These findings were confirmed in a large cohort of individuals referred for CAC testing,22 as well as a multi-ethnic prospective cohort,23 demonstrating a very low event rate associated with CAC = 0 in asymptomatic individuals. In a recent study from MESA, one-third of individuals with diabetes (38%) had no detectable CAC and had minimal CHD events in nearly 6 years of follow-up.24
Although an acknowledged limitation of CAC scoring is the inability to rule out non-calcified plaque (NCP), among individuals with CAC = 0, the prevalence of NCP is low and the impact is minimal.25 A recent observational study evaluated the prevalence as well as the prognostic significance of NCP seen on coronary CT angiography in individuals with zero CAC score.25 The prevalence of NCP among 4491 individuals was 7%. Over follow-up, no clinical events occurred, thus demonstrating the low event rate associated with CAC = 0 even among those with NCP.
Our analysis from the prospective MESA cohort confirms findings from prior studies describing the strong negative predictive value of the absence of CAC in an asymptomatic cohort.21,22 Furthermore, our results add to the current literature not only by highlighting the heterogeneity of absolute CHD risk among individuals with multiple RFs, but also by demonstrating that the power of CAC 0 extends to this traditionally ‘high-risk’ group. As noted in our study, nearly one-third of individuals with ≥3 RFs and one-fifth of individuals with FRS >20% had CAC 0, translating into respective NNS of 3 and 5 to detect CAC 0, with the corresponding estimated 10-year event rates of 3.1 and 2.5%, respectively.
These results have important clinical implications adding to our prior reports by interpreting the results in light of findings from statin trials to project an estimated risk reduction across categories of RFs/FRS and CAC scores with a focus on those at the higher end of the baseline risk spectrum. This extrapolation allows estimation of a 5-year number needed to treat (NNT5) for LDL-C lowering with statins using previously described studies.26,27 Applying a 30% relative risk reduction associated with a 1.0 mmol/L reduction in LDL-C, based on a Cochrane meta-analysis of statin therapy in primary prevention,28 the estimated NNT5 among those with ≥3 traditional RFs and CAC = 0 is 222, whereas the NNT5 among those FRS >20% and CAC = 0 is 285. This is in comparison to the NNT5 seen among individuals with 0 RF or FRS 0–6% but CAC >300 with NNT5 of 66 and 36, respectively (Supplementary material online, Table S2).
In the current environment of rising healthcare costs with finite resources, there is evolving consensus to develop strategies for appropriate resource allocation, by accurately identifying who will more likely benefit as well as individuals among whom the yield of preventive pharmacotherapies may be limited. The low event rate associated with CAC 0, a feature seen in nearly one-third of ‘high-risk’ individuals, may provide rationale for treating individuals with multiple RFs but 0 CAC to less aggressive targets placing more emphasis on low cost lifestyle modifications.20 Although we are not recommending cessation of statins for patients in this group, we are supporting matching statin intensity with individualized risk, thus potentially favouring moderate dose statin over high dose statin in an individual with multiple RFs but CAC = 0. Given that the major adverse effects seen with statins appear to be dose dependent,29,30 a lower statin dose may still allow for lowering CHD risk, while also decreasing the risk for adverse effects.
Both AHA and ESC guidelines provide standard and optimal LDL-C goals and thresholds at which to initiate statins.9,10 However, there is little guidance regarding which ‘high-risk’ patients should target the lower LDL-C goal and be on more intensive statin therapy. Through enhanced risk stratification, CAC scoring has the potential to help clinicians identify ‘high-risk’ individuals in whom a lower LDL-C goal may be warranted, as well as those in whom more aggressive therapy may not.
Additionally, for asymptomatic individuals with multiple RFs and 0 CAC, we would not recommend for the use of aspirin given that the risk of bleeding is greater than the likelihood of preventing a CVD event.31 A previous analysis has shown the potential utility of CAC for guiding the use of aspirin in asymptomatic adults with diabetes by further characterizing absolute risk.32
Based on the heterogeneous risk among individuals with multiple RFs and the low NNS to detect CAC 0, it may be reasonable to consider expanding CAC scoring to individuals with multiple RFs currently classified as high risk. The notion of CAC scoring for further risk stratification in asymptomatic adults considered ‘high risk’ is indirectly supported by current AHA guidelines providing a level IIa recommendation for the use of CAC in adults with diabetes age >40 years, recognizing the heterogeneity of risk in this group classically considered high risk.9 Such a strategy could enable clinicians to focus intensifying resources on individuals with evidence of disease (as opposed to individuals who have RFs, but may never develop substantial coronary atherosclerosis) as this is the group in whom the majority of clinical events will occur, and thus are most likely to benefit from more aggressive preventive therapies. We believe that our study will stimulate more focused discussion among pertinent policy-makers to consider implications of these alternate paradigms.
Limitations
This study has limitations that warrant acknowledgement. Using number of RFs instead of calculating risk scores may be seen as a limitation; however, using number of RFs may be more clinically applicable given the low use of calculated risk scores in clinical practice. A survey conducted by the ESC demonstrated that <40% of clinicians used calculated risk scores to estimate a patient's risk.10 Furthermore, the NCEP/ATP III guidelines recommend for an initial risk stratification based on number of RFs, and then if equivocal, calculation of FRS. Additionally, our analysis comparing event rates by CAC score group with the population stratified by FRS categories yielded similar results to the main analysis where the population was stratified by RF burden.
Family history of premature CHD was not included as an RF in our primary analysis. The information pertaining to family history of premature CHD was not available for subjects at the baseline examination and therefore was included as a subgroup analysis.
Age was also not included as an RF. Age is a non-modifiable RF, and all men in our population were over the age of 45 years and, therefore, all male subjects would have at least 1 RF. This would have caused gender bias in the 0 RF group. When the population was stratified by age, our analysis demonstrated that CAC was still able to further risk stratify individuals across the RF spectrum among men aged >55 and women aged >65 years. We also demonstrated that CAC was able to further risk stratify individuals at the extremes of FRS, which heavily incorporates age when estimating risk. Additionally, when adjusted for age, CAC was still a robust predictor of CHD events at all levels of RF burden. Furthermore, Tota-Maharaj et al.33 have shown that CAC predicts events across the spectrum age, while McClelland et al.34 have demonstrated that chronologic age does not provide additional information for risk prediction beyond arterial age (based on CAC score).
Conclusion
Coronary artery calcium testing has the potential to further risk stratify individuals at the extremes of RF burden. Our findings may be seen to support the consideration of a new paradigm in cardiovascular risk assessment focusing on detection of subclinical atherosclerosis. This is a departure from the current approach of initial RF assessment followed by subclinical atherosclerosis testing in select intermediate risk individuals. Instead, the detection of subclinical atherosclerosis could serve as the initial step in evaluating cardiovascular risk. Although CAC is associated with radiation exposure of ∼1 mSv, comparable with that of a bilateral mammogram, measurement of subclinical atherosclerosis can demonstrate the collective impact of RFs over time, reflecting the effect of RF severity and duration which are often unknown and not accounted for in current risk assessment algorithms. Whether this new paradigm improves outcomes and is cost effective will need to be evaluated in future prospective trials.
Supplementary material
Supplementary material is available at European Heart Journal online.
Funding
This research was supported by the National Institutes of Health (N01-HC-95159 through N01-HC-95166, N01-HC-95169, U01HL105270-03 to H.M.K. and T32-HL-7227-36 to M.G.S.).
Supplementary Material
Acknowledgements
We thank the other investigators, staff, and participants of the MESA study for their valuable contributions.
Conflict of interest: M.J.B. is on the speaker's bureau for General Electric. H.M.K. is the recipient of a research grant from Medtronic, Inc. through Yale University and is chair of a cardiac scientific advisory board for UnitedHealth.
References
- 1.Executive Summary of the Third Report of the National Cholesterol Education Program (NCEP) Expert Panel on. Detection, evaluation, and treatment of high blood cholesterol in adults (adult treatment Panel III) JAMA. 2001;285:2486–2497. doi: 10.1001/jama.285.19.2486. [DOI] [PubMed] [Google Scholar]
- 2.Michos ED, Nasir K, Braunstein JB, Rumberger JA, Budoff MJ, Post WS, Blumenthal RS. Framingham risk equation underestimates subclinical atherosclerosis risk in asymptomatic women. Atherosclerosis. 2006;184:201–206. doi: 10.1016/j.atherosclerosis.2005.04.004. [DOI] [PubMed] [Google Scholar]
- 3.Schlendorf KH, Nasir K, Blumenthal RS. Limitations of the Framingham risk score are now much clearer. Prevent Med. 2009;48:115–116. doi: 10.1016/j.ypmed.2008.12.002. [DOI] [PubMed] [Google Scholar]
- 4.Akosah KO, Schaper A, Cogbill C, Schoenfeld P. Preventing myocardial infarction in the young adult in the first place: how do the National Cholesterol Education Panel III guidelines perform? J Am Coll Cardiol. 2003;41:1475–1479. doi: 10.1016/s0735-1097(03)00187-6. [DOI] [PubMed] [Google Scholar]
- 5.Greenland P, LaBree L, Azen SP, Doherty TM, Detrano RC. Coronary artery calcium score combined with Framingham score for risk prediction in asymptomatic individuals. JAMA. 2004;291:210–215. doi: 10.1001/jama.291.2.210. [DOI] [PubMed] [Google Scholar]
- 6.Taylor AJ, Bindeman J, Feuerstein I, Cao F, Brazaitis M, O'Malley PG. Coronary calcium independently predicts incident premature coronary heart disease over measured cardiovascular risk factors: mean three-year outcomes in the Prospective Army Coronary Calcium (PACC) project. J Am Coll Cardiol. 2005;46:807–814. doi: 10.1016/j.jacc.2005.05.049. [DOI] [PubMed] [Google Scholar]
- 7.Budoff MJ, Shaw LJ, Liu ST, Weinstein SR, Mosler TP, Tseng PH, Flores FR, Callister TQ, Raggi P, Berman DS. Long-term prognosis associated with coronary calcification: observations from a registry of 25,253 patients. J Am Coll Cardiol. 2007;49:1860–1870. doi: 10.1016/j.jacc.2006.10.079. [DOI] [PubMed] [Google Scholar]
- 8.Detrano R, Guerci A, Carr J, Bild D, Burke G, Folsom A, Liu K, Shea S, Szklo M, Bluemke D, O'leary D, Tracy R, Watson K, Wong N, Kronmal R. Coronary calcium as a predictor of coronary events in four racial or ethnic groups. N Engl J Med. 2008;358:1336–1345. doi: 10.1056/NEJMoa072100. [DOI] [PubMed] [Google Scholar]
- 9.Greenland P, Alpert JS, Beller GA, Benjamin EJ, Budoff MJ, Fayad ZA, Foster E, Hlatky MA, Hodgson JM, Kushner FG, Lauer MS, Shaw LJ, Smith SC, Jr, Traylor AJ, Weintraub WS, Wenger NK. 2010 ACCF/AHA guideline for assessment of cardiovascular risk in asymptomatic adults: Executive summary: a report of the American College of Cardiology Foundation/American Heart Association Task Force on Practice Guidelines. Circulation. 2010;122:2748–2764. doi: 10.1161/CIR.0b013e3182051bab. [DOI] [PubMed] [Google Scholar]
- 10.Perk J, De Backer G, Gohlke H, Graham I, Reiner Z, Verschuren M, Albus C, Benlian P, Boysen G, Cifkova R, Deaton C, Ebrahim S, Fisher M, Germano G, Hobbs R, Hoes A, Karadeniz S, Mezzani A, Prescott E, Ryden L, Scherer M, Syvänne M, Scholte op Reimer WJ, Vrints C, Wood D, Zamorano JL, Zannad F European Association for Cardiovascular Prevention and Rehabilitation (EACPR); ESC Committee for Practice Guidelines (CPG) European guidelines on cardiovascular disease prevention in clinical practice (version 2012). The fifth joint task force of the European Society of Cardiology and other societies on cardiovascular disease prevention in clinical practice (constituted by representatives of nine societies and by invited experts). Developed with the special contribution of the European Association for Cardiovascular Prevention and Rehabilitation (EACPR) Eur Heart J. 2012;33:1635–1701. doi: 10.1093/eurheartj/ehs092. [DOI] [PubMed] [Google Scholar]
- 11.Bild DE, Bluemke DA, Burke GL, Detrano R, Diez Roux AV, Folsom AR, Greenland P, Jacob DR, Jr, Kronmal R, Liu K, Nelson JC, O'Leary D, Saad MF, Shea S, Szklo M, Tracy RP. Multi-Ethnic Study of Atherosclerosis: objectives and design. Am J Epidemiol. 2002;156:871–881. doi: 10.1093/aje/kwf113. [DOI] [PubMed] [Google Scholar]
- 12.Carr JJ, Nelson JC, Wong ND, McNitt-Gray M, Arad Y, Jacobs DR, Jr, Sidney S, Bild DE, Williams OD, Detrano RC. Calcified coronary artery plaque measurement with cardiac CT in population-based studies: standardized protocol of Multi-Ethnic Study of Atherosclerosis (MESA) and Coronary Artery Risk Development in Young Adults (CARDIA) study. Radiology. 2005;234:35–43. doi: 10.1148/radiol.2341040439. [DOI] [PubMed] [Google Scholar]
- 13.Agatston AS, Janowitz WR, Hildner FJ, Zusmer NR, Viamonte M, Jr, Detrano R. Quantification of coronary artery calcium using ultrafast computed tomography. J Am Coll Cardiol. 1990;15:827–832. doi: 10.1016/0735-1097(90)90282-t. [DOI] [PubMed] [Google Scholar]
- 14.Budoff MJ, McClelland RL, Chung H, Wong ND, Carr JJ, McNitt-Gray M, Blumenthal RS, Detrano RC. Reproducibility of coronary artery calcified plaque with cardiac 64-MDCT: the Multi-Ethnic Study of Atherosclerosis. Am J Roentgenol. 2009;192:613–617. doi: 10.2214/AJR.08.1242. [DOI] [PubMed] [Google Scholar]
- 15.Wilson PW, D'Agostino RB, Levy D, Belanger AM, Silbershatz H, Kannel WB. Prediction of coronary heart disease using risk factor categories. Circulation. 1998;97:1837–1847. doi: 10.1161/01.cir.97.18.1837. [DOI] [PubMed] [Google Scholar]
- 16.Michos ED, Vasamreddy CR, Becker DM, Yanek LR, Moy TF, Fishman EK, Becker LC, Blumenthal RS. Women with a low Framingham risk score and a family history of premature coronary heart disease have a high prevalence of subclinical coronary atherosclerosis. Am Heart J. 2005;150:1276–1281. doi: 10.1016/j.ahj.2005.02.037. [DOI] [PubMed] [Google Scholar]
- 17.Maffei E, Martini C, Seitun S, Arcadi T, Tedeschi C, Guaricci A, Malagò R, Tarantini G, Aldrovandi A, Cademartiri F. Computed tomography coronary angiography in the selection of outlier patients: a feasibility report. Radiol Med. 2012;117:214–229. doi: 10.1007/s11547-011-0695-4. [DOI] [PubMed] [Google Scholar]
- 18.Nasir K, Rubin J, Blaha MJ, Shaw LJ, Blankstein R, Rivera JJ, Khan AN, Berman D, Raggi P, Callister T, Rumberger JA, Min J, Jones SR, Blumenthal RS, Budoff MJ. Interplay of coronary artery calcification and traditional risk factors for the prediction of all-cause mortality in asymptomatic individuals. Circ Cardiovasc Imaging. 2012;5:467–473. doi: 10.1161/CIRCIMAGING.111.964528. [DOI] [PubMed] [Google Scholar]
- 19.Shaw LJ, Raggi P, Schisterman E, Berman DS, Callister TQ. Prognostic value of cardiac risk factors and coronary artery calcium screening for all-cause mortality. Radiology. 2003;228:826–833. doi: 10.1148/radiol.2283021006. [DOI] [PubMed] [Google Scholar]
- 20.Nasir K, Martin SS, Virani S. Discordance: Can we capitalize on it to better personalize atherosclerosis treatment? Atherosclerosis, 2013;229:504–506. doi: 10.1016/j.atherosclerosis.2013.04.018. [DOI] [PubMed] [Google Scholar]
- 21.Sarwar A, Shaw LJ, Shapiro MD, Blankstein R, Hoffman U, Cury RC, Abbara S, Brady TJ, Budoff MJ, Blumenthal RS, Nasir K. Diagnostic and prognostic value of absence of coronary artery calcification. JACC Cardiovasc Imaging. 2009;2:675–688. doi: 10.1016/j.jcmg.2008.12.031. [DOI] [PubMed] [Google Scholar]
- 22.Blaha M, Budoff MJ, Shaw LJ, Khosa F, Rumberger JA, Berman D, Callister T, Raggi P, Blumenthal RS, Nasir K. Absence of coronary artery calcification and all-cause mortality. JACC Cardiovasc Imaging. 2009;2:692–700. doi: 10.1016/j.jcmg.2009.03.009. [DOI] [PubMed] [Google Scholar]
- 23.Budoff MJ, McClelland RL, Nasir K, Greenland P, Kronmal RA, Kondos GT, Shea S, Lima JA, Blumenthal RS. Cardiovascular events with absent or minimal coronary calcification: the Multi-Ethnic Study of Atherosclerosis (MESA) Am Heart J. 2009;158:554–561. doi: 10.1016/j.ahj.2009.08.007. [DOI] [PMC free article] [PubMed] [Google Scholar]
- 24.Malik S, Budoff MJ, Katz R, Blumenthal RS, Bertoni AG, Nasir K, Szklo M, Barr G, Wong ND. Impact of subclinical atherosclerosis on cardiovascular disease events in individuals with metabolic syndrome and diabetes: the Multi-Ethnic Study of Atherosclerosis. Diabetes Care. 2011;34:2285–2290. doi: 10.2337/dc11-0816. [DOI] [PMC free article] [PubMed] [Google Scholar]
- 25.Cho I, Suh JW, Chang HJ, Kim KI, Jeon EJ, Choi SI, Cho YS, Youn TJ, Chae IH, Kim CH, Choi DJ. Prevalence and prognostic implication of non-calcified plaque in asymptomatic population with coronary artery calcium score of zero. Korean Circ J. 2013;43:154–160. doi: 10.4070/kcj.2013.43.3.154. [DOI] [PMC free article] [PubMed] [Google Scholar]
- 26.Blaha MJ, Budoff MJ, DeFilippis AP, Blankstein R, Rivera JJ, Agatston A, O'Leary DH, Lima J, Blumenthal RS, Nasir K. Associations between C-reactive protein, coronary artery calcium, and cardiovascular events: implications for the JUPITER population from MESA, a population-based cohort study. Lancet. 2011;378:684–692. doi: 10.1016/S0140-6736(11)60784-8. [DOI] [PMC free article] [PubMed] [Google Scholar]
- 27.Altman DG, Andersen PK. Calculating the number needed to treat for trials where the outcome is time to an event. BMJ. 1999;319:1492–1495. doi: 10.1136/bmj.319.7223.1492. [DOI] [PMC free article] [PubMed] [Google Scholar]
- 28.Taylor F, Huffman MD, Macedo AF, Moore TH, Burke M, Davey Smith G, Ward K, Ebrahim S. Statins for the primary prevention of cardiovascular disease. Cochrane Database Syst Rev. 2013;1:CD004816. doi: 10.1002/14651858.CD004816.pub5. doi:10.1002/14651858.CD004816.pub5. [DOI] [PMC free article] [PubMed] [Google Scholar]
- 29.Waters DD, Ho JE, Boekholdt SM, DeMicco DA, Kastelein JJ, Messig M, Breazna A, Pedersen TR. Cardiovascular event reduction versus new-onset diabetes during atorvastatin therapy: effect of baseline risk factors for diabetes. J Am Coll Cardiol. 2013;61:148–152. doi: 10.1016/j.jacc.2012.09.042. [DOI] [PubMed] [Google Scholar]
- 30.Dormuth CR, Hemmelgarn BR, Paterson JM, James MT, Teare GF, Raymond CB, Lafrance JP, Levy A, Garg AX, Ernst P Canadian Network for Observational Drug Effect Studies (CNODES) Use of high potency statins and rates of admission for acute kidney injury: multicenter, retrospective observational analysis of administrative databases. BMJ. 2013;346:f880. doi: 10.1136/bmj.f880. doi:10.1136/bmj.f880. [DOI] [PubMed] [Google Scholar]
- 31.Baigent C, Blackwell L, Collins R, Emberson J, Godwin J, Peto R, Buring J, Hennekens C, Kearney P, Meade T, Patrono C, Roncaglioni MC, Zanchetti A Antithrombotic Trialists’ (ATT) Collaboration. Aspirin in the primary and secondary prevention of vascular disease: collaborative meta-analysis of individual participant data from randomised trials. Lancet. 2009;373:1849–1860. doi: 10.1016/S0140-6736(09)60503-1. [DOI] [PMC free article] [PubMed] [Google Scholar]
- 32.Silverman MG, Blaha MJ, Budoff MJ, Rivera JJ, Raggi P, Shaw LJ, Berman D, Callister T, Rumberger JA, Rana JS, Blumenthal RS, Nasir K. Potential implications of coronary artery calcium testing for guiding aspirin use among asymptomatic individuals with diabetes. Diabetes Care. 2012;35:624–626. doi: 10.2337/dc11-1773. [DOI] [PMC free article] [PubMed] [Google Scholar]
- 33.Tota-Maharaj R, Blaha MJ, McEvoy JW, Blumenthal RS, Muse ED, Budoff MJ, Shaw LJ, Berman DS, Rana JS, Rumberger J, Callister T, Rivera J, Agatston A, Nasir K. Coronary artery calcium for the prediction of mortality in young adults <45 years old and elderly adults >75 years old. Eur Heart J. 2012;33:2955–2962. doi: 10.1093/eurheartj/ehs230. [DOI] [PubMed] [Google Scholar]
- 34.McClelland RL, Nasir K, Budoff M, Blumenthal RS, Kronmal RA. Arterial age as a function of coronary artery calcium (from the Multi-Ethnic Study of Atherosclerosis MESA) Am J Cardiol. 2009;103:59–63. doi: 10.1016/j.amjcard.2008.08.031. [DOI] [PMC free article] [PubMed] [Google Scholar]
Associated Data
This section collects any data citations, data availability statements, or supplementary materials included in this article.