

Abstract
Objective:
To evaluate alterations in cerebral blood flow (CBF) using arterial spin-labeled MRI in autosomal dominant Alzheimer disease (ADAD) mutation carriers (MCs) in relation to cerebral amyloid and compared with age-matched healthy controls.
Background:
Recent work has identified alterations in CBF in elderly subjects with mild cognitive impairment and Alzheimer dementia using MRI. However, similar studies are lacking in ADAD. Subjects with ADAD are generally free of significant vascular disease and offer the opportunity to measure CBF early in the pathologic process before significant symptom onset when unique markers might be identified.
Methods:
Fourteen MCs (presenilin-1 and amyloid beta precursor protein) (Clinical Dementia Rating [CDR] 0 = 9, CDR 0.5 = 4, CDR 1 = 1) and 50 controls underwent 3-tesla pulsed arterial spin-labeled MRI. SPM8 was used to test the effect of MC status at the voxel level on CBF before and after controlling for age and CDR.
Results:
MCs had decreased perfusion in the caudate and inferior striatum bilaterally even after controlling for age and CDR. In MCs, separate areas of decreased CBF were associated with increasing cerebral amyloid and to decreased performance of attention and executive function.
Conclusions:
Early CBF changes were identified in asymptomatic and mildly symptomatic subjects with ADAD, particularly in the anterior striatum. Furthermore, amyloid deposition was associated with decreased CBF in a number of regions including anterior and posterior cortical areas. Both amyloid and decreased CBF were associated with declines primarily in executive cognitive function.
Fibrillar β-amyloid (Aβ) plaques, although one of the earliest pathologies identified in Alzheimer disease (AD), are not strongly linked to clinical symptoms in late-onset AD (LOAD) or in autosomal dominant AD (ADAD). However, the presence of nonfibrillar and fibrillar Aβ is associated with the risk of developing cognitive decline and may do so through a number of mechanisms including alterations of cerebrovascular integrity with secondary cerebral hypoperfusion.1–5 Identifying the mechanisms that link amyloid pathology to cognitive decline is a priority of research in AD and cognitive aging.
Studies in LOAD have identified alterations in resting cerebral perfusion in AD and mild cognitive impairment (MCI), but the presence of systemic and cerebrovascular disease as opposed to AD pathology may account for some of the abnormalities.6,7 Subjects with ADAD, however, typically develop symptoms at a younger age and therefore are likely to have less cardiovascular burden, offering the potential to measure the relationship between cerebral Aβ deposition and cerebral blood flow (CBF) unconfounded by atherosclerotic disease. The purpose of this study was to explore the relationship between cerebral amyloid and cerebral perfusion in the absence of significant cardiovascular and cerebrovascular disease. We hypothesized that, compared with control subjects, ADAD mutation carriers (MCs) would have decreased CBF in areas of greatest Aβ deposition. Likewise, within MCs, we explored whether greater amyloid deposition alters CBF diffusely or only within specific areas. Lastly, we explored the association between cognitive performance with CBF and cerebral Aβ, predicting that cognitive performance would be more closely associated with CBF than cerebral Aβ.
METHODS
Standard protocol approvals, registrations, and patient consents.
After approval from the University of Pittsburgh institutional review board, all subjects were recruited through an ongoing, observational study of ADAD, in vivo PET Aβ imaging, and cognitive and functional performance.
Study design and participants.
Subjects were required to be older than 18 years and free of any significant medical condition, psychiatric condition, or neurologic condition that could result in a cognitive disorder or affect their participation in the study. ADAD gene mutations were confirmed through an approved commercial testing facility (Athena Diagnostics, Worcester, MA). Fourteen subjects were included in the current study representing PS1 (presenilin-1) and APP (amyloid beta precursor protein) gene mutations. After consent, each subject underwent the procedures described below.
Clinical evaluation.
All subjects with ADAD received a comprehensive neurologic evaluation performed by experienced physicians, nurse practitioners, and physician assistants; detailed psychiatric evaluation by a geriatric psychiatrist; and comprehensive neuropsychological evaluation of the cognitive domains of attention (Digit Span Forward, Trail Making Test A), executive function (Digit Span Backward, Trail Making Test B, Digit-Symbol Substitution Test, Stroop Color-Word Interference Test, Letter Fluency), language (Boston Naming, Semantic Fluency), visuospatial function (modified Rey-Osterrieth Complex Figure, Modified Block Design), and learning and memory (Rey-Osterrieth Delayed Recall, CERAD [Consortium to Establish a Registry for Alzheimer’s Disease] 10-Word List, Logical Memory). Each subject and their informant were interviewed and the subject was assigned a Clinical Dementia Rating (CDR)8 score by an experienced rater. A consensus diagnosis of dementia was based on DSM-IV, and a diagnosis of AD was based on the National Institute of Neurological and Communicative Disorders and Stroke–Alzheimer's Disease and Related Disorders Association.9 All staff was blinded to genetic status.
Imaging.
MRI.
MRI was performed with a Siemens 3T Trio (Siemens AG, Erlangen, Germany). A volumetric MRI using the AD neuroimaging initiative sequence was used.10 This high-resolution anatomical sequence was for MRI-guided region-of-interest placement for the coregistered [C-11] Pittsburgh compound B (PiB) (PiB-PET). Sixty regions of interest were hand-drawn for MCs.11
Cerebral arterial perfusion was obtained using pulsed arterial spin labeling (ASL) with 82 MRI volumes including 2 M0 images in the beginning, and 40 spin labeling/control labeling image pairs were obtained. The data were collected using a pulsed ASL tagging scheme with a 3-dimensional interleaved spiral fast spin echo readout with the following parameters: spatial resolution: 240 × 240 × 109 mm, 64 × 64 matrix, repetition time = 4,000 milliseconds, echo time = 18 milliseconds; bandwidth: 2,790 Hz/Px; slice thickness: 4 mm with 1-mm gap; number of slices: 22; labeling duration: 0.7 seconds; acquisition time: 45 milliseconds; and delay time: 1.0 seconds. The M0 images were collected with spatial resolution: 240 × 240 × 109 mm, repetition time = 8,000 milliseconds, echo time = 18 milliseconds; bandwidth: 2,790 Hz/Px; slice thickness: 4 mm with 1-mm gap; and number of slices: 22.
PET.
PET imaging was performed at the University of Pittsburgh Medical Center PET Research Center on a Siemens/CTI ECAT HR + PET Scanner with a Neuro-insert (CTI PET Systems, Knoxville, TN) in 3-dimensional mode. The [C-11] was injected IV (12–15 mCi, over 20 seconds, specific activity approximately 1–2 Ci/μmol) and PET scanning was performed from 40 to 70 minutes postinjection (six 5-minute frames). The PiB-PET data were summed over 50 to 70 minutes postinjection, and analysis utilized a standardized uptake value ratio (SUVR) with cerebellum as described in reference 12. Global PiB was computed as the bilateral average SUVR of the following regions: anterior cingulate, anterior ventral striatum, prefrontal cortex, lateral temporal cortex, parietal cortex, and precuneus cortex. Hereafter, we refer to these 6 regions of interest as the AD regions because they were derived from areas typically demonstrating high amyloid burden.
A convenience sample of 50 young to middle-aged subjects from an unrelated study (see supplemental data on the Neurology® Web site at Neurology.org) was used as a comparison group for the purposes of measuring voxel-level differences in CBF based on AD mutation status (table 1). These subjects were free of significant medical, neurologic, or psychiatric disease or imaging evidence of cerebral trauma or stroke, participating in a study of brain health, stress, and cardiovascular disease.13,14 Attempts were made to match the control group to case group based on major demographic and clinical variables, age, sex, and education; however, there remained statistically significant differences. Therefore, they were chosen randomly from a group of more than 100.
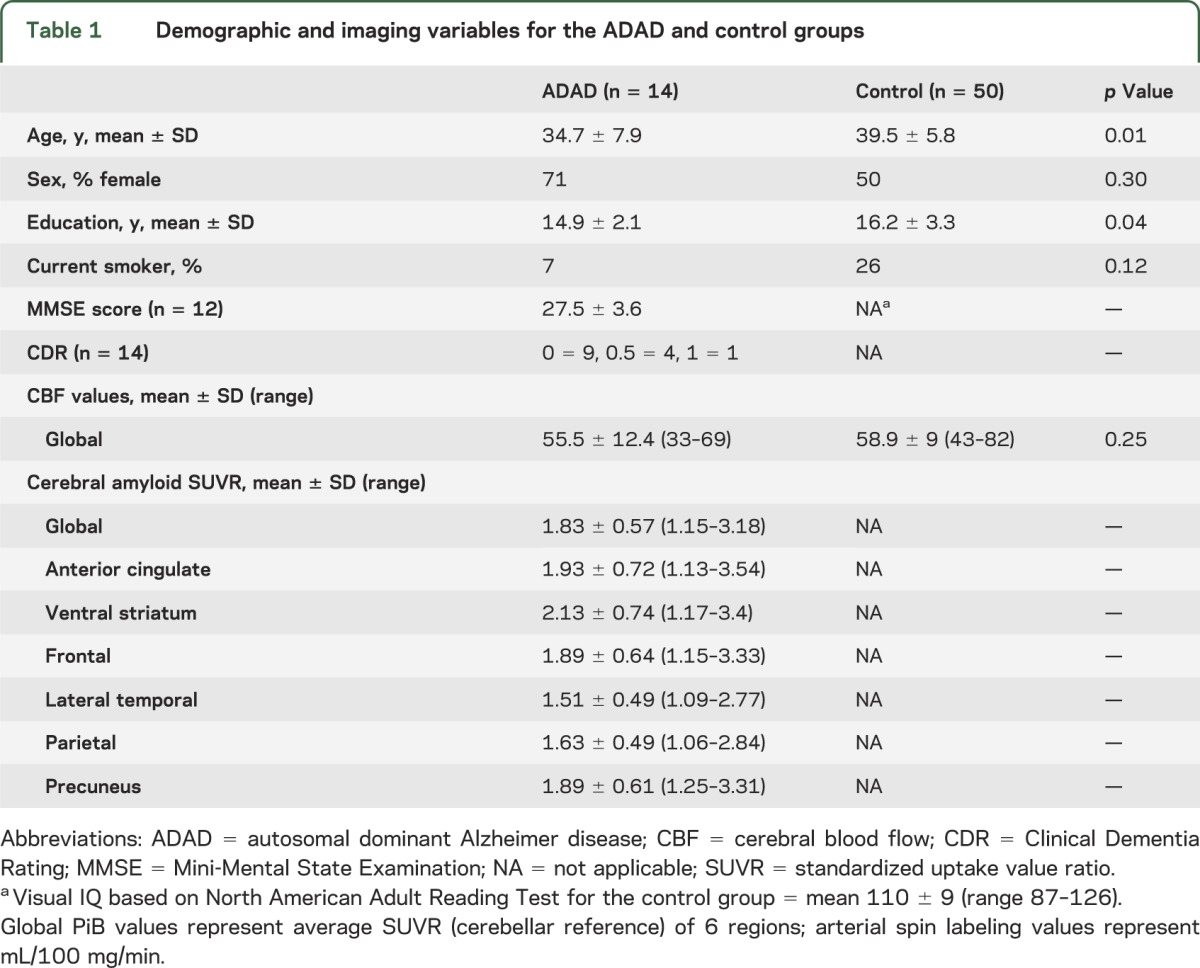
Table 1.
Demographic and imaging variables for the ADAD and control groups
ASL imaging processing.
ASL data were processed using SPM8 (Statistical Parametric Mapping; http://www.fil.ion.ucl.ac.uk/spm/) with a combination of in-house preprocessing, and methods based on the ASL toolbox from the University of Pennsylvania.15 First, all ASL images were realigned to the first image to correct for head motion. A mean M0 image, calculated by averaging the 2 M0 images, was then aligned to each subject’s magnetization-prepared rapid-acquisition gradient echo image. The aligned, registered images were smoothed with a 3-dimensional Gaussian filter (12 mm3 full width at half maximum). CBF was quantified by subtracting the pulse-labeled images from the control images using the sinc subtraction approach,15 which generated a mean CBF map. Image alignment and segmentation of each subject's structural and CBF images to the Montreal Neurological Institute spaces was achieved by utilizing the unified segmentation method in SPM8.16
All CBF images were reviewed for evidence of substantial artifact or problems with alignment and coregistration. None of the subjects had head motion >3° in the x, y, z plane. CBF maps were generated with and without correction for atrophy to account for the possibility of partial volume effects. However, there were no significant differences and thus the noncorrected values were used. Lastly, all scans were reviewed for evidence of significant vascular disease markers and microhemorrhages. One MC scan demonstrated a poor coregistration during the group comparison study, but there were no significant differences after removing and thus it was included.
Statistical analysis.
Appropriate descriptive and inferential statistics were used to compare groups including Student t and χ2 tests. For the between-group comparison (MCs and normal controls), we performed voxel-level t tests across the entire brain to explore the effect of MC status on CBF exclusively and after controlling for age or CDR score separately using SPM8. The statistical threshold was a family-wide error rate p < 0.05 with a cluster level threshold of 30 voxels.
In MCs only, we explored the association between global PiB SUVR values as the independent variable and CBF at the voxel level using a univariate regression analysis, first without covariates and then separately controlling for age and CDR status in 2 additional models in SPM. Because of the small size of the within-group analysis, a threshold of p < 0.005, uncorrected, with a cluster level of 50 voxels, was used. To address the issue of possible type I error in the SPM analysis, we extracted the CBF values from those clusters found to be significant and performed a correlation between CBF values and PiB values in the AD regions used to establish the whole-brain PiB SUVR. Lastly, to explore the functional implications of CBF and Aβ deposition, we performed simple bivariate correlations between the CBF clusters identified in the voxel-level analysis and PiB values from the AD regions to cognitive performance. In those areas found to have significant values, we repeated the analysis controlling for age. Because of the small numbers and nonnormality of the data, we used a Kendall tau correlation coefficient. In addition, for those cognitive tests with significantly skewed distributions, a log10 transformation was applied and the correlations repeated but no significant differences were found, thus the nontransformed data were used. Analyses were performed using SPSS version 21.0 (IBM Corp., Armonk, NY). The control group had limited cognitive data available and thus correlations between cognition and CBF or PET Aβ deposition were restricted to the MC cohort.
RESULTS
There were 14 MCs (CDR 0 = 9, CDR 0.5 = 4, CDR 1 = 1; dementia = 2, MCI = 1) and 50 control subjects who were slightly older (Cohen d = −0.69) and had more education (d = −0.47). There were no differences in global CBF between MCs and controls (table 1). For the MCs, there was an inverse relationship between age and CBF (ρ = −0.56), but no association between education and CBF (ρ = 0.27).
Perfusion and mutation status.
MCs had decreased perfusion in the caudate and inferior striatum bilaterally relative to controls that remained after controlling for age and CDR status (figure 1). Two smaller clusters located in the left medial parietal-posterior sensory cortex and right premotor area also were decreased in MCs. When we compared CDR 0 and 0.5 subjects separately with normal controls, the results were virtually the same, but the cluster size was reduced (image not shown). We found no areas of increased perfusion in the MCs compared with the noncarriers.
Figure 1. Voxel-wise cerebral perfusion t map comparing mutation carriers with noncarriers, mutation carrier group-wise PiB-PET, and overlay of perfusion t map and PiB-PET.
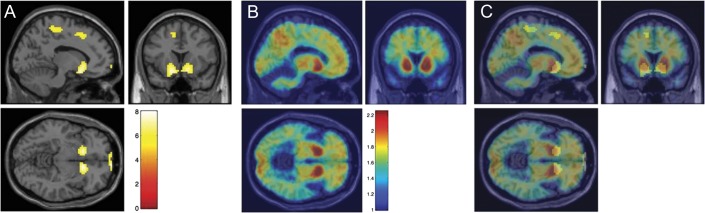
(A) Two-sample t test with no covariates demonstrating areas of decreased CBF in mutation carriers compared with noncarriers; family-wise error p < 0.05, cluster level of 30; color bar represents t values for significant voxels; Montreal Neurological Institute coordinates −11, 20, −8. (B) Mutation carriers (14) group composite amyloid PET demonstrating high bilateral striatal amyloid deposition; color bar represents standardized uptake value ratio 50–70 values. (C) Composite overlay of voxel-wise CBF map (A) and group-level amyloid deposition demonstrating the anatomical colocalization of the decreased CBF in the bilateral striatum where cerebral amyloid density is highest. CBF = cerebral blood flow; PiB = Pittsburgh compound B.
Perfusion and Aβ.
As global PiB retention increased, there was decreased perfusion in the right anterior, lateral prefrontal cortex as well as the right occipital/temporal cortex and the superior right parietal lobe, left lateral-middle temporal gyrus, and a small area of the right precuneus (figure 2A). After controlling for age or CDR score in 2 separate models (figure 2B), there were similar findings but a reduction in the size of clusters. In addition, we found as PiB retention increased, there was increased CBF to the bilateral, medial occipital cortex and left superior motor cortex (figure 2C).
Figure 2. Whole-brain voxel-wise regression of CBF perfusion predicted by global PiB-PET SUVR values.

All analyses represent p < 0.005 (uncorrected), cluster level of 50; red areas represent inverse correlations, and blue areas represent direct correlations. (A) Decreased CBF with increasing global SUVR values, no covariates. (B) Decreased CBF with increasing global SUVR values with age as covariate. (C) Increased CBF with increasing global SUVR, no covariates (no changes were demonstrated with addition of age as covariate, so image is not shown). CBF = cerebral blood flow; PiB = Pittsburgh compound B; SUVR = standardized uptake value ratio.
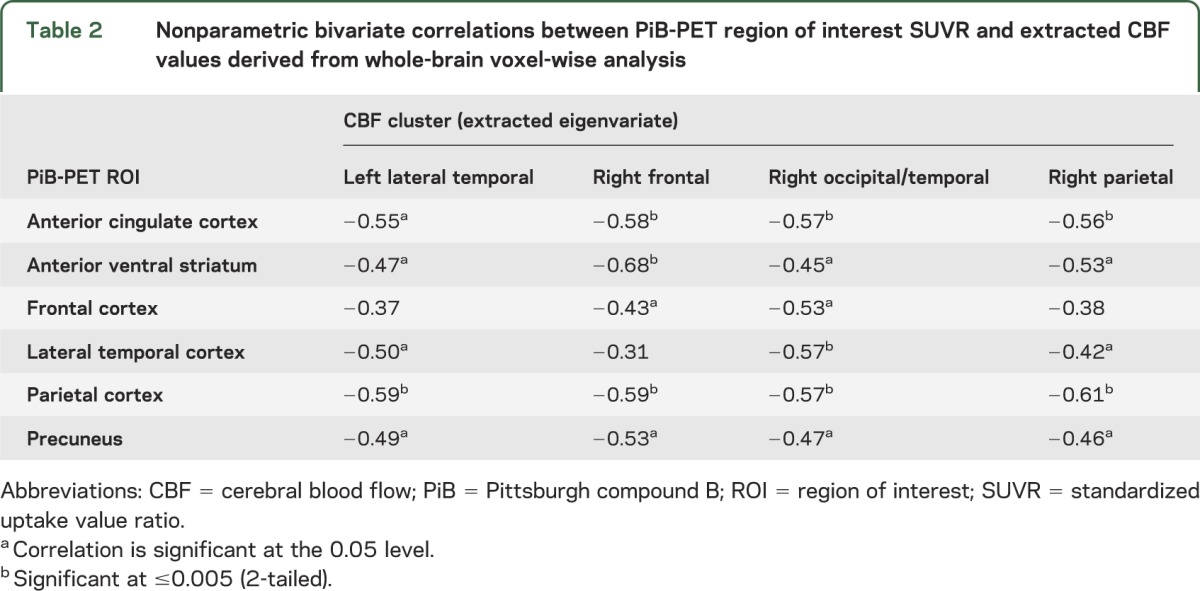
We then extracted the CBF values from the clusters in figure 2 and correlated these values with the SUVR values in the AD regions (table 2). There were similar inverse correlations between nearly all AD regions and the CBF clusters, indicating no predominant association between a particular anatomical area of amyloid and decreased blood flow.
Table 2.
Nonparametric bivariate correlations between PiB-PET region of interest SUVR and extracted CBF values derived from whole-brain voxel-wise analysis
Perfusion, Aβ, and cognitive performance.
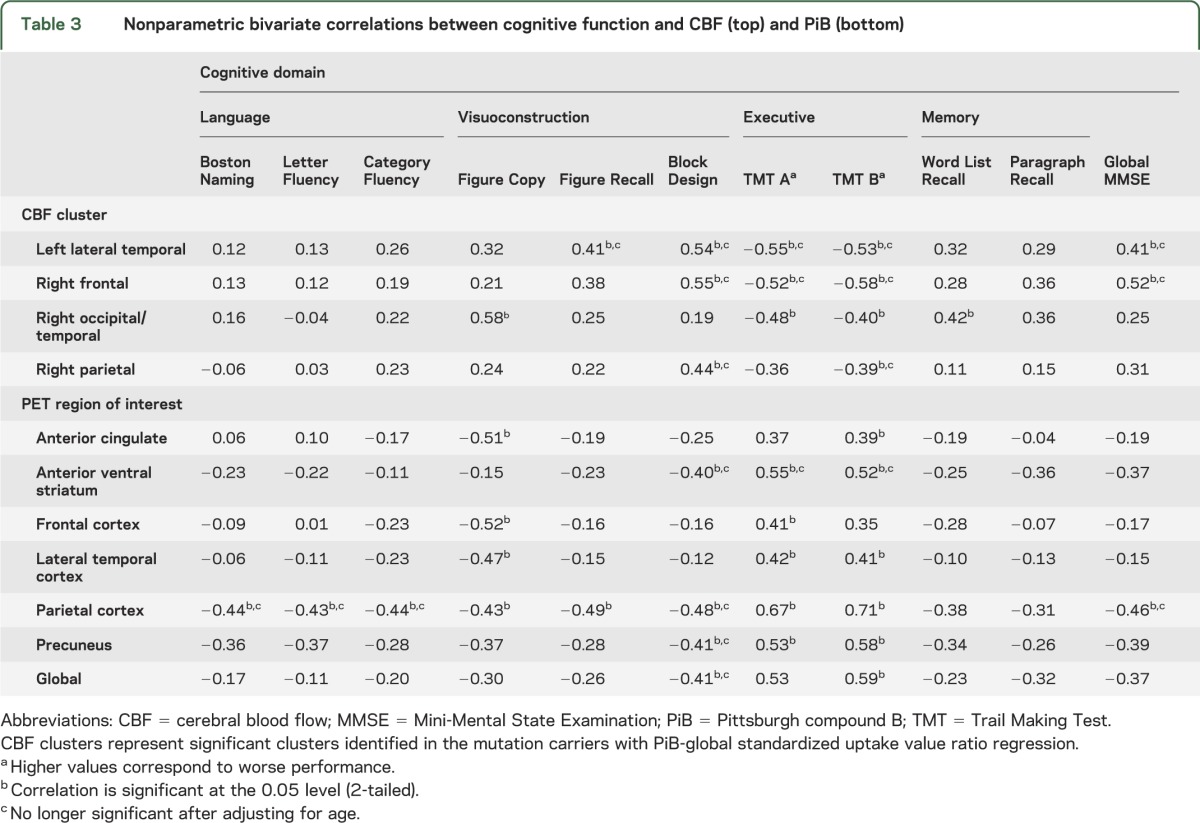
As CBF decreased, there was an associated decrease in performance on tests of attention and executive cognitive function (table 3). As CBF increased, there was an increase in global cognitive function and performance on visuoconstruction tasks. Only the correlations in the right occipital/temporal remained significant after adjusting for age. As PiB retention increased, there was a decrease in executive function and visuospatial function, but not memory function, with the strongest correlations noted with parietal lobe PiB retention. After adjusting for age, nearly all correlations with executive function remained significant. These PiB-cognitive relationships remained after removing the 2 subjects with highest global SUVR indicating the results were not driven by these 2 subjects (data not shown).
Table 3.
Nonparametric bivariate correlations between cognitive function and CBF (top) and PiB (bottom)
DISCUSSION
In this study of asymptomatic and mildly symptomatic subjects with ADAD gene mutations, we found (1) decreased CBF in the bilateral ventral-anterior striatum in the MCs compared with normal controls that corresponded to the area of most intense PiB retention, (2) in the MCs, as amyloid burden increased, there were multiple areas of the right hemisphere and the left lateral temporal cortex with decreased CBF, and (3) those areas of decreased CBF, along with PiB retention, were associated with worse cognitive function, primarily executive cognitive function. Lastly, there was evidence of increased CBF in the bilateral occipital lobes with increased PiB retention.
This study adds to the growing body of evidence highlighting distinct abnormalities in the striatum in ADAD compared with LOAD. Striking, early amyloid deposition has been identified in PiB-PET studies of ADAD before symptom onset.17,18 In addition, structural MRI has recently identified an increase in caudate volumes in asymptomatic MCs and decreased mean diffusivity in the striatum in ADAD and sporadic young-onset AD.14,19 However, functional imaging measures, particularly [18F]-fluorodeoxyglucose (FDG)-PET have not identified any clear changes in these subcortical structures in ADAD or LOAD despite the identified structural changes and robust early Aβ deposition.18 In addition, no clear cognitive-motor correlates of the early amyloid deposition in the striatum have been identified thus far. Our observations suggest that there may indeed be CBF, and less so cognitive, consequences of the early accumulation of nonneuritic plaques in the striatum. The striatal amyloid deposition may have an impact on neuronal function with a secondary effect on CBF. However, it is also possible that the amyloid accumulation has minimal direct consequences on CBF. Rather, it may be a byproduct of other pathologic mechanisms that are also associated with the accumulation of amyloid.20 Notably, postmortem studies have identified diffuse as opposed to neuritic plaques as the major constituent of amyloid in the caudate nucleus,21 but the impact of diffuse plaques on the cerebrovascular and neuronal systems is uncertain.
Studies in LOAD using ASL have identified anatomical alterations in CBF that, generally, recapitulate those identified with FDG-PET and cerebral SPECT.7,22–24 However, we are unaware of any existing studies in ADAD exploring CBF. The few studies using FDG-PET in ADAD have demonstrated decreased areas of metabolism, mostly in the temporal and parietal heteromodal cortices in asymptomatic to mildly symptomatic subjects.25–27 Contrary to our initial hypothesis, we did not identify this same pattern in this group of ADAD MCs, but rather the greatest differences were located in the bilateral striatum. However, because of the limitations of this study, a comparison with LOAD using ASL was not possible. Nevertheless, many of the areas that demonstrated decreased perfusion with increasing PiB retention were in areas that have demonstrated decreased perfusion or metabolism in sporadic AD. Thus, with a more clinically impaired population of ADAD, we might expect to see the same using ASL. Studies looking at cerebral perfusion in cognitively normal subjects with a family history of AD (non–autosomal dominant) have identified areas of hypoperfusion in the right hemisphere in areas similar to ours, pointing to possible mechanisms unrelated to cerebral amyloid.28 Contrarily, a study in elderly MCI subjects identified areas of increased cerebral perfusion in the right striatum compared with cognitively normal subjects.7 Taken together, these studies indicate that it will be important to evaluate the relationship between increasing cortical amyloid, and nonamyloid mechanisms and ASL-measured perfusion in older asymptomatic and mildly symptomatic subjects to evaluate whether there are similar findings to those identified here in ADAD. Taken together, our study did not conclusively identify a clear direct anatomical link between cerebral perfusion and Aβ, further highlighting the need to explore additional mechanisms among altered cerebral perfusion, neuronal metabolism, and cortical atrophy in AD beyond amyloid plaques.
Although our MC group consisted mostly of unimpaired subjects, there was evidence of relationships between alterations in CBF and cognitive performance. In particular, the clusters of decreased CBF identified in the voxel-level analysis were inversely related to measures of executive function, and directly correlated with global cognitive performance, especially in the left lateral temporal cortex and right frontal lobe clusters. We assessed the correlation between the striatal clusters identified as significantly different from the noncarriers and cognitive function and found a marginal statistical relationship between decreasing cognitive performance primarily in executive function (figure e-1) with decreasing striatal perfusion. However, these relationships were significantly attenuated when age, but not CDR scores, was controlled for. This underscores the importance of considering the specific effects of age on cognitive performance and blood flow. This is particularly important in the case of studies using cerebral amyloid, which is found to have minimal association with cognition once age is accounted for.29 This study further highlights the lack of association between amyloid and cognitive symptoms in ADAD. Both ADAD and sporadic AD are characterized by early memory decline, but this study did not identify any clear associations between cerebral amyloid and memory function. This study and others suggest that if amyloid is to be targeted for treatment trials, it will be necessary to identify other measures of neuronal and cognitive function. Subject to replication, our findings indicate that ASL might also be useful in identifying clinically important measures in ADAD before significant symptom onset.
This study has a few important limitations. The first is the small group size. Second, because of the susceptibility to signal distortion or loss of signal near the skull base with echo planar imaging, it is possible that some of the differences identified between controls and MCs might represent artifacts. However, all CBF images were reviewed for signal loss or distortion using the peak coordinates identified in the group analysis.
This preliminary study indicates that early CBF changes can be identified in asymptomatic and mildly symptomatic subjects with ADAD, particularly in the anterior striatum, an area that demonstrates a pattern of early robust PiB retention in ADAD. Given the relative ease of acquisition compared with FDG-PET and cerebral SPECT, it is possible that ASL might offer a reliable marker of cerebral perfusion and neuronal function in studies of AD and related disorders, particularly early in the process when interventions are most likely to be of benefit.
Supplementary Material
GLOSSARY
- Aβ
β-amyloid
- AD
Alzheimer disease
- ADAD
autosomal dominant Alzheimer disease
- ASL
arterial spin labeling
- CBF
cerebral blood flow
- CDR
Clinical Dementia Rating
- DSM-IV
Diagnostic and Statistical Manual of Mental Disorders, 4th edition
- FDG
[18F]-fluorodeoxyglucose
- LOAD
late-onset Alzheimer disease
- MC
mutation carrier
- MCI
mild cognitive impairment
- PiB
Pittsburgh compound B
- SPM
Statistical Parametric Mapping
- SUVR
standardized uptake value ratio
Footnotes
Supplemental data at Neurology.org
AUTHOR CONTRIBUTIONS
Design and conceptualization: McDade, Kim, James, Becker. Analysis and interpretation: McDade, Kim, James, Sheu, Kuan, Snitz, Klunk. Drafting or revision of the manuscript for intellectual content: McDade, Kim, James, Sheu, Kuan, Minhas, Gianaros, Ikonomovic, Lopez, Snitz, Price, Becker, Mathis, Klunk.
STUDY FUNDING
Supported by NIH grants P50 AG005133, R37 AG025516, P01 AG025204, and R01 HL089850, and the Doris Duke Foundation.
DISCLOSURE
E. McDade, A. Kim, J. James, L. Sheu, C. Kuan, D. Minhas, P. Gianaros, S. Ikonomovic, O. Lopez, B. Snitz, J. Price, and J. Becker report no disclosures relevant to the manuscript. C. Mathis and W. Klunk: GE Healthcare holds a license agreement with the University of Pittsburgh based on the technology described in this manuscript. Drs. Klunk and Mathis are coinventors of PiB and, as such, have a financial interest in this license agreement. All other authors have no conflicts of interest with this work and had full access to all of the data in the study and take responsibility for the integrity of the data and the accuracy of the data analysis. Go to Neurology.org for full disclosures.
REFERENCES
- 1.Smith EE, Greenberg SM. Beta-amyloid, blood vessels, and brain function. Stroke 2009;40:2601–2606 [DOI] [PMC free article] [PubMed] [Google Scholar]
- 2.Thal DR, Capetillo-Zarate E, Larionov S, Staufenbiel M, Zurbruegg S, Beckmann N. Capillary cerebral amyloid angiopathy is associated with vessel occlusion and cerebral blood flow disturbances. Neurobiol Aging 2009;30:1936–1948 [DOI] [PubMed] [Google Scholar]
- 3.Princz-Kranz FL, Mueggler T, Knobloch M, Nitsch RM, Rudin M. Vascular response to acetazolamide decreases as a function of age in the arcA beta mouse model of cerebral amyloidosis. Neurobiol Dis 2010;40:284–292 [DOI] [PubMed] [Google Scholar]
- 4.Zlokovic BV. Neurovascular pathways to neurodegeneration in Alzheimer's disease and other disorders. Nat Rev Neurosci 2011;12:723–738 [DOI] [PMC free article] [PubMed] [Google Scholar]
- 5.Dumas A, Dierksen GA, Edip Gurol M, et al. Functional MRI detection of vascular reactivity in cerebral amyloid angiopathy. Ann Neurol 2012;72:76–81 [DOI] [PMC free article] [PubMed] [Google Scholar]
- 6.Dai W, Lopez OL, Carmichael OT, Becker JT, Kuller LH, Gach HM. Abnormal regional cerebral blood flow in cognitively normal elderly subjects with hypertension. Stroke 2008;39:349–354 [DOI] [PMC free article] [PubMed] [Google Scholar]
- 7.Dai W, Lopez OL, Carmichael OT, Becker JT, Kuller LH, Gach HM. Mild cognitive impairment and Alzheimer disease: patterns of altered cerebral blood flow at MR imaging. Radiology 2009;250:856–866 [DOI] [PMC free article] [PubMed] [Google Scholar]
- 8.Morris J. The Clinical Dementia Rating (CDR): current version and scoring rules. Neurology 1993;43:2412–2414 [DOI] [PubMed] [Google Scholar]
- 9.McKhann G, Drachman D, Folstein M, Katzman R, Price D, Stadlan EM. Clinical diagnosis of Alzheimer's disease: report of the NINCDS-ADRDA Work Group under the auspices of Department of Health and Human Services Task Force on Alzheimer's Disease. Neurology 1984;34:939–944 [DOI] [PubMed] [Google Scholar]
- 10.Jack CR, Bernstein MA, Fox NC, et al. The Alzheimer's disease neuroimaging initiative (ADNI): MRI methods. J Magn Reson Imaging 2008;27:685–691 [DOI] [PMC free article] [PubMed] [Google Scholar]
- 11.Cohen AD, Price JC, Weissfeld LA, et al. Basal cerebral metabolism may modulate the cognitive effects of Abeta in mild cognitive impairment: an example of brain reserve. J Neurosci 2009;29:14770–14778 [DOI] [PMC free article] [PubMed] [Google Scholar]
- 12.Lopresti BJ, Klunk WE, Mathis CA, et al. Simplified quantification of Pittsburgh compound B amyloid imaging PET studies: a comparative analysis. J Nucl Med 2005;46:1959–1972 [PubMed] [Google Scholar]
- 13.Jennings JR, Heim AF, Kuan DCH, Gianaros PJ, Muldoon MF, Manuck SB. Use of total cerebral blood flow as an imaging biomarker of known cardiovascular risks. Stroke 2013;44:2480–2485 [DOI] [PMC free article] [PubMed] [Google Scholar]
- 14.Ryan JP, Sheu LK, Verstynen TD, Onyewuenyi IC, Gianaros PJ. Cerebral blood flow links insulin resistance and baroreflex sensitivity. PLoS One 2013;8:e83288. [DOI] [PMC free article] [PubMed] [Google Scholar]
- 15.Wang J, Alsop DC, Li L, et al. Comparison of quantitative perfusion imaging using arterial spin labeling at 1.5 and 4.0 tesla. Magn Reson Med 2002;48:242–254 [DOI] [PubMed] [Google Scholar]
- 16.Ashburner J, Friston KJ. Unified segmentation. Neuroimage 2005;26:839–851 [DOI] [PubMed] [Google Scholar]
- 17.Klunk WE, Price JC, Mathis CA, et al. Amyloid deposition begins in the striatum of presenilin-1 mutation carriers from two unrelated pedigrees. J Neurosci 2007;27:6174–6184 [DOI] [PMC free article] [PubMed] [Google Scholar]
- 18.Benzinger TL, Blazey T, Jack CR, Jr, et al. Regional variability of imaging biomarkers in autosomal dominant Alzheimer's disease. Proc Natl Acad Sci USA 2013;110:E4502–E4509 [DOI] [PMC free article] [PubMed] [Google Scholar]
- 19.Fortea J, Sala-Llonch R, Bartrés-Faz D, et al. Increased cortical thickness and caudate volume precede atrophy in PSEN1 mutation carriers. J Alzheimers Dis 2010;22:909–922 [DOI] [PubMed] [Google Scholar]
- 20.Ashford JW, Salehi A, Furst A, et al. Imaging the Alzheimer brain. J Alzheimers Dis 2011;26(suppl 3):1–27 [DOI] [PMC free article] [PubMed] [Google Scholar]
- 21.Ikonomovic MD, Klunk WE, Abrahamson EE, et al. Post-mortem correlates of in vivo PiB-PET amyloid imaging in a typical case of Alzheimer's disease. Brain 2008;131:1630–1645 [DOI] [PMC free article] [PubMed] [Google Scholar]
- 22.Chao LL, Buckley ST, Kornak J, et al. ASL perfusion MRI predicts cognitive decline and conversion from MCI to dementia. Alzheimer Dis Assoc Disord 2010;24:19–27 [DOI] [PMC free article] [PubMed] [Google Scholar]
- 23.Kim S, Kim M, Rhee H, et al. Regional cerebral perfusion in patients with Alzheimer’s disease and mild cognitive impairment: effect of APOE epsilon4 allele. Neuroradiology 2012;55:25–34 [DOI] [PubMed] [Google Scholar]
- 24.Chen Y, Wolk DA, Reddin JS, et al. Voxel-level comparison of arterial spin-labeled perfusion MRI and FDG-PET in Alzheimer disease. Neurology 2011;77:1977–1985 [DOI] [PMC free article] [PubMed] [Google Scholar]
- 25.Bateman RJ, Xiong C, Benzinger TLS, et al. Clinical and biomarker changes in dominantly inherited Alzheimer's disease. N Engl J Med 2012;367:795–804 [DOI] [PMC free article] [PubMed] [Google Scholar]
- 26.Kennedy AM, Newman SK, Frackowiak RS, et al. Chromosome 14 linked familial Alzheimer's disease: a clinico-pathological study of a single pedigree. Brain 1995;118:185–205 [DOI] [PubMed] [Google Scholar]
- 27.Mosconi L, Sorbi S, de Leon MJ, et al. Hypometabolism exceeds atrophy in presymptomatic early-onset familial Alzheimer's disease. J Nucl Med 2006;47:1778–1786 [PubMed] [Google Scholar]
- 28.Okonkwo OC, Xu G, Oh JM, et al. Cerebral blood flow is diminished in asymptomatic middle-aged adults with maternal history of Alzheimer's disease. Cereb Cortex 2014;24:978–988 [DOI] [PMC free article] [PubMed] [Google Scholar]
- 29.Storandt M, Head D, Fagan AM, Holtzman DM, Morris JC. Toward a multifactorial model of Alzheimer disease. Neurobiol Aging 2012;33:2262–2271 [DOI] [PMC free article] [PubMed] [Google Scholar]
Associated Data
This section collects any data citations, data availability statements, or supplementary materials included in this article.