

Abstract
Explanations for color phenomena are often sought in the retina, LGN and V1, yet it is becoming increasingly clear that a complete account will take us further along the visual-processing pathway. Working out which areas are involved is not trivial. Responses to S-cone activation are often assumed to indicate that an area or neuron is involved in color perception. However, work tracing S-cone signals into extrastriate cortex has challenged this assumption: S-cone responses have been found in brain regions, such as MT, not thought to play a major role in color perception. Here we review the processing of S-cone signals across cortex and present original data on S-cone responses measured with fMRI in alert macaque, focusing on one area in which S-cone signals seem likely to contribute to color (V4/posterior inferior temporal cortex), and on one area in which S signals are unlikely to play a role in color (MT). We advance a hypothesis that the S-cone signals in color-computing areas are required to achieve a balanced neural representation of perceptual color space, while the S-cone signals in non-color-areas provide a cue to illumination (not luminance) and confer sensitivity to the chromatic contrast generated by natural daylight (shadows, illuminated by ambient sky, surrounded by direct sunlight). This sensitivity would facilitate the extraction of shape-from-shadow signals to benefit global scene analysis and motion perception.
Physiological studies of color have uncovered many puzzles. Here are four puzzles. First, neurons in the lateral geniculate nucleus (LGN; Figure 1) are strongly color opponent, but the opponency does not correspond to Hering's fundamental opponent-color pairs (red-green, blue-yellow) (Webster et al., 2000); moreover the color-tuning of the population of LGN cells is not balanced across color space, but is rather strongly biased towards “red-cyan” and “lavender-lime” (e.g. few neurons show optimal tuning to “blue”, “green”, “purple” or “yellow”). Second, the spatial opponency of LGN cells is configured in exactly the wrong way to subserve color contrast (Wiesel & Hubel, 1966): the optimal stimulus for a “red-on” cell is bright red on a dark red background—not red on green, as a mechanism for color contrast would have it (Hubel & Livingstone, 1990; Conway, 2001; Conway & Livingstone, 2005). Third, S cones can strongly drive V1 activity (Engel et al., 1997; Cottaris & De Valois, 1998; Mullen et al., 2010), even though S cones make up a paltry 10% of the cones (Curcio et al., 1990; Roorda et al., 2001). And fourth, color cells in V1 often respond to S-cone isolating stimuli, and in each cell, the responses to S-cone stimuli typically align with those to M-cone stimuli (Conway, 2001; Conway et al., 2002; Conway & Livingstone, 2006; Lafer-Sousa et al., 2012)(Figure 2). Many had assumed that S input, if it existed at all, would align with the L input to account for the reddish quality of short-wavelength light (Ingling, 1977). Clearly regions downstream of the LGN and V1 must be critically involved in the computation of hue and other color phenomena such as Hering's basic color categories (Gegenfurtner & Kiper, 2003; Conway, 2009; Conway & Stoughton, 2009; Conway et al., 2010). One goal of contemporary neurophysiology is to identify these brain regions, and then to address how they construct perceptual correlates from the cone signals they receive from the LGN, V1 and other areas. This goal is especially challenging since a given neural signal may not be exclusively involved in generating color percepts. It remains a conceptual hurdle to maintain a distinction between neural signals that may be involved in computing color on the one hand, and the perceptual-cognitive output of the nervous system on the other hand. As shown by the title of this review, studies of color often slip into a short-hand that obscures this distinction (what constitutes a “color signal” in the brain?).
Figure 1.
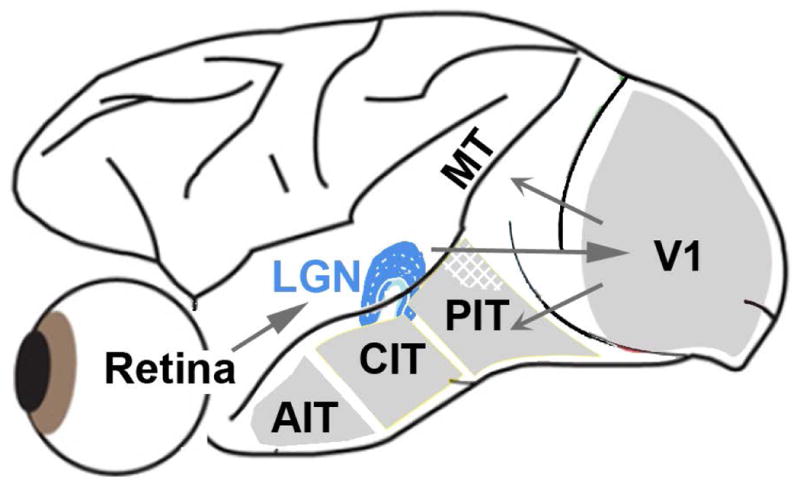
Simple schematic of the brain showing the visual pathway from the retina, through the dorsal lateral geniculate nucleus of the thalamus (LGN), up to primary visual cortex (V1). From V1, through intermediate visual areas (V2, V3, V4, not labeled), two major routes have been described, a dorsal pathway through MT (and related areas), and a ventral pathway through posterior, central and anterior inferior temporal (IT) cortex. The dorsal pathway has been implicated in encoding dynamic spatiotemporal relationships among visual objects (object action), while the ventral pathway is thought to represent stable attributes of objects (object quality)(DiCarlo et al., 2012; Kravitz et al., 2012). S-cone activation drives responses within both dorsal and ventral pathways. IT contains regions that are relatively more responsive to color (one such region is shown hatched in PIT).
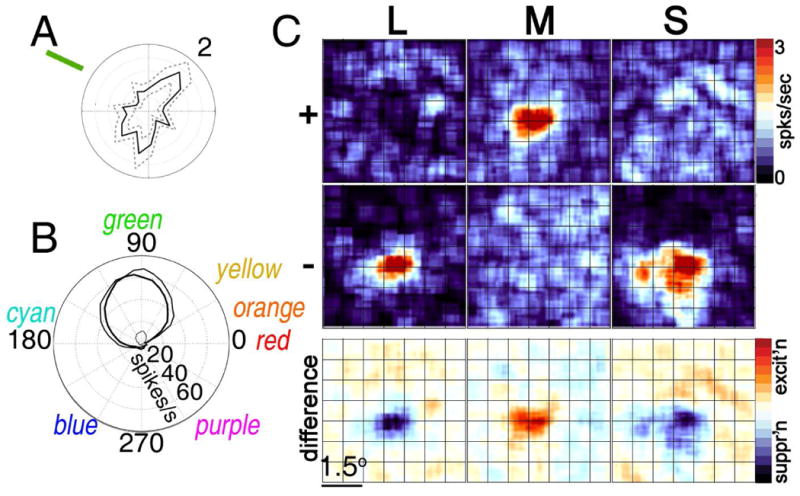
Figure 2.
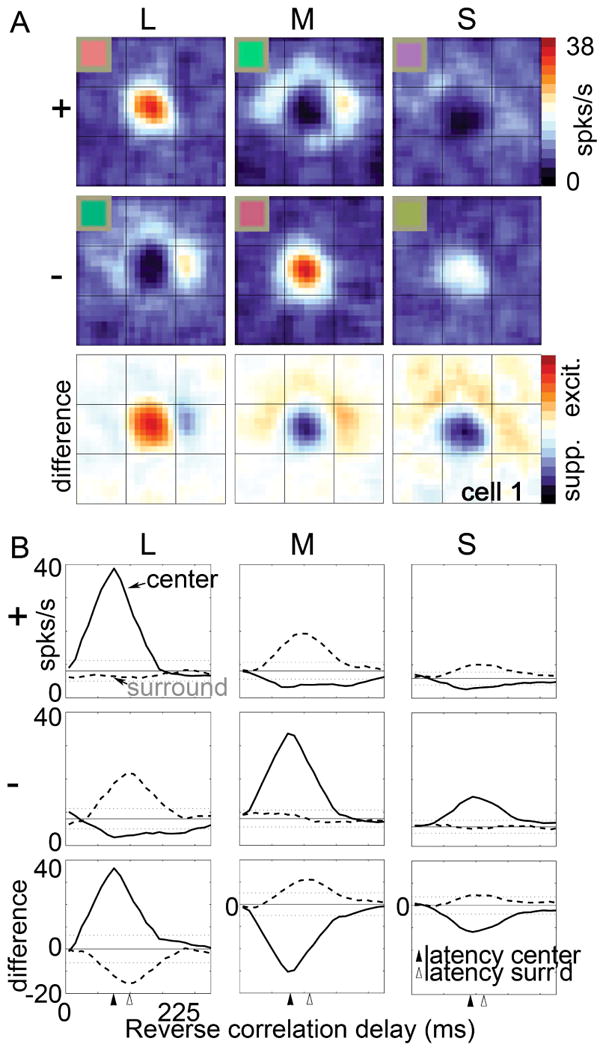
Spatial organization of cone inputs to a double-opponent cell recorded in alert macaque primary visual cortex. A, Spatial receptive-field map generated using sparse noise cone-isolating stimuli and reverse correlation. Scale of the small divisions on the grid is 0.75° of visual angle. The receptive-field center of the cell was activated by the “+” direction of the L-cone stimulus and the “-“ direction of the M-cone stimulus, both of which appear reddish, but also by the “-“ direction of the S stimulus, which appears lime. Note that the colors associated with the optimal polarity for each of the three cone-isolating stimuli do not fall in the same category, undermining the claim that the neuron contributes directly to hue. The inset gives an indication of the color of each stimulus (although the actual stimuli were presented on a computer monitor and carefully color calibrated). A “+” stimulus causes a selective increase in activation of the given cone type (compared to the activation generated by the adapting background); a “-“ stimulus causes a selective decrease in cone activation. B, Spike-triggered average traces. The receptive-field center (central region in panels, A) was excited by an increase in L-cone activity (L+) or a decrease in M or S activity (M–, S–), and suppressed by a decrease in L (L–) or an increase in M or S (M+, S+); the receptive-field surround gave the opposite pattern of responses. Data from (Conway, 2001; Conway & Livingstone, 2006).
Because there are so few S cones in the retina, and the eye is focused in the middle part of the spectrum (yellow), S-cone signals are necessarily blurry. S-cone signals are therefore unable to contribute to high acuity. What is their function? Many assume it has something to do with color perception because S-cone signals are necessary to establish perceptual color space. Thus neural responses to S cone activation are often thought to reflect a neural “color signal”((Wandell et al., 1999)). But the assumption that S-cones subserve only color is being challenged by work tracing S-cone signals through the visual system into extrastriate regions that probably play little or no role in color perception(Gegenfurtner et al., 1994; Seidemann et al., 1999; Wandell et al., 1999; Barberini et al., 2005; Liu & Wandell, 2005; D'Souza et al., 2011). Here we will review the evidence that most (likely all) visual extrastriate areas are activated by stimulation of the S cones, and present data from an original fMRI experiment that assessed the chromatic tuning of different brain regions in the dorsal and ventral streams of alert macaque. We will focus on two extrastriate regions, MT and V4/PIT (Figure 1). MT has traditionally been considered a motion area, with little involvement in color processing. We will discuss a parsimonious theory that accounts for MT's sensitivity to S-cone stimulation without implicating the region in color perception. V4/PIT has historically been thought to contribute to color (Zeki, 1980), so the S-cone responses of neurons within this region may not be surprising. But the region is not homogenous, having some portions that likely play a role in color and other portions that do not (Zeki, 1983; Ghose & Ts'o, 1997; Conway et al., 2007; Tanigawa et al., 2010). To what extent do S-cone signals drive these different regions within V4/PIT? We will discuss the transformation of chromatic information that likely transpires in V4/PIT, and the implications of this transformation for our understanding of the role of S-cone signals in color perception.
MT
Area MT (V5) lies squarely within the so-called dorsal visual-processing stream, implicated in computations of visual motion and global scene structure (Kravitz et al., 2011). Lesions of MT impair motion perception (Zeki, 2004). Moving stimuli with strong luminance contrast clearly appear to move; however, when luminance contrast is replaced with color contrast alone, motion perception is crippled (Gregory, 1977; Gregory & Heard, 1983; Cavanagh, 2009). These observations have led to the notion that MT is colorblind. Indeed responses of neurons within MT are lower to moving equiluminant stimuli than to moving stimuli with luminance contrast (Seidemann et al., 1999; Thiele et al., 2001; Riecansky et al., 2005). But MT is not entirely unresponsive to chromatic signals. Dobkins and Albright (Dobkins & Albright, 1993, 1994) designed a clever stimulus to test this hypothesis, and determined that residual color information is sufficient to drive MT neurons when luminance information is not available. Consistent with this observation, fMRI responses in area MT during a color-exchange experiment testing red-blue gratings over a range of relative luminance contrasts shows that MT has a dip around photometric equiluminance, but maintains some response (Conway & Tsao, 2006). Thus it seems clear that “color” signals penetrate MT, but it is unlikely that such signals encode hue or contribute to color perception. Several studies have shown that while MT neurons respond to equiluminant stimuli, their responses are rarely selective for hue. And no MT neurons have been found that show hue selectivity tolerant to addition of luminance contrast (Conway et al., 2007). This is unlike hue perception itself, which is tolerant to luminance contrast: bright red and dark red are both “red”. The distinction between sensitivity to color and selectivity for color is crucial: while color sensitivity is evident in many neurons across many brain regions, color selectivity seems relatively rare.
The fact that MT cells seem sensitive to purely chromatic stimuli yet incapable of contributing to hue perception provides support for the idea that retinal cone-opponent signals may contribute to multiple perceptual abilities. It is plausible, indeed likely, that the same population of LGN cells is sampled by many different neurons within both the dorsal and ventral pathways, with each population pooling responses of LGN cells along different dimensions. Individual cells in V1 provide evidence to support this multiplexing role for LGN cells. An orientation-tuned neuron in V1 may sample all available LGN cells at a given orientation within a defined region of the visual field, regardless of the LGN cells' cone opponency, in order to achieve the most crisp orientation-tuning possible within the constraints of the retinal mosaic. Meanwhile, a double-opponent V1 cell may selectively sample from among the same set of LGN cells, selecting LGN inputs on the basis of each LGN cell's cone opponency so as to generate sensitivity to the chromatic makeup of a boundary (Conway & Livingstone, 2006). Thus the same population of LGN cells could be sampled in different ways to produce two different populations of V1 cells, both of which would be responsive to equiluminant boundaries, yet only one of which would be selective for the hue configuration of the boundaries. One might wonder about the utility of neurons sensitive but not selective to color, as most V1 cells appear to be (Johnson et al., 2004). Such cells would be essential for detecting chromatic boundaries in the absence of reliable cues to luminance or hue, as would be necessary to defeat camouflage (Conway & Livingstone, 2006; Conway, 2009). A similar argument could be applied to MT neurons, providing a function for their ability to respond to purely chromatic signals without invoking a role for MT cells in color perception.
Though it seems likely that MT neurons are sensitive to color, one must consider alternative explanations for their responses to pure color stimuli. Monkeys and humans have cone types with similar spectral tuning (Baylor et al., 1987) and nearly identical psychophysical chromatic mechanisms (Stoughton et al., 2012), but the two species have different pre-retinal pigments (Snodderly et al., 1984). This difference would manifest as different cone fundamentals for each species, since cone fundamentals are estimates of cone activation derived psychophysically (i.e. using stimuli that pass through all the hardware and filters of the eye). If human and monkey cone fundamentals are indeed substantially different, a stimulus that is equiluminant for a human may possess luminance contrast for a monkey. Despite this potential difficulty, human cone fundamentals are routinely used to define color stimuli for testing responses of cells in monkeys. Luminance artifacts associated with color stimuli could also arise from chromatic aberration. Chromatic aberration occurs because the retina is a fixed distance from the cornea and lens—only some of the visible spectrum can be in focus at any given time. Most eyes are in focus in the middle of the spectrum (yellow); as a result, short wavelengths (which are carried by S cones) are necessarily blurry. Because of chromatic aberration, images with sharp blue chromatic boundaries are accompanied by luminance fringes when projected on the retina. These fringes are sufficient to drive LGN neurons (Forte et al., 2006; Vladusich, 2007), and given the strong sensitivity of MT cells to luminance contrast, they could also be sufficient to drive MT cells. Indeed, MT neurons show the strongest responses to flashed equiluminant bars when the bars are blue, but these “color” responses are greatly reduced (or abolished) when the stimuli are presented on a luminance pedestal (Conway et al., 2007). Should the MT responses to color stimuli be attributed to luminance artifacts, or to the putative S-cone input that MT cells receive? Cumulative evidence suggests the answer is “both”.
The idea that MT cells get S-cone input was pursued by Wandell and his colleagues, who showed that MT neurons in alert monkeys respond to S-cone-isolating stimuli (Seidemann et al., 1999). The stimuli used to drive the monkey MT neurons had low spatial frequency, which mitigates chromatic aberration. They were defined using human cone fundamentals (which might introduce luminance contrast artifacts discussed above), but the results were supported by fMRI results obtained in humans (Figure 3)(Wandell et al., 1999; Mullen et al., 2010); moreover, the physiological findings correlated with behavioral evidence (Dougherty et al., 1999). The most likely interpretation of these data is that S-cone signals penetrate area MT, although a subsequent study found only very weak S-cone-responses in macaque (Riecansky et al., 2005). The later study used anesthetized animals whereas the former study used alert animals. Whether this difference is relevant is unclear, but the conflicting results cast some doubt on whether S-cone signals actually penetrate MT. Anatomical evidence suggests they do: S cones may enter MT by way of diffuse bipolar cells (Dacey & Lee, 1994; Dacey, 1996; Calkins et al., 1998; Klug et al., 2003; Percival et al., 2009), which provide the excitatory input to parasol ganglion cells and LGN magnocellular cells. This evidence implies that diffuse bipolar cells and magnocellular cells should respond to S-cone-isolating stimuli, but physiological studies have not been able to confirm this prediction conclusively (Derrington et al., 1984; Chatterjee & Callaway, 2002; Reid & Shapley, 2002; Sun et al., 2006; Dacey et al., 2013). A surprising piece of evidence in favor of S-cone input to MT comes from other anatomical work. Sincich et al. deposited retrograde tracers into area MT and found evidence of labeled cells within the koniocellular layers of the LGN (Sincich et al., 2004) (Figure 4). This is surprising for two reasons: first, it shows that there is a direct projection from the LGN to an extrastriate area; and second, the projection is from the koniocellular layers (the cell-sparse layers intercalated between the more impressive parvocellular layers). Many, though certainly not all, cells within the “K” layers carry S-cone signals (Martin et al., 1997; Reid & Hendry, 2000). These findings are consistent with a route carrying S-cone signals into MT, perhaps as short as four synapses from the S cones. But there remains a missing link: the physiology of the MT-projecting neurons has not been described; it remains possible that the S-cone-carrying “K” cells actually avoid projecting to MT.
Figure 3.

Responses measured with fMRI in human subjects to stimuli with luminance contrast (squares) or S-cone contrast (diamonds). A, V1 responses. B, MT responses. The shape of the S-cone response function in V1 is not a scaled version of the luminance response, consistent with the conclusion that the response to the two stimuli are mediated by different underlying neural components (i.e. the S-cone responses is not just driving the luminance channel weakly). Luminance responses in MT are ∼6X greater than luminance responses in V1; S-cone responses in MT are ∼2X greater than those in V1. From (Wandell et al., 1999).
Figure 4.
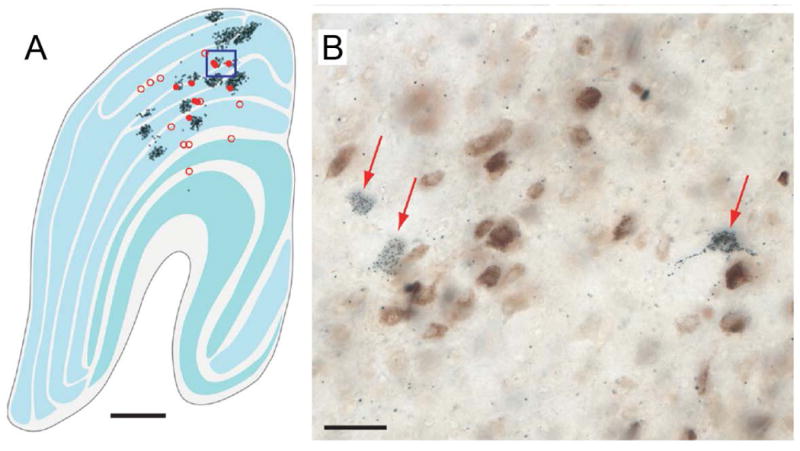
Neurons in macaque LGN identified after retrograde tracer injection in area MT and V1. A, Low-power of a slice through the entire LGN showing MT-projecting cells in red and V1-projecting cells in black. B, High-power of the boxed region in A. MT-projecting cells labeled in blue; V1-projecting cells labeled in brown. Note the two MT-projecting neurons that are conspicuously not double-labeled, showing that the axons of these neurons project directly to MT and bypass V1. MT-projecting neurons appear to be located preferentially within the koniocellular layers of the LGN, which are thought to carry strong S-cone signals. Data from (Sincich et al., 2004).
What purpose would S-cone signals within the dorsal stream serve, if not for guiding color perception? One idea, alluded to above, is that the S-cone signals establish color sensitivity, which could be useful for defeating camouflage. This function would seem to be most relevant within brain regions such as inferior temporal cortex implicated in high-resolution vision subserving the perception, identification and discrimination of objects. MT is not such an area. What, then, could MT be using the color sensitivity for? Within V1, S cone input biases the overall color preference of the area toward the orange-blue axis—the colors of daylight (Figure 5)(Lafer-Sousa et al., 2012). This bias is evident in the responses of single V1 cells to individual cone-isolating stimuli (for example, the cell shown in Figure 2 responds optimally to L+, M- and S- stimuli, a combination that lies in the “orange” region of color space, Figure 5A, top right inset) and for the whole population of V1 cone-opponent cells (Figure 5A). An orange-blue bias has not been found using fMRI in humans (Goddard et al., 2010), but is found using fMRI in monkeys (Figure 5B)—the discrepancy in results obtained in different species remains unresolved. The bias in the monkey data arises because the responses to colors along the 45° intermediate axis (orange-blue) are stronger than the responses along the orthogonal intermediate axis (green-magenta). This asymmetry in responses is surprising since orange-blue and green-magenta gratings activate the underlying cone-opponent populations in the LGN (L-M, and S) to the same extent. Thus the bias indicates the emergence of non-cardinal chromatic mechanisms constructed by a nonlinear combination of the underlying cardinal mechanisms.
Figure 5.

Cone-opponent cells in V1 are biased in chromatic tuning for colors of the daylight axis. A, responses of a population of cone-opponent neurons to cone-isolating stimuli, projected on the cone-opponent axes. Inset top right shows the standard C.I.E. chromaticity diagram with the cone-opponent axes intersecting at the neutral point, and the chromaticities of many samples of daylight. Inset top right shows the equiluminant plane through the DKL color space. Note that the 45° axis extending from –S/L-M through the origin towards +S/M-L forms the “daylight” axis. B, Macaque V1 responses measured using fMRI to different color directions of the DKL color space. Note the bias for the daylight axis. Responses have been normalized to 1. Stimuli comprised heterochromatic gratings, 2.9 cycles/degree, drifting slowly at 0.75 cycles/second, reversing direction every 2 seconds. Data from experiment 1 in (Lafer-Sousa et al., 2012).
Functional MRI is powerful because it provides a simultaneous measurement of the responses across visual areas: one can compare responses at different stages of the visual system to determine what happens to chromatic signals as they propagate through the dorsal and ventral streams (Mullen et al., 2010). In human LGN, BOLD signals do not correlate well with spiking activity (Mullen et al., 2010), possibly because the LGN is deep in the human brain, relatively far away from the signal-detection coils. Nonetheless, Mullen and colleagues have shown in humans that the fMRI responses to S-cone stimuli presented at low spatial and temporal frequencies are amplified between LGN and V1 (Mullen et al., 2008). This finding predicts that the channel carrying S-cone signals in V1 has relatively coarse spatiotemporal resolution. Indeed, V1 neurons driven most strongly by S-cone stimuli have longer latencies and larger receptive fields with weaker center-surround spatial structure than those driven most strongly by L or M-cone stimuli (Conway & Livingstone, 2006). Functional MRI signals in monkey LGN are easily measured (Conway & Tsao, 2006; Conway et al., 2007), and possibly stronger than those in human LGN because monkeys have smaller heads: the detection coils are closer to the signal source. In monkey LGN, the daylight bias is not obvious (Figure 6A), suggesting the bias is generated, or accentuated, within V1. MT shows a stronger orange-blue bias than does the LGN, although the bias in MT is not as great as that found in V1 (Figure 6B). As discussed in the next section, the responses of the portions of V4/PIT that are not implicated in hue perception show a pronounced bias for the daylight axis (Figure 6C), while those portions of V4/PIT that are implicated in hue perception show almost no bias and a relative boost in S-cone sensitivity compared to V1 (Figure 6D).
Figure 6.

Responses measured using fMRI to different color directions of the DKL color space at multiple stages of visual processing. A, Responses within the LGN. B, Responses in MT. C, Responses in the portions of posterior IT that do not show a color bias (“i” for “in between” color-biased regions). D, Responses within color-biased regions of PIT. Responses in V1 shown in gray for comparison. Other conventions as for Figure 5B. PITi shows a pronounced bias along the daylight axis. Data from experiment 1 in (Lafer-Sousa et al., 2012). Cone contrasts for the four chromatic conditions given in Table 1 (adapted from Table 2 of Lafer-Sousa et al., 2012). Note that the two intermediate axes would elicit the same average activation of the underlying cardinal mechanisms, and that the total cone contrast (sum of L, M and S-cone contrasts) was much higher for the S stimulus than for the L-M stimulus. Despite the higher cone contrast, the response to the S stimulus was relatively low in LGN, V1, MT and PITi compared to the response to the L-M stimulus. PITc showed a relatively stronger response to S cones compared to V1. The increase in response along the S-axis within PIT color-biased regions achieves a more balanced response to all colors around the color wheel, and is consistent with the more likely involvement of this region in encoding color perception.
The color bias in V1 and extrastriate areas may account for the salience of orange-blue color pairings in advertising, notably movie posters (Sciretta, 2009). Other color pairings also modulate along the daylight axis: for example, brown (which is “orange” viewed under low illumination) and gray. We speculate that the sensitivity to orange-blue (or brown-gray, depending on the adaptation state) facilitates detection of ecologically relevant stimuli, such as rocks from soil (Gouras and Eggers, 1982), which could guide an animal's movement through the environment. S-carrying ganglion cells are optimal for distinguishing white (gray, rocks) from yellow (brown, soil) information, which would be helpful for an animal walking or running on the ground. Under many conditions, white and yellow would be expected to activate L and M cones to the same extent. To the extent that midget cells are not activated by S cones, midget cells would not be able to distinguish yellow from white. Of course in nature colors are rarely “pure” and it is likely that a natural yellow and a natural white/gray would show some subtle difference in L-M activation, making them visible to midget cells. But it is probably safe to say that the ganglion cells that would show the largest differential response to white and yellow would be those carrying S-cone signals. In addition, chromatic boundaries formed by colors of daylight are often cast by shadows: the shadow reflects the blue of skylight, while the surrounding region reflects the longer wavelengths of direct sunshine. These chromatic boundaries are well known to painters, such as Claude Monet who often depicted shadows using bluish paint (Figure 7). Artists have shown that such depictions provide a potent clue to a scene's 3-D geometry. Visual sensitivity to these chromatic boundaries in nature would presumably aid in interpreting global scene structure, an important function ascribed to the dorsal stream.
Figure 7.
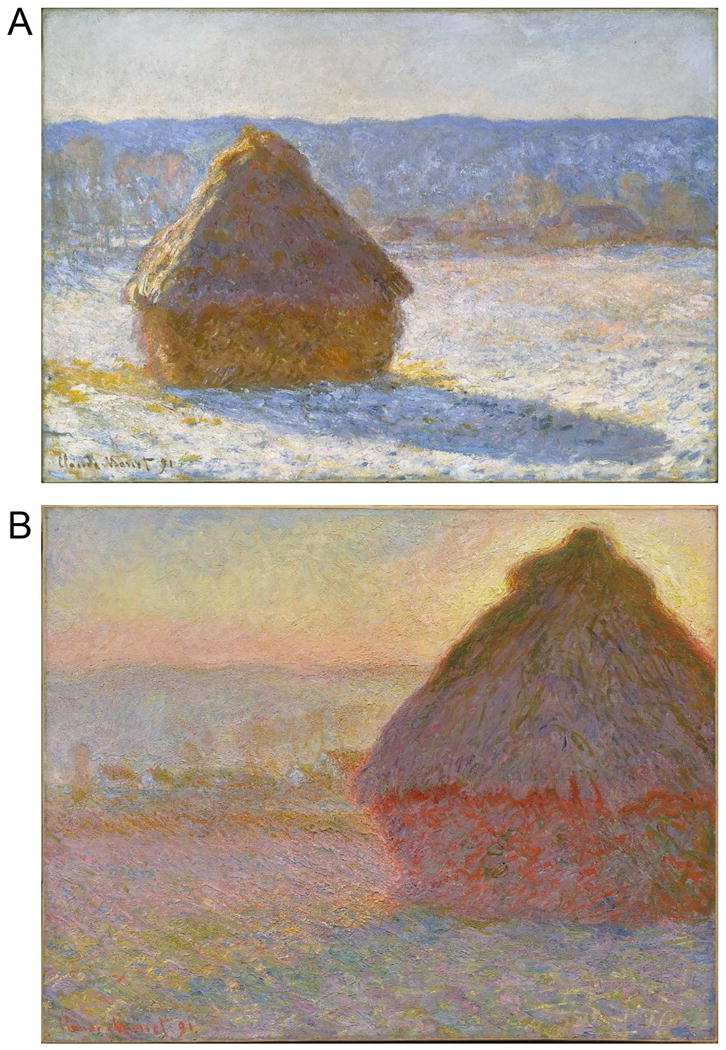
A, Morning Snow Effect (1891), oil on canvas (65.4×92.4cm), by Claude Monet. Museum of Fine Arts, Boston. B, Haystacks (Sunset)(1891), oil on canvas (73.3×92.7 cm), by Claude Monet. Museum of Fine Arts, Boston. Monet routinely depicts shadows with blue, surrounded by daylight yellow-orange.
V4/PIT
There is still no good neural explanation for Hering's psychologically important colors, the unique hues often associated with them, or the reddish quality of short-wavelength light. As described above, explanations depending on visual stages early in visual processing (retina, LGN, V1) have failed critical tests. These failures implicate brain regions downstream of V1 in solving many color puzzles, but the identification of likely target regions has been a major hurdle. Seminal single-unit physiological recordings identified clusters of color-tuned neurons within what was called area V4 (Zeki, 1973). The anterior boundary of V4 is not clearly evident following callosal dissection (unlike the boundary between V1 and V2) (Zeki, 1978). This lack of clarity introduced some controversy about the extent of the area (if “area” is even a sensible term). With the discovery of color cells within the superior temporal sulcus, just anterior to what was thought to be V4, the notion emerged that V4 constituted a “complex of areas”somewhat dedicated to processing chromatic signals (Zeki, 1980; Lueck et al., 1989). But the consensus today is that the region is not exclusively or entirely dedicated to processing color signals (Conway & Tsao, 2006; Roe et al., 2012). To explore the functional organization of color within extrastriate cortex, Too tell and colleagues conducted an acute experiment using a heterochromatic stimulus of red and blue stripes to strongly drive all classes of receptors and post-receptoral mechanisms. The experiment stained tissue that was activated more strongly by equiluminant colored gratings than by black-and-white gratings (Tootell et al., 2004). Several labeled regions were found within V4 and posterior IT; the data underscore the patchy nature of the region. These results are consistent with those subsequently obtained using functional brain imaging (Conway & Tsao, 2006; Harada et al., 2009; Katsuyama et al., 2010) and optical imaging (Tanigawa et al., 2010). The hypothesis that the V4 complex comprises large-scale color patches (on the order of several millimeters in diameter) separated by regions with weaker color selectivity was tested using fMRI-guided single-unit recording (Conway et al., 2007). The fMRI color-biased regions, dubbed “globs” (by analogy with the color-bias found in the cytochrome-oxidase “blobs” of V1), contained a preponderance of color-tuned neurons, while neurons within the inter-glob regions showed weaker color tuning. The coarse functional organization, comprising larger scale modules than had been found in earlier visual areas such as V1, is not clearly evident with microelectrode recording, and resolves the controversy about the functional organization of V4 and the immediately anterior portion of IT (posterior IT).
Color-selective neurons have been described in other portions of IT—most notably within a region of anterior IT (AIT), near the anterior medial temporal sulcus (AMTS)(Komatsu et al., 1992). Komatsu and his colleagues have also confirmed the strong color-bias of the region using functional imaging (Komatsu et al., 1992; Harada et al., 2009). Color-tuned neurons have also been described within central IT (Tootell et al., 2004; Matsumora et al., 2008). The specific role of each of these groups of neurons in processing color signals and generating color percepts—if in fact they can each be assigned to a distinct grouping—is almost entirely unknown. Tantalizing clues suggest that neurons within more anterior regions may be involved in more cognitive phenomena, such as color categorization (Koida & Komatsu, 2007), while neurons in more posterior parts of IT may be implicated in coding basic dimensions of color, such as hue, saturation and brightness (Stoughton & Conway, 2008; Conway & Stoughton, 2009; Conway & Tsao, 2009). Functional MRI is proving to be a valuable tool in bridging the gap between the fine-scale spatial organization discernible with micro-electrode recording and the broad regional specialization that may comprise a more fundamental organization of IT.
The response of V4/PIT glob cells to cone-isolating stimuli has not been systematically tested. In preliminary unpublished studies of the author, few neurons responded well to such stimuli. The cone-isolating stimuli comprise only six colors: L+, L-, M+, M-, S+ and S-. These appear as reddish (L+, M-), greenish (M+, L-), lavender (S+) and lime (S-). The conclusion from the preliminary work was this: if the color preference of the neurons did not align with the color of the cone-isolating stimuli, the responses to the cone-isolating stimuli were not striking. However, in situations where the color preference of the neuron did align with the colors of the cone-isolating stimuli, responses could be strong (Figure 8). Such a pattern of responses is not expected of a system in which a cell's color tuning is achieved by a linear sum of the underlying subcortical channels: in such a linear system, a color cell whose optimal tuning falls intermediate to the cardinal mechanisms would be substantially driven by either cardinal mechanism alone. The narrow response selectivity found in PIT/V4 can be attributed to an increase in the non-linearity of the chromatic tuning of neurons at progressively higher stages in the visual system. This increase in non-linearity is one clue that the neurons are specialized for hue, and suggests the computational algorithm that the brain uses to represent color at this stage (an “interval” code, described below). An additional clue that the neurons may represent a link between neural activity and perception is given by the cell whose responses are shown in Figure 8: this neuron responded optimally to greenish colors, regardless whether these colors were produced by M+ or L- or S-. This is unlike the vast majority of cone-opponent neurons of V1, described above, in which the responses to S typically align in space and sign with those to M. In V1, the response pattern is paradoxical since the colors associated with “M-” and “S-” are categorically different (Figure 2A, note the inset showing the color of the stimulus). These results suggest that a critical transformation of color signals has taken place between V1 and PIT: in V1, color signals can be meaningfully captured by a cone-based (or cone-opponent-based) space, while in PIT they are better captured by a hue (perception)-based space.
Figure 8.
Cone inputs to a green-tuned glob cell in PIT. A, Orientation tuning (max. 2 spikes/sec.) B, Color tuning (thick, medium and thin lines show tuning to higher, equal-with-background and lower luminance stimuli). C, L, M and S cone inputs. Compare with V1 cell (Fig. 2). Unpublished data of the author; see (Conway et al., 2007).
One important conclusion from these observations is that the color space used to define the stimuli is critical. One goal of our present work is to use stimuli that sample color spaces with enough density to reveal the underlying geometry of neural color space at various stages in IT, as has been done in V1 (Horwitz & Hass, 2012). The present evidence, accumulated from several labs, suggests that the population bias towards the L-M and S cardinal axes found in the retina and LGN (and partially in V1, (Horwitz & Hass, 2012)) gives way in V4/PIT to a more uniform representation of color space that more directly maps the perceptual color wheel, red-orange-yellow-green-cyan-blue-purple-red (Stoughton & Conway, 2008; Brouwer & Heeger, 2009; Conway & Stoughton, 2009; Conway & Tsao, 2009; Tanigawa et al., 2010). Such a representation may require an additional boost in the representation of S-cone signals. There is some evidence that explicit representations of the complete gamut of perceivable hues is accomplished in V2 (Xiao et al., 2003) or possibly in V1 (Xiao et al., 2007), but the chromatic tuning we measured in color-biased regions of posterior IT shows the most robust augmentation of LGN S-cone signals of any area across the brain (Figure 6D). The chromatic tuning of IT sections located between color-biased globs (PITi) was rather different showing a less striking response to the S-cone axis (Figure 6C).
The role of color-tuned neurons in form perception has been hotly debated (Gegenfurtner & Kiper, 2003; Lennie & Movshon, 2005; Johnson et al., 2008; Conway et al., 2010). Knowledge of spatial scene structure is obviously necessary to assign a color to a given physical region: this is clear in any color-contrast display, in which the color of a patch changes depending on the spatial configuration of the surround (Teufel & Wehrhahn, 2004). Double-opponent cells in V1 seem well equipped to contribute to the computation of spatial color contrast necessary to bring about these contextual effects. But the physiological implementation of other color-shape interactions is less clear. Much effort has been focused on the extent to which color-coding neurons are orientation tuned, since orientation tuning is a metric of shape processing. Within V1, early evidence was taken to imply that double-opponent neurons lacked orientation tuning (although such cells clearly represent something about the “form” of the stimulus, as they possess a spatially opponent receptive field) (Livingstone & Hubel, 1984). Subsequent studies have found orientation tuning amongst color-coding cells in V1 (Conway, 2001; Johnson et al., 2001; Conway & Livingstone, 2006; Johnson et al., 2008). Maps of the 2-D spatial structure of the cone inputs to receptive fields of double-opponent cells reveal clear asymmetries that predict orientation tuning (Conway, 2001; Conway & Livingstone, 2006). For example, the receptive field for the neuron shown in Figure 2 shows asymmetry that predicts a vertical orientation preference. Other examples are given in Conway and Livingstone (2006). The orientation tuning of V1 cone-opponent cells is often only evident when using colored stimuli. A striking example is given in Figure 10 of Conway (2001): that neuron's orientation tuning was clear when using S-cone-isolating bars, and absent when using achromatic bars. Early studies examining the orientation tuning of these neurons typically used achromatic bars, which may account for the conclusion that V1 color cells lacked orientation tuning. Nonetheless, it appears to be the case that the orientation tuning of non-cone-opponent V1 cells is typically stronger than that of overtly cone-opponent V1 cells. Consistent with some role in “form” vision, the color-tuned neurons within PIT/V4 also show orientation tuning preferences (Figure 8A), though as in V1, the orientation preferences are not as striking as for putative non-color-coding (inter-glob) cells (Conway et al., 2007).
An additional hint that neurons in V4/PIT play a role in color perception is provided by their micro-organization (Conway & Tsao, 2009; Tanigawa et al., 2010). Adjacent neurons in V4/PIT often appear to have similar color preferences, and along an electrode penetration, the neurons show systematic shifts in color tuning predicted by the color wheel: purple-tuned cells follow red-tuned cells, which follow orange-tuned cells, etc. (Figure 9). Departures from this systematic organization are correlated with differences in latency of the cells' responses. For example, along the penetration shown in Figure 9, neurons showing color preference to greenish colors had much longer time-to-peak responses. Double-opponent neurons in V1 typically show longer latency in their responses to stimulation of their receptive-field surrounds compared to their centers (see Figure 2B; (Conway & Livingstone, 2006)). The complementary color tuning and delayed nature of the responses of the “outliers” along the penetration shown in Figure 9 might be explained if the receptive-fields of V4/PIT cells show spatial structure like V1 double-opponent cells (and the stimuli activated the surrounds). Nonetheless, the spatial clustering of color-tuned neurons within the V4/PIT globs suggests the cells are organized by “chromotopic” hue maps, a conclusion supported by optical imaging of V4/PIT (Tanigawa et al., 2010).
Figure 9.
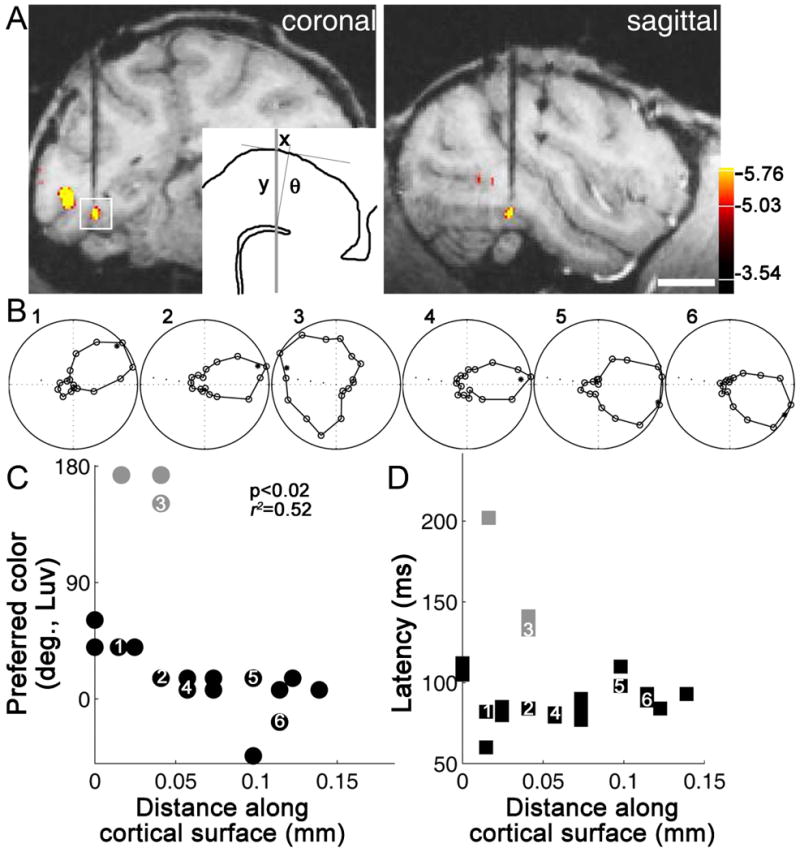
Color-tuned neurons in PIT globs are clustered by color selectivity, and arranged according to “chromatopic” hue maps. A, Anatomical MRI of electrode targeting a color-biased region (glob). Scale, 1cm. B, Color tuning of six sequentially encountered neurons. Polar coordinates as for Figure 8B. C, Color tuning of all neurons encountered along the electrode path. Gray symbols show “outliers”. D, Latency of the responses of the neurons. Data from (Conway & Tsao, 2009).
Conclusive tests of the notion that V4/PIT color-tuned neurons play a direct, causal role in perceiving basic properties of color (hue, saturation, brightness) will require many more careful measurements of the response properties of the cells. Such tests need to use stimuli that densely sample color spaces, to enable a determination of the process by which the cells achieve their color tuning from antecedent stages—it is no longer sufficient to use a limited set of stimuli generated with color filters that appear to the experimenter as “red”, “green”, or “blue” (an approach that was enormously productive in the early days of color neurophysiology!). Preliminary tests using stimuli that densely sample the “DKL” color space, whose axes are defined by the cardinal cone-opponent axes of the LGN (Figure 10A,B), confirm that the V4/PIT color-tuned neurons show color tuning that is largely tolerant not only to changes in luminance, as shown previously (Conway et al., 2007), but also to changes in saturation (inset Figure 10C). One pressing question concerns the mechanisms by which a given neuron achieves simultaneously sensitivity along multiple dimensions of color space (hue, saturation, brightness). Preliminary evidence suggests saturation is encoded by differences in response latency (Figure 10C), although large population studies will be required in order to verify these data.
Figure 10.
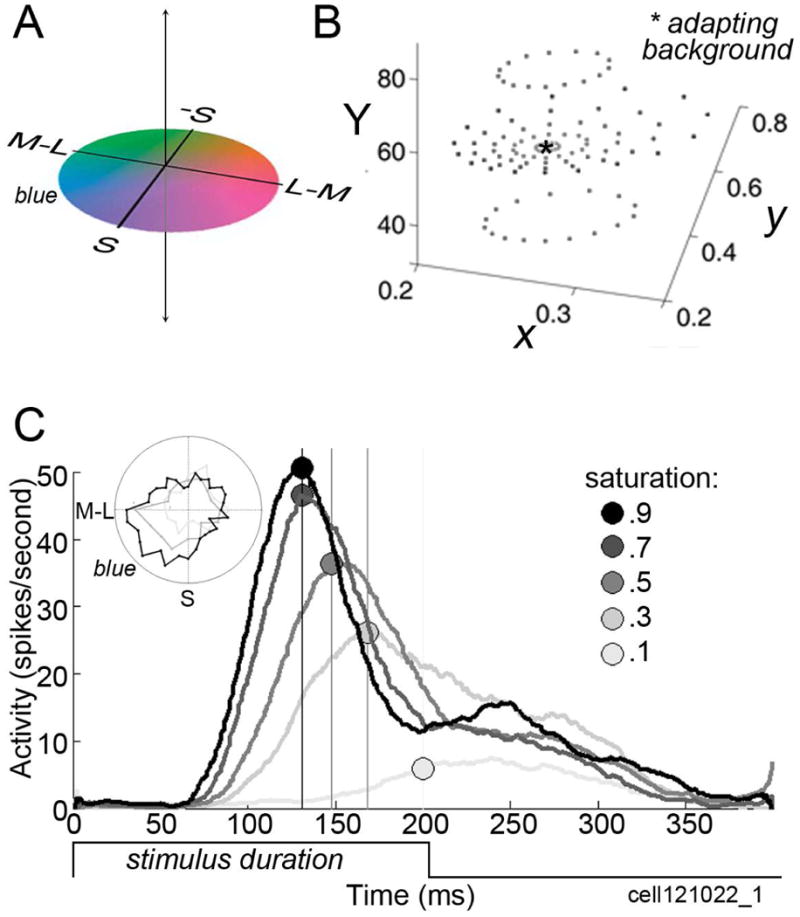
Responses of a blue-tuned cell in PIT assessed using stimuli defined by the cone-opponent axes with which the retina/LGN represent color. A, Cone-opponent “DKL” color space, showing colors in the equiluminant plane at the adaptation point. B, Color stimuli of various saturations and luminance contrasts defined by the cone-opponent color space and projected in the standard C.I.E. xyY chromaticity space. C, Response of one color-tuned neuron to stimuli of varying saturation. Latencies (symbols) are systematically longer with lower saturation stimuli (responses at each saturation averaged across colors; colors defined within the equiluminant plane defined by the adapting background). Inset shows color tuning measured at three saturation levels. Figure prepared by Monica Gates and Galina Gagin (Unpublished data of the author).
It has long been recognized that the perceptual-cognitive color coordinates characterized by Hering (red, green, blue, yellow) are not generated in the retina or LGN, and likely not in V1, but beyond (De Valois & De Valois, 1993; Webster, 1996; Webster et al., 2000; Conway, 2009). An early analysis of the responses of color-tuned neurons in V4/PIT suggested that this group of neurons may be the neural basis for these elementary color categories (Stoughton & Conway, 2008). Following previous studies (Komatsu et al., 1992; Moutoussis & Zeki, 2002), Stoughton and Conway (2008) defined stimuli using the standard C.I.E. color space, densely sampling the maximum saturation of the monitor gamut. Colors within this stimulus set vary in both saturation and hue (monitors can produce more saturated reds than yellows). The chromatic tuning of the population of IT cells shows clear deviations from that predicted by the cone-opponent groupings of the LGN, and to date is the population that most closely approximates perceptual color space (Conway & Stoughton, 2009; Conway & Tsao, 2009) (Figure 6D). But the biases within the population towards certain colors reported by Stoughton and Conway (2008) appear to reflect, at least in part, the use of a stimulus set that confounds saturation and hue (Conway & Stoughton, 2009; Mollon, 2009). This conclusion will be confirmed with further tests documenting that color-tuned neurons in V4/PIT are sensitive to saturation (see Figure 10C). The upshot is that the neural basis for the “unique hues” remains a mystery, one that may be resolved by studying the tuning properties within more anterior regions of IT or possibly frontal cortex. Similarly, a neural basis for the reddish quality of short wavelength light has proven elusive. But one mystery close to resolution is that by the time color signals arrive at V4/PIT, they can no longer be adequately described by linear sums of the cone responses. The activity of the neurons within this stage, and presumably stages further anterior to it, are better approximated by perceptual color spaces (Brouwer & Heeger, 2009) than by cone-opponent spaces. Thus, by posterior IT, the notion of an “S-cone signal” divorced from the color percept such a signal elicits may be meaningless.
Questions of Perception
As described above, responses to S-cone activation are often used as an indication that the neuron (or brain region) under investigation is involved in color perception. This logic has been complicated by the observation of S-cone responses in brain areas not typically thought to be involved in color, such as MT and the luminance-biased regions of IT. Responses within these regions to S-cone signals could help to encode global scene structure: S-cone signals would confer sensitivity to shadows, a potent cue to scene structure (Lafer-Sousa et al., 2012). Moreover, we emphasize that not all color signals are used to encode hue: some color signals could be important in defining an object boundary independently of the colors forming the boundary (Conway & Livingstone, 2006). These observations support the idea that “color perception” likely comprises at least two distinct sub-modalities, color sensitivity and color selectivity; these abilities likely serve different functions and are encoded by different circuits (although color-selective cells are also, of course, color-sensitive). A neuron may be sensitive to an equiluminant bar (e.g. a colored bar on a differently colored background) but not selective for the color of the bar, as is often the case in V1 (Thorell et al., 1984). The existence of color sensitivity without color selectivity is predicted by known properties of LGN cells and the way in which these cells are thought to wire up to form V1 receptive fields (Conway & Livingstone, 2006). Computation of object shape and object motion would benefit from sensitivity to S-cone signals, even if these signals are only encoding the presence of a hue boundary rather than that boundary's hue make-up. For example, the hues of camouflaged objects are often not informative of the object's overall shape, but the boundaries formed by the various hues of the object and the hues of the background can be informative (see Figure 4 in Conway, 2009). Paradoxically, a system selective for hue would be impaired in extracting this kind of object-boundary information. Thus, responses to S-cone signals may not be a reliable indicator of a neuron or area's involvement in color perception commonly defined.
Two general models of how one could achieve a perceptual representation of color space are a population code, which needs at minimum two groups of color-tuned neurons paired with a weighted-average rule, and an interval code, which requires a population of cells with sharp chromatic tuning that together encompass all color space coupled with a winner-take-all rule. These models are borrowed from those developed to account for the role of MT neurons in motion perception (Salzman & Newsome, 1994). The present evidence suggests subcortical stages represent color with a population code, while cortical (especially extrastriate) stages represent color with an interval code. Following the cone signals “bottom up”, the neural representation of color is first transformed to a space encoded by the retinal ganglion cells (established by the bipolar cells and evident in the lateral geniculate nucleus) that is defined by the cardinal chromatic axes, which are characterized by the two cone-opponent pairs, L-M and S-(L+M). Stimuli defined by such a cone-opponent space (as in Figures 5&6&10) were initially developed by Donald Macleod (MacLeod & Boynton, 1979), and have been enormously useful in measuring neural color tuning (Krauskopf et al., 1982; Derrington et al., 1984; Krauskopf et al., 1986; Lennie et al., 1990; Lennie & Movshon, 2005). Cone-opponent spaces are typically depicted as spheres, although their true geometry is contingent on the instrument used to generate them (such as the phosphor guns on a CRT monitor). Stimuli depicted along the vertical axis correspond to variations in brightness from the mean neutral (gray) adaptation point stipulated as the center of the sphere; any given horizontal slice through the space is defined by the two cardinal axes and consists of equiluminant colors that increase in saturation along the radius and vary continuously along the azimuth according to the standard perceptual color wheel (Figure 10A,B).
In the retina and LGN the population shows two peaks in its color tuning, aligned with the L-M and S-(L+M) cardinal axes (Derrington et al., 1984). This suggests that neurons within the LGN encode color by using a population code defined by these axes. According to this model, a color is a vector pointing from the origin of the color wheel to the specific hue; this vector is accurately described by relative weights of activity along the “x” and “y” axes (represented by the two populations of color-tuned neurons in the LGN) whose intersection sits at the center of the color wheel. A given color percept would be encoded not by the activity of a single population of neurons with the corresponding color-tuning, but rather by the combined weighted-average activity of both populations of neurons.
In contrast, the tuning within the color-biased globs of PIT/V4 suggest the population encodes color by way of an interval code, in which distinct perceptual experiences would be elicited by the activity of a discrete population of neurons with the corresponding color tuning. According to this hypothesis, the population would need to comprise a balanced representation of color-tuned neurons, balanced in such a way as to reflect the relative perceptual salience of colors across the color wheel. The S cone signals that make their way to cortical neurons primarily involved with hue perception (that is, color selectivity) seem essential for the population of such neurons to fully represent perceptual color space: S-cone activation is necessary to extend the space into the blues (and yellows). Cone (or cone-opponent) activations do not map linearly onto perceptual color spaces (Brainard & Stockman, 2010; Stockman & Brainard, 2010). The problem of how the brain encodes hues is therefore one that requires an understanding of how the neural circuitry performs a transformation of cone signals into signals that correlate with perception—transforming a representation from a population code to an interval code. [Although we note that extrastriate regions likely employ the whole population of interval-coding neurons to represent a percept.] One can approach this problem by tracing the cone signals through the visual pathway, starting at the retina, to investigate successive stages using stimuli defined by cone activations. Additionally, one could dig the tunnel from the other end, by asking which brain regions possess a representation that most closely reflects perceptual color space. This latter approach may be especially useful in identifying the brain structures downstream of V1 that are involved in color perception (Brouwer & Heeger, 2009) (Figure 6).
As alluded to above, cone-opponent spaces are not the best representation of perceptual color space. The spaces do not include the richest, most saturated focal colors a given display can generate, and any equiluminant plane through the space will preserve either a decent blue or a decent yellow but not both. These limitations arise in part because of inadequacies of monitors used to generate the stimuli and in part because the use of the cone-opponent axes limits saturation. Cone-opponent spaces have another limitation: they pretend to possess a meaningful relationship between increments along the three dimensions (hue, saturation, brightness) even though these relationships are not formally defined. Put another way, how do you transform a given increase along the saturation dimension into a comparable increase in the brightness or hue dimension? The question may seem absurd, but it was directly taken up by the artist Albert Munsell (Munsell, 1907), who in the early 20th century set about to mix colors that captured a uniform representation of the three dimensions of color space with pigments available at the time (Figure 11). Observers are remarkably consistent in making these color assignments, and the space is still widely used as the industry standard in communicating product colors. The space is an empirically determined representation of the geometry of color space that must, presumably, have some neural underpinning. But it is almost entirely unknown where this representation resides, or how this representation is computed from the retinal (or cone-opponent) coordinates that serve as the basis for color (Conway & Livingstone, 2005; Romney & D'Andrade, 2005;Romney et al., 2005). The discovery of color-biased regions within IT, which likely carry a neural correlate of perceived color, makes this question tractable.
Figure 11.

Munsell color system of perceptual color space. A, From Munsell (1907): “The color tree is made by taking the vertical axis of the [color] sphere, which carries a scale of value [brightness or luminance], for the trunk. The branches are at right angles to the trunk; and, as in the sphere, they carry the scale of chroma [saturation]. Colored balls on the branches tell their Hue. In order to show the MAXIMA of color, each branch is attached to the trunk (or neutral axis) at a level demanded by its value,—the yellow nearest white at the top, then the green, red, blue, and purple branches, approaching black in the order of their lower values. The color tree prolongs [the chroma axes to represent] the most powerful red, yellow, green, blue, and purple pigments which we now possess, and could be lengthened, should stronger chromas be discovered.” B, A horizontal plane through the Munsell system showing the non-spherical nature of the color plane. C, A color plate from Munsell's original book, showing The color sphere (top), fifteen typical steps taken from the sphere (middle), and the value and chroma scale (bottom). As Munsell noted, “Pigment inequalities here become very apparent.”
One curious feature of the Munsell space is the displacement along the vertical axis of focal yellow and focal blue: yellow is above the center of the volume and blue is below it. This shows that yellow is necessarily brighter than blue, and is why any given equiluminant plane of DKL space does not capture satisfactorily both yellow and blue. This observation, coupled with the fact that S-cones are required to generate blue (and yellow), implicates S-cones in calculations of illumination (Wagner & Boynton, 1972; Parraga et al., 2002). This conclusion may be surprising given considerable psychophysical work (and broad consensus) showing that modulation in S-cones does not give rise to luminance contrast; the implication is that S-cones provide a cue to illumination divorced from luminance contrast. What is the role of the illumination-sensitivity of the S-cone system? Fourier analysis of the “red-green” chromatic component of images of objects embedded in natural scenes (viewed at grasping distances) tend to have lots of power in low spatial frequencies, which matches predictions based on known properties of the human visual system. But an analysis of natural scenes containing objects shows no bias for low spatial frequencies of blue-yellow, even though psychophysical observations show that the S-cone system also has a low-pass transfer characteristic. The apparent mis-match between the low-pass sensitivity of the S-cone system and the lack of low-pass bias in the S-component of natural images would seem to run counter to the prevailing view that the visual system is optimized to the conditions of natural viewing. The present arguments provide a parsimonious resolution if the S-cone system evolved in part to detect illumination. Illumination will generate shadows; scenes containing shadows when surveyed, rather than viewed at close range as during grasping, will be rich in low spatial frequencies along the blue-yellow axis, thus matching the low-spatial frequency tuning of the S-cone system. This may partially resolve the paradox of the responses to S-cones of both dorsal areas (like MT) and non-color regions in IT: the signals within these areas may be used not for computations of color but of illumination, which may provide an important cue to motion and scene. The contribution of S-cones to illumination may also help explain another perceptual paradox: a yellow patch painted on white paper appears brighter than the paper itself, even though the painted surface has lower luminance.
Table 1.
Cone Contrasts of the Stimuli Used in the fMRI Experiments (see Lafer-Sousa et al., 2012, for details).
| L | M | S | total cone contrast (L+M+S) | |
|---|---|---|---|---|
| red-green | 0.065 | 0.127 | 0.002 | 0.194 |
| blue-yellow | 0.01 | 0.009 | 0.784 | 0.803 |
| orange-cyan | 0.047 | 0.088 | 0.563 | 0.698 |
| lime-magenta | 0.045 | 0.092 | 0.557 | 0.694 |
Acknowledgments
I am grateful to Erin Yeagle, Monica Gates and Jane Qu for comments on the manuscript, and to Anya Hurlbert for useful discussions. The original fMRI experiments were conducted with Rosa Lafer-Sousa. I thank Monica Gates and Galina Gagin for generating Figure 10. The work was supported by NSF (0918064) and NIH (EY023322).
References
- Barberini CL, Cohen MR, Wandell BA, Newsome WT. Cone signal interactions in direction-selective neurons in the middle temporal visual area (MT) J Vis. 2005;5:603–621. doi: 10.1167/5.7.1. [DOI] [PubMed] [Google Scholar]
- Baylor DA, Nunn BJ, Schnapf JL. Spectral sensitivity of cones of the monkey Macaca fascicularis. Journal of Physiology. 1987;390:145–160. doi: 10.1113/jphysiol.1987.sp016691. [DOI] [PMC free article] [PubMed] [Google Scholar]
- Brainard DH, Stockman A. Colorimetry. In: Bass M, editor. OSA Handbook of Optics. 3rd. McGraw-Hill; New York: 2010. pp. 10.11–11.56. [Google Scholar]
- Brouwer GJ, Heeger DJ. Decoding and reconstructing color from responses in human visual cortex. J Neurosci. 2009;29:13992–14003. doi: 10.1523/JNEUROSCI.3577-09.2009. [DOI] [PMC free article] [PubMed] [Google Scholar]
- Calkins DJ, Tsukamoto Y, Sterling P. Microcircuitry and mosaic of a blue-yellow ganglion cell in the primate retina. Journal of Neuroscience. 1998;18:3373–3385. doi: 10.1523/JNEUROSCI.18-09-03373.1998. [DOI] [PMC free article] [PubMed] [Google Scholar]
- Cavanagh P. All's jazzy and unstable on the colour front: the impact of Gregory's pioneering paper on vision at equiluminance. Perception. 2009;38:831–832. discussion 836. [PMC free article] [PubMed] [Google Scholar]
- Chatterjee S, Callaway EM. S cone contributions to the magnocellular visual pathway in macaque monkey. Neuron. 2002;35:1135–1146. doi: 10.1016/s0896-6273(02)00874-7. [DOI] [PubMed] [Google Scholar]
- Conway BR. Spatial structure of cone inputs to color cells in alert macaque primary visual cortex (V-1) Journal of Neuroscience. 2001;21:2768–2783. doi: 10.1523/JNEUROSCI.21-08-02768.2001. [DOI] [PMC free article] [PubMed] [Google Scholar]
- Conway BR. Color vision, cones, and color-coding in the cortex. Neuroscientist. 2009;15:274–290. doi: 10.1177/1073858408331369. [DOI] [PubMed] [Google Scholar]
- Conway BR, Chatterjee S, Field GD, Horwitz GD, Johnson EN, Koida K, Mancuso K. Advances in color science: from retina to behavior. Journal of Neuroscience. 2010;30:14955–14963. doi: 10.1523/JNEUROSCI.4348-10.2010. [DOI] [PMC free article] [PubMed] [Google Scholar]
- Conway BR, Hubel DH, Livingstone MS. Color contrast in macaque V1. Cereb Cortex. 2002;12:915–925. doi: 10.1093/cercor/12.9.915. [DOI] [PubMed] [Google Scholar]
- Conway BR, Livingstone MS. A different point of hue. Proc Natl Acad Sci U S A. 2005;102:10761–10762. doi: 10.1073/pnas.0504742102. [DOI] [PMC free article] [PubMed] [Google Scholar]
- Conway BR, Livingstone MS. Spatial and temporal properties of cone signals in alert macaque primary visual cortex. Journal of Neuroscience. 2006;26:10826–10846. doi: 10.1523/JNEUROSCI.2091-06.2006. [DOI] [PMC free article] [PubMed] [Google Scholar]
- Conway BR, Moeller S, Tsao DY. Specialized color modules in macaque extrastriate cortex. Neuron. 2007;56:560–573. doi: 10.1016/j.neuron.2007.10.008. [DOI] [PMC free article] [PubMed] [Google Scholar]
- Conway BR, Stoughton CM. Towards a neural representation for unique hues. Current Biology. 2009;19:R442–443. [Google Scholar]
- Conway BR, Tsao DY. Color architecture in alert macaque cortex revealed by FMRI. Cereb Cortex. 2006;16:1604–1613. doi: 10.1093/cercor/bhj099. [DOI] [PMC free article] [PubMed] [Google Scholar]
- Conway BR, Tsao DY. Color-tuned neurons are spatially clustered according to color preference within alert macaque posterior inferior temporal cortex. Proceedings of the National Academy of Science (USA) 2009;106:18034–18039. doi: 10.1073/pnas.0810943106. [DOI] [PMC free article] [PubMed] [Google Scholar]
- Cottaris NP, De Valois RL. Temporal dynamics of chromatic tuning in macaque primary visual cortex [see comments] Nature. 1998;395:896–900. doi: 10.1038/27666. [DOI] [PubMed] [Google Scholar]
- Curcio CA, Sloan KR, Kalina RE, Hendrickson AE. Human photoreceptor topography. J Comp Neurol. 1990;292:497–523. doi: 10.1002/cne.902920402. [DOI] [PubMed] [Google Scholar]
- D'Souza DV, Auer T, Strasburger H, Frahm J, Lee BB. Temporal frequency and chromatic processing in humans: an fMRI study of the cortical visual areas. J Vis. 2011;11 doi: 10.1167/11.8.8. [DOI] [PubMed] [Google Scholar]
- Dacey DM. Circuitry for color coding in the primate retina. Proceedings of the National Academy of Sciences of the United States of America. 1996;93:582–588. doi: 10.1073/pnas.93.2.582. [DOI] [PMC free article] [PubMed] [Google Scholar]
- Dacey DM, Crook JD, Packer OS. Distinct synaptic mechanisms create parallel S-ON and S-OFF color opponent pathways in the primate retina. Vis Neurosci. 2013:1–13. doi: 10.1017/S0952523813000230. [DOI] [PMC free article] [PubMed] [Google Scholar]
- Dacey DM, Lee BB. The ‘blue-on’ opponent pathway in primate retina originates from a distinct bistratified ganglion cell type. Nature. 1994;367:731–735. doi: 10.1038/367731a0. [DOI] [PubMed] [Google Scholar]
- De Valois RL, De Valois KK. A multi-stage color model. Vision Research. 1993;33:1053–1065. doi: 10.1016/0042-6989(93)90240-w. [DOI] [PubMed] [Google Scholar]
- Derrington AM, Krauskopf J, Lennie P. Chromatic mechanisms in lateral geniculate nucleus of macaque. Journal of Physiology. 1984;357:241–265. doi: 10.1113/jphysiol.1984.sp015499. [DOI] [PMC free article] [PubMed] [Google Scholar]
- DiCarlo JJ, Zoccolan D, Rust NC. How does the brain solve visual object recognition? Neuron. 2012;73:415–434. doi: 10.1016/j.neuron.2012.01.010. [DOI] [PMC free article] [PubMed] [Google Scholar]
- Dobkins KR, Albright TD. What happens if it changes color when it moves?: psychophysical experiments on the nature of chromatic input to motion detectors. Vision Res. 1993;33:1019–1036. doi: 10.1016/0042-6989(93)90238-r. [DOI] [PubMed] [Google Scholar]
- Dobkins KR, Albright TD. What happens if it changes color when it moves?: the nature of chromatic input to macaque visual area MT. J Neurosci. 1994;14:4854–4870. doi: 10.1523/JNEUROSCI.14-08-04854.1994. [DOI] [PMC free article] [PubMed] [Google Scholar]
- Dougherty RF, Press WA, Wandell BA. Perceived speed of colored stimuli. Neuron. 1999;24:893–899. doi: 10.1016/s0896-6273(00)81036-3. [DOI] [PubMed] [Google Scholar]
- Engel S, Zhang X, Wandell B. Colour tuning in human visual cortex measured with functional magnetic resonance imaging [see comments] Nature. 1997;388:68–71. doi: 10.1038/40398. [DOI] [PubMed] [Google Scholar]
- Forte JD, Blessing EM, Buzas P, Martin PR. Contribution of chromatic aberrations to color signals in the primate visual system. J Vis. 2006;6:97–105. doi: 10.1167/6.2.1. [DOI] [PubMed] [Google Scholar]
- Gegenfurtner KR, Kiper DC. Color vision. Annu Rev Neurosci. 2003;26:181–206. doi: 10.1146/annurev.neuro.26.041002.131116. [DOI] [PubMed] [Google Scholar]
- Gegenfurtner KR, Kiper DC, Beusmans JM, Carandini M, Zaidi Q, Movshon JA. Chromatic properties of neurons in macaque MT. Vis Neurosci. 1994;11:455–466. doi: 10.1017/s095252380000239x. [DOI] [PubMed] [Google Scholar]
- Ghose GM, Ts'o DY. Form processing modules in primate area V4. Journal of Neurophysiology. 1997;77:2191–2196. doi: 10.1152/jn.1997.77.4.2191. [DOI] [PubMed] [Google Scholar]
- Goddard E, Mannion DJ, McDonald JS, Solomon SG, Clifford CW. Combination of subcortical color channels in human visual cortex. J Vis. 2010;10:25. doi: 10.1167/10.5.25. [DOI] [PubMed] [Google Scholar]
- Gregory RL. Vision with isoluminant colour contrast: 1.A projection technique and observations. Perception. 1977;6:113–119. doi: 10.1068/p060113. [DOI] [PubMed] [Google Scholar]
- Gregory RL, Heard PF. Visual dissociations of movement, position, and stereo depth: some phenomenal phenomena. Q J Exp Psychol A. 1983;35:217–237. doi: 10.1080/14640748308402127. [DOI] [PubMed] [Google Scholar]
- Harada T, Goda N, Ogawa T, Ito M, Toyoda H, Sadato N, Komatsu H. Distribution of colour-selective activity in the monkey inferior temporal cortex revealed by functional magnetic resonance imaging. Eur J Neurosci. 2009;30:1960–1970. doi: 10.1111/j.1460-9568.2009.06995.x. [DOI] [PubMed] [Google Scholar]
- Horwitz GD, Hass CA. Nonlinear analysis of macaque V1 color tuning reveals cardinal directions for cortical color processing. Nat Neurosci. 2012;15:913–919. doi: 10.1038/nn.3105. [DOI] [PMC free article] [PubMed] [Google Scholar]
- Hubel D, Livingstone M. Color puzzles. Cold Spring Harbor Symposia on Quantitative Biology. 1990;55:643–649. doi: 10.1101/sqb.1990.055.01.061. [DOI] [PubMed] [Google Scholar]
- Ingling CR., Jr The spectral sensitivity of the opponent-color channels. Vision Research. 1977;17:1083–1089. doi: 10.1016/0042-6989(77)90014-1. [DOI] [PubMed] [Google Scholar]
- Johnson EN, Hawken MJ, Shapley R. The spatial transformation of color in the primary visual cortex of the macaque monkey. Nature Neuroscience. 2001;4:409–416. doi: 10.1038/86061. [DOI] [PubMed] [Google Scholar]
- Johnson EN, Hawken MJ, Shapley R. Cone inputs in macaque primary visual cortex. J Neurophysiol. 2004;91:2501–2514. doi: 10.1152/jn.01043.2003. [DOI] [PubMed] [Google Scholar]
- Johnson EN, Hawken MJ, Shapley R. The orientation selectivity of color-responsive neurons in macaque V1. J Neurosci. 2008;28:8096–8106. doi: 10.1523/JNEUROSCI.1404-08.2008. [DOI] [PMC free article] [PubMed] [Google Scholar]
- Katsuyama N, Imamura K, Onoe H, Tanaka HK, Onoe K, Tsukada H, Watanabe Y. Cortical activation during color discrimination task in macaques as revealed by positron emission tomography. Neurosci Lett. 2010;484:168–173. doi: 10.1016/j.neulet.2010.08.040. [DOI] [PubMed] [Google Scholar]
- Klug K, Herr S, Ngo IT, Sterling P, Schein S. Macaque retina contains an S-cone OFF midget pathway. J Neurosci. 2003;23:9881–9887. doi: 10.1523/JNEUROSCI.23-30-09881.2003. [DOI] [PMC free article] [PubMed] [Google Scholar]
- Koida K, Komatsu H. Effects of task demands on the responses of color-selective neurons in the inferior temporal cortex. Nat Neurosci. 2007;10:108–116. doi: 10.1038/nn1823. [DOI] [PubMed] [Google Scholar]
- Komatsu H, Ideura Y, Kaji S, Yamane S. Color selectivity of neurons in the inferior temporal cortex of the awake macaque monkey. Journal of Neuroscience. 1992;12:408–424. doi: 10.1523/JNEUROSCI.12-02-00408.1992. [DOI] [PMC free article] [PubMed] [Google Scholar]
- Krauskopf J, Williams DR, Heeley DW. Cardinal directions of color space. Vision Research. 1982;22:1123–1131. doi: 10.1016/0042-6989(82)90077-3. [DOI] [PubMed] [Google Scholar]
- Krauskopf J, Williams DR, Mandler MB, Brown AM. Higher order color mechanisms. Vision Res. 1986;26:23–32. doi: 10.1016/0042-6989(86)90068-4. [DOI] [PubMed] [Google Scholar]
- Kravitz DJ, Saleem KS, Baker CI, Mishkin M. A new neural framework for visuospatial processing. Nat Rev Neurosci. 2011;12:217–230. doi: 10.1038/nrn3008. [DOI] [PMC free article] [PubMed] [Google Scholar]
- Kravitz DJ, Saleem KS, Baker CI, Ungerleider LG, Mishkin M. The ventral visual pathway: an expanded neural framework for the processing of object quality. Trends Cogn Sci. 2012;17:26–49. doi: 10.1016/j.tics.2012.10.011. [DOI] [PMC free article] [PubMed] [Google Scholar]
- Lafer-Sousa R, Liu YO, Lafer-Sousa L, Wiest MC, Conway BR. Color tuning in alert macaque V1 assessed with fMRI and single-unit recording shows a bias toward daylight colors. J Opt Soc Am A Opt Image Sci Vis. 2012;29:657–670. doi: 10.1364/JOSAA.29.000657. [DOI] [PubMed] [Google Scholar]
- Lennie P, Krauskopf J, Sclar G. Chromatic mechanisms in striate cortex of macaque. Journal of Neuroscience. 1990;10:649–669. doi: 10.1523/JNEUROSCI.10-02-00649.1990. [DOI] [PMC free article] [PubMed] [Google Scholar]
- Lennie P, Movshon JA. Coding of color and form in the geniculostriate visual pathway (invited review) J Opt Soc Am A Opt Image Sci Vis. 2005;22:2013–2033. doi: 10.1364/josaa.22.002013. [DOI] [PubMed] [Google Scholar]
- Liu J, Wandell BA. Specializations for chromatic and temporal signals in human visual cortex. J Neurosci. 2005;25:3459–3468. doi: 10.1523/JNEUROSCI.4206-04.2005. [DOI] [PMC free article] [PubMed] [Google Scholar]
- Livingstone MS, Hubel DH. Anatomy and physiology of a color system in the primate visual cortex. Journal of Neuroscience. 1984;4:309–356. doi: 10.1523/JNEUROSCI.04-01-00309.1984. [DOI] [PMC free article] [PubMed] [Google Scholar]
- Lueck CJ, Zeki S, Friston KJ, Deiber MP, Cope P, Cunningham VJ, Lammertsma AA, Kennard C, Frackowiak RS. The colour centre in the cerebral cortex of man. Nature. 1989;340:386–389. doi: 10.1038/340386a0. [DOI] [PubMed] [Google Scholar]
- MacLeod DI, Boynton RM. Chromaticity diagram showing cone excitation by stimuli of equal luminance. J Opt Soc Am. 1979;69:1183–1186. doi: 10.1364/josa.69.001183. [DOI] [PubMed] [Google Scholar]
- Martin PR, White AJ, Goodchild AK, Wilder HD, Sefton AE. Evidence that blue-on cells are part of the third geniculocortical pathway in primates. European Journal of Neuroscience. 1997;9:1536–1541. doi: 10.1111/j.1460-9568.1997.tb01509.x. [DOI] [PubMed] [Google Scholar]
- Matsumora T, Koida K, Komatsu H. Relationship between color discrimination and neural responses in the inferior temporal cortex of the monkey. J Neurophysiol. 2008;100:3361–3374. doi: 10.1152/jn.90551.2008. [DOI] [PubMed] [Google Scholar]
- Mollon JD. A neural basis for unique hues? Curr Biol. 2009;19:R441–442. doi: 10.1016/j.cub.2009.05.008. author reply R442-443. [DOI] [PubMed] [Google Scholar]
- Moutoussis K, Zeki S. Responses of spectrally selective cells in macaque area V2 to wavelengths and colors. Journal of Neurophysiology. 2002;87:2104–2112. doi: 10.1152/jn.00248.2001. [DOI] [PubMed] [Google Scholar]
- Mullen KT, Dumoulin SO, Hess RF. Color responses of the human lateral geniculate nucleus: [corrected] selective amplification of S-cone signals between the lateral geniculate nucleno and primary visual cortex measured with high-field fMRI. Eur J Neurosci. 2008;28:1911–1923. doi: 10.1111/j.1460-9568.2008.06476.x. [DOI] [PMC free article] [PubMed] [Google Scholar]
- Mullen KT, Thompson B, Hess RF. Responses of the human visual cortex and LGN to achromatic and chromatic temporal modulations: an fMRI study. J Vis. 2010;10:13. doi: 10.1167/10.13.13. [DOI] [PubMed] [Google Scholar]
- Munsell AH. A Color Notation, a measured color system, based on the three qualities Hue, Value, and Chroma. 2nd. Boston: Geo H Ellis Co; 1907. [Google Scholar]
- Parraga CA, Troscianko T, Tolhurst DJ. Spatiochromatic properties of natural images and human vision. Curr Biol. 2002;12:483–487. doi: 10.1016/s0960-9822(02)00718-2. [DOI] [PubMed] [Google Scholar]
- Percival KA, Jusuf PR, Martin PR, Grunert U. Synaptic inputs onto small bistratified (blue-ON/yellow-OFF) ganglion cells in marmoset retina. J Comp Neurol. 2009;517:655–669. doi: 10.1002/cne.22183. [DOI] [PubMed] [Google Scholar]
- Reid CR, Hendry SHC. The koniocellular pathway in primate vision. Annu Rev Neurosci. 2000;23:127–153. doi: 10.1146/annurev.neuro.23.1.127. [DOI] [PubMed] [Google Scholar]
- Reid RC, Shapley RM. Space and time maps of cone photoreceptor signals in macaque lateral geniculate nucleus. J Neurosci. 2002;22:6158–6175. doi: 10.1523/JNEUROSCI.22-14-06158.2002. [DOI] [PMC free article] [PubMed] [Google Scholar]
- Riecansky I, Thiele A, Distler C, Hoffmann KP. Chromatic sensitivity of neurones in area MT of the anaesthetised macaque monkey compared to human motion perception. Exp Brain Res. 2005;167:504–525. doi: 10.1007/s00221-005-0058-2. [DOI] [PubMed] [Google Scholar]
- Roe AW, Chelazzi L, Connor CE, Conway BR, Fujita I, Gallant J, Lu HD, Vanduffel W. Towards a unified theory of visual area V4. Neuron. 2012;74:12–29. doi: 10.1016/j.neuron.2012.03.011. [DOI] [PMC free article] [PubMed] [Google Scholar]
- Romney AK, D'Andrade RG. Modeling lateral geniculate nucleus cell response spectra and Munsell reflectance spectra with cone sensitivity curves. Proc Natl Acad Sci U S A. 2005;102:16512–16517. doi: 10.1073/pnas.0508172102. [DOI] [PMC free article] [PubMed] [Google Scholar]
- Romney AK, D'Andrade RG, Indow T. The distribution of response spectra in the lateral geniculate nucleus compared with reflectance spectra of Munsell color chips. Proc Natl Acad Sci U S A. 2005;102:9720–9725. doi: 10.1073/pnas.0503887102. [DOI] [PMC free article] [PubMed] [Google Scholar]
- Roorda A, Metha AB, Lennie P, Williams DR. Packing arrangement of the three cone classes in primate retina. Vision Res. 2001;41:1291–1306. doi: 10.1016/s0042-6989(01)00043-8. [DOI] [PubMed] [Google Scholar]
- Salzman CD, Newsome WT. Neural mechanisms for forming a perceptual decision. Science. 1994;264:231–237. doi: 10.1126/science.8146653. [DOI] [PubMed] [Google Scholar]
- Sciretta P. Orange/Blue Contrast in Movie Posters. 2009 http://ohnotheydidnt.livejournal.com/41879586.html.
- Seidemann E, Poirson AB, Wandell BA, Newsome WT. Color signals in area MT of the macaque monkey. Neuron. 1999;24:911–917. doi: 10.1016/s0896-6273(00)81038-7. [DOI] [PubMed] [Google Scholar]
- Sincich LC, Park KF, Wohlgemuth MJ, Horton JC. Bypassing V1: a direct geniculate input to area MT. Nat Neurosci. 2004;7:1123–1128. doi: 10.1038/nn1318. [DOI] [PubMed] [Google Scholar]
- Snodderly DM, Brown PK, Delori FC, Auran JD. The macular pigment. I. Absorbance spectra, localization, and discrimination from other yellow pigments in primate retinas. Investigative Ophthalmology & Visual Science. 1984;25:660–673. [PubMed] [Google Scholar]
- Stockman A, Brainard DH. Color vision mechanisms. In: Bass M, editor. OSA Handbook of Optics. 3rd. McGraw-Hill; New York: 2010. pp. 11.11–11.104. [Google Scholar]
- Stoughton CM, Conway BR. Neural basis for unique hues. Current Biology. 2008;18:R698–R699. doi: 10.1016/j.cub.2008.06.018. [DOI] [PubMed] [Google Scholar]
- Stoughton CM, Lafer-Sousa R, Gagin G, Conway BR. Psychophysical chromatic mechanisms in macaque monkey. J Neurosci. 2012;32:15216–15226. doi: 10.1523/JNEUROSCI.2048-12.2012. [DOI] [PMC free article] [PubMed] [Google Scholar]
- Sun H, Smithson HE, Zaidi Q, Lee BB. Specificity of cone inputs to macaque retinal ganglion cells. J Neurophysiol. 2006;95:837–849. doi: 10.1152/jn.00714.2005. [DOI] [PMC free article] [PubMed] [Google Scholar]
- Tanigawa H, Lu HD, Roe AW. Functional organization for color and orientation in macaque V4. Nat Neurosci. 2010;13:1542–1548. doi: 10.1038/nn.2676. [DOI] [PMC free article] [PubMed] [Google Scholar]
- Teufel HJ, Wehrhahn C. Chromatic induction in humans: how are the cone signals combined to provide opponent processing? Vision Res. 2004;44:2425–2435. doi: 10.1016/j.visres.2004.04.015. [DOI] [PubMed] [Google Scholar]
- Thiele A, Dobkins KR, Albright TD. Neural correlates of chromatic motion perception. Neuron. 2001;32:351–358. doi: 10.1016/s0896-6273(01)00463-9. [DOI] [PubMed] [Google Scholar]
- Thorell LG, De Valois RL, Albrecht DG. Spatial mapping of monkey V1 cells with pure color and luminance stimuli. Vision Research. 1984;24:751–769. doi: 10.1016/0042-6989(84)90216-5. [DOI] [PubMed] [Google Scholar]
- Tootell RB, Nelissen K, Vanduffel W, Orban GA. Search for color ‘center(s)’ in macaque visual cortex. Cerebral Cortex. 2004;14:353–363. doi: 10.1093/cercor/bhh001. [DOI] [PubMed] [Google Scholar]
- Vladusich T. Chromatic aberration and the roles of double-opponent and color-luminance neurons in color vision. Neural Netw. 2007;20:153–155. doi: 10.1016/j.neunet.2006.11.004. [DOI] [PubMed] [Google Scholar]
- Wagner G, Boynton RM. Comparison of four methods of heterochromatic photometry. J Opt Soc Am. 1972;62:1508–1515. doi: 10.1364/josa.62.001508. [DOI] [PubMed] [Google Scholar]
- Wandell BA, Poirson AB, Newsome WT, Baseler HA, Boynton GM, Huk A, Gandhi S, Sharpe LT. Color signals in human motion-selective cortex. Neuron. 1999;24:901–909. doi: 10.1016/s0896-6273(00)81037-5. [DOI] [PubMed] [Google Scholar]
- Webster MA. Human colour perception and its adaptation. Network: Computation in Neural Systems. 1996;7:587–634. [Google Scholar]
- Webster MA, Miyahara E, Malkoc G, Raker VE. Variations in normal color vision. II. Unique hues. J Opt Soc Am A Opt Image Sci Vis. 2000;17:1545–1555. doi: 10.1364/josaa.17.001545. [DOI] [PubMed] [Google Scholar]
- Wiesel TN, Hubel DH. Spatial and chromatic interactions in the lateral geniculate body of the rhesus monkey. J Neurophysiol. 1966;29:1115–1156. doi: 10.1152/jn.1966.29.6.1115. [DOI] [PubMed] [Google Scholar]
- Xiao Y, Casti A, Xiao J, Kaplan E. Hue maps in primate striate cortex. Neuroimage. 2007;35:771–786. doi: 10.1016/j.neuroimage.2006.11.059. [DOI] [PMC free article] [PubMed] [Google Scholar]
- Xiao Y, Wang Y, Felleman DJ. A spatially organized representation of colour in macaque cortical area V2. Nature. 2003;421:535–539. doi: 10.1038/nature01372. [DOI] [PubMed] [Google Scholar]
- Zeki S. The representation of colours in the cerebral cortex. Nature. 1980;284:412–418. doi: 10.1038/284412a0. [DOI] [PubMed] [Google Scholar]
- Zeki S. The distribution of wavelength and orientation selective cells in different areas of monkey visual cortex. Proceedings of the Royal Society of London - Series B: Biological Sciences. 1983;217:449–470. doi: 10.1098/rspb.1983.0020. [DOI] [PubMed] [Google Scholar]
- Zeki S. Thirty years of a very special visual area, Area V5. J Physiol. 2004;557:1–2. doi: 10.1113/jphysiol.2004.063040. [DOI] [PMC free article] [PubMed] [Google Scholar]
- Zeki SM. Colour coding in rhesus monkey prestriate cortex. Brain Research. 1973;53:422–427. doi: 10.1016/0006-8993(73)90227-8. [DOI] [PubMed] [Google Scholar]
- Zeki SM. Functional specialisation in the visual cortex of the rhesus monkey. Nature. 1978;274:423–428. doi: 10.1038/274423a0. [DOI] [PubMed] [Google Scholar]