

Abstract
This study aimed to investigate the biochemical influence of broccoli and beet extracts on selected individual additives NaNO2 or sunset yellow treated rats, in addition to the gene expression of some antioxidant enzymes. Forty-two male rats were assigned to seven groups of six rats in each group. The control group was fed a diet without an additive for four weeks. Group (2) received NaNO2, groups (3) received NaNO2 co-administered with broccoli extract (4) NaNO2 co-administered with beet extracts, Group (5) received sunset yellow, Group (6) received sunset yellow co-administered with broccoli extract, and Group (7) received sunset yellow co-administered with beet extract, for four weeks. At the end of the experiment, blood, liver, kidney, and brain samples were taken for biochemical and/or molecular analysis. The mRNA expression of antioxidant enzymes was determined by reversing transcriptase-polymerase chain reaction (RT-PCR). The obtained results revealed that rats co-administered with beet or broccoli extracts had a significant decrease in serum levels of AST, ALT, ALP, urea, total lipids, and triglycerides, as well as a significant increase in reduced glutathione (GSH), glutathione peroxidase (GSH-px), and superoxide dismutase (SOD) enzyme activities, compared to the normal control group. Oral administration of NaNO2 or sunset yellow caused a significant increase in serum levels of AST, ALT, ALP, urea, total lipids, and triglycerides, as well as a significant decrease in GSH, GSH-px, and SOD compared to the positive group. In conclusion, this study showed that broccoli and beet extracts have a protective effect against NaNO2 or sunset yellow in rat treated groups.
Keywords: Gene expression, Antioxidant enzymes, Broccoli, Beet, Sunset yellow, Sodium nitrite
1. Introduction
Traditionally, foods were grown, gathered, and eaten directly from a fairly unpolluted land. As the human population grew exponentially, farming progressed, trade developed, and local markets shared a variety of products among a variety of people. Techniques for food preparation and preservation were developed to deal with the new problems of storage, waste, and food-borne diseases (Pegg and Shahidi, 2000; Sindelar and Milkowski, 2012). Therefore, the modern food-industry dependence on processing and additives increases and has continually produced new chemicals to control, preserve, and transform our food. Food Additives are any substance added to food, not normally consumed as a food by itself and not normally used as a typical ingredient of the food, they may be natural or synthetic (El-Samrages, 2012; Yilmaz et al., 2009). Therefore, they are classified into various categories such as antimicrobial agents, antioxidants, artificial colors, artificial flavors and flavor enhancers, chelating agents and thickening and stabilizing agents (El-Samrages, 2012; Sasaki et al., 2002). The safety of repeated exposure to permitted synthetic food additives (colorants or preservatives) has been questioned. In relation to the toxicological limit, the FAO/WHO, Joint Expert Committee on Food Additive (JECFA) established an acceptable daily intake (ADIs) of many food additives that can be consumed everyday throughout the lifetime of an individual without any appreciable health effects (WHO, 1987). Certain food colors such as carmoisine (E122), amaranth (E123), sunset yellow (E110), Tartrazine (E102) and Allura red (E129) have been examined in bacterial and animal studies and it has been found that their mutagenicity varies widely, depending on the dose consumed, implying that they may also act as mutagenic and/or carcinogenic agents in humans (Macioszek and Kononowicz, 2004; Tsuda et al., 2001; Zeiger, 1993). Regardless of the significance of food colorants, there is great worry about the effects of synthetic food colorants on human health. Sunset yellow FCF (SY) (Disodium 6-hydroxy-5-[(4-sulfophenyl)azo]-2-napthalenesulfononate) is an azo dye permitted for food usage in several countries including Saudi Arabia (FAIRS Country Report, 2012). Many researchers (Tanaka, 2005; Zraly et al., 2006) studied the metabolic and toxicological disorders induced by the administration of specific food colorant additives to rats and other mammals. Many azo compounds are genotoxic in short-term tests and carcinogenic in laboratory animals (Sasaki et al., 2002). Permissible daily intake of the coloring matter per body weight is 0–2.5 mg/kg. Currently, sunset yellow is forbidden in many countries such as Norway and Finland. In 2008, European Union stated that food and drinks containing any of six artificial colorings that may be linked to hyperactive behavior in children will have to carry health warnings, including sunset yellow. Moreover, the European Food Safety Authority (EFSA) decided in 2009 to lower the acceptable daily intake for sunset yellow from 2.5 to 1.0 mg/kg bodyweight per day (McCann et al., 2007). Nitrates are naturally occurring chemicals that are a metabolic product of microbial digestion of wastes containing nitrogen, for example, animal feces or nitrogen-based fertilizers present in soil, air, surface water, and ground water. Nitrogen and oxygen combine to form the nitrate compound (), using three oxygen atoms and one nitrogen atom (WHO, 2011). A nitrite () is formed from two oxygen atoms and one nitrogen atom. In nature, nitrates can easily be converted to nitrites and vice versa. Human exposure to nitrates and nitrites comes from water, food and air. However, the nitrate and nitrite exposure we receive from air is negligible. Our primary source of exposure to nitrates and nitrites is through the food we consume, however exposure to these compounds can also occur through drinking water (WHO, 2011). The World Health Organization estimates the mean daily dietary intake of nitrate is from 43 to 141 mg, humans generally consume 1.2–3.0 mg of nitrite per day (WHO, 2007, 2011). Nitrites are added to fix color, to the preserved meat flavor, and to inhibit the growth of bacterial spores, specifically Clostridium botulinum (Pearson and Gillett, 1996). Some scientific studies suggest that nitrites promote and induce cancers in animals. When nitrites combine with certain amino acids, N-nitroso compounds or nitrosamines are formed and these have been shown to be carcinogenic (Grosse et al., 2006). In response to these findings, and the concern that excess nitrate/nitrite may react with the protein in the meat when it is cooked, to form these compounds, the amount of nitrate or nitrite that can be added to meat products is limited. The toxic effects of nitrates and nitrites are well recognized in mammalians, including testicular toxicity (Aly et al., 2010), hepatotoxicity and methemogobenemia (Knobeloch et al., 2000; Nituc et al., 2010; Rehman, 2001), and endocrine disturbance (Chaoui et al., 2004; Radikova et al., 2008). The wide use of nitrates as preservatives in food technology promotes the significance of studying their effects.
Oxidative stress is the result of an increased amount of reactive oxygen species (ROS) which can cause extensive injury to cell structures through attacking DNA, proteins and lipids, and is considered a major cause chronic diseases (Roya et al., 2009). Under normal conditions, in humans and animals, ROS can be neutralized by antioxidant defense systems including antioxidant enzymes that are considered as the first line defense antioxidants such as superoxide dismutase (SOD), glutathione peroxidase (GSH-px), and catalase (Fang et al., 2002). The second line of defense against ROS is glutathione (GSH), vitamin C, uric acid, albumin, bilirubin, vitamin E (α-tocopherol), carotenoids and flavonoids (Catapano et al., 2000). Due to health concerns, natural antioxidants have been widely used in recent years (Yen et al., 2003). Plants as natural products possess hundreds of compounds that act as natural antioxidants. Podsedek (2007) showed that consumption of fruit and vegetables reduces some of these harmful effects, which has been somewhat attributed to the presence of compounds possessing antioxidant properties. Antioxidants present in fruit and vegetables include beta-carotene, vitamin C, E, A, carotenoids and polyphenols, especially flavonoids (Monero et al., 2010). Therefore, many extracts of plants are recommended for many medicinal purposes, such as broccoli (Brassica oleracea) and beet (Beta vulgaris) extracts.
Broccoli contains many bioactive compounds including vitamins C and E, antioxidants, carotenoids, and phenolic compounds, particularly flavonoids (Faller and Fialho, 2009; Lin and Chang, 2005), as well as dietary fiber; moreover, it contains several nutrients with effective anti-cancer compounds, such as 3,3′-diindolylmethane, and glucoraphanin. Diindolylmethane is a powerful modulator of the innate immune response system with anti-viral, anti-bacterial and anti-cancer activities (Kirsh et al., 2007). Glucoraphanin, can be processed into an anticancer compound sulforaphane, therefore high intake of broccoli has been found to reduce the risk of aggressive prostate cancer as well as prevention of heart disease (Kirsh et al., 2007). Beet is cultivated in many parts of the world. It is especially rich in bioactive compounds as well as in sugars, but has a moderate caloric value (Pradhan et al., 2010). For centuries, it has been used as a traditional natural coloring agent in many foods. Medicinally, the roots and leaves of the beet have been used as a traditional medicine for liver and kidney diseases, for stimulation of the immune and hematopoietic systems, and as a special diet in the treatment of cancer (Deuter and Grundy, 2004; Kanner et al., 2001).
Due to the significance of the role of antioxidants in protection against the oxidative stress, which lead to many dangerous diseases such as heart diseases and cancer, this study was aimed to investigate the biochemical and molecular changes associated with the exposure of rats to the food additives and food chemical colorants.
2. Materials and methods
Forty two male Sprague–dawley strain, adults, weighing 170–200 g, were obtained from the Experimental Animal Unit, College of Science, King Khalid University, Saudi Arabia. All rats received food and water ad libitum and were kept in a room with the temperature regulated to 22 ± 1 °C. The Animal Ethics Committee, College of Science, King Khalid University, approved the experimental design. Roots of broccoli and beet extracts were purchased from the local vegetable market, Abha, Saudi Arabia.
2.1. Preparation of the extract
2.1.1. Broccoli extract
Extracts were generated by hydrolyzing 3 g of freeze-dried broccoli in 60 ml of deionized water for 24 h at room temperature. Extracts were then centrifuged at 3000 rpm for 10 min, followed by filtration of the supernatant through a Buchner funnel using Whatman 1 filter paper. The extract was given to the animals daily for four weeks.
2.1.2. Beet root extract
Crude aqueous extracts were prepared from root tissue of B. vulgaris L. Briefly, a single fruit (150 g) of red beet was exhaustively brushed and washed under running tap water and was then incubated in 250 ml of boiling distilled water for 45 min. Once at room temperature, the extract was filtered once by four layers of cheesecloth and once by a single layer of Whatman 1 filter paper. Finally, the extract was centrifuged at 6000 g for 10 min, decanted, fractionated into 10-ml aliquots and freeze-stored at −20 °C. An aliquot of the extract was thawed prior to each experiment.
2.2. Experimental design
2.2.1. LD50 dose
The sunset yellow rat oral LD50 dose in aqueous solution is 1000 mg/kg b.w., while it is 180 mg/kg b.w. for sodium nitrite. Quarter of the LD50 dose was used to treat the animals for four weeks.
2.2.2. Animal grouping
Rats were randomly divided into seven groups of six animals each as follows: Group 1: served as a negative control and fed on basal diet for four weeks. Group 2: kept as a positive control and received sodium nitrite. Group 3: received sodium nitrite and given oral beet extract. Group 4: received sodium nitrite and given broccoli extract orally. Group 5: kept as a positive control and received sunset yellow. Group 6: receive sunset yellow and given beet extract orally. Group 7: received sunset yellow and given broccoli extract orally.
2.2.3. Blood sampling
At the end of the experimental period, blood samples were collected from retro- orbital puncture to obtain hemolysis free clear serum according to van Herck et al. (1998). The blood samples were used for the preparation of serum after centrifugation at 1500 rpm for 10 min, and then kept in clean eppendorf tubes at −20 °C until analysis (AST, ALT, alkaline phosphatase, urea and creatinine).
2.2.4. Preparation of tissue homogenate
At the end of the four weeks, a piece of liver, kidney, and brain were taken freshly from each animal on ice. Homogenates of the tissues were prepared in 1.0 ml of phosphate buffer per 100 mg of tissue by using an electrical tissue homogenizer. The samples were spun at maximum speed at 4 °C, and the supernatant was used for the biochemical analysis. For RNA extraction, samples from rat’s liver, brain and kidney were removed, rinsed with ice-cold saline solution, and directly frozen by dropping into liquid nitrogen then stored at −80 °C for further study.
2.3. Biochemical analysis
2.3.1. Protein determination
Protein concentration in tissue homogenates was determined using the standard method of Bradford (1976).
2.3.2. Determination of malondialdehyde
To analyze lipid peroxidation in the liver, kidney and brain samples, 2-thiobarbituric acid-reactive substances (TBARS) were measured according to Ohkawa et al. (1979) and Yagi (1998) method at 532 nm. The concentration of MDA was calculated using an extinction coefficient of MDA–TBA complex, which is 1.56 × 10⁵ M−1 cm−1 and the results were expressed as nmole MDA/mg protein.
2.3.3. Determination of glutathione (GSH) concentration
Total glutathione content was measured according to the method described by Beutler et al. (1963) using glutathione reduced colorimetric method (Biodiagnostic, Egypt). Results were expressed as mg/dl.
2.3.4. Determination of triglycerides (TG)
The level of Triglycerides was determined by the method of McGowan et al. (1983) using a commercially available kit (Human, Germany). An aliquot (1.0 ml) of reagent solution was added to 10 μl of homogenate or standard, vortex-mixed and incubated at 25 °C for 10 min before reading the absorbance at 500 nm against the blank reagent.
2.3.5. Determination of Total cholesterol (TC)
The method described by Roeschlau et al. (1974) was used for the determination of total cholesterol using Randox kit. Briefly, 1 ml of the reagent solution was added to 10 μl sample, standard cholesterol (standard) and distilled water (blank) respectively in disposable tubes, mixed and then incubated at 25 °C for 10 min. The absorbance was read at 500 nm within 1 h.
2.3.6. Determination of serum urea level
Urea level (mg/dl) was estimated by a test reagent kit (Biodiagnostics, Egypt) depending on the urease-Berthelot reaction where in urease hydrolyzed urea to ammonium ions which then reacts with a mixture of salicylate, sodium nitroprusside, and hypochlorite to yield a blue–green chromophore which was measured photometrically at 550 nm. The intensity of the color formed is proportional to the urea concentration in the sample.
2.3.7. Serum creatinine level
Creatinine level (mg/dl) was determined by colorimetric kinetic assay using a test reagent kit (Biodiagnostics, Egypt). Creatinine reacts with picric acid in an alkaline solution to form a yellow color-complex. The intensity of the formed yellow dye increases by time and is measured photometrically at 495 nm.
2.3.8. Determination of serum aspartate aminotransferase and alanine aminotransferase
Serum aspartate aminotransferase (AST) and alanine aminotransferase (ALT) activities were determined according to the method described by Reitman and Frankel (1957).
2.3.9. Determination of serum alkaline phosphatase
Serum alkaline phosphatase (ALP) was calorimetrically estimated by Randox kit according to the method described by Belfield and Goldberg (1971).
2.3.10. Determination of (SOD) activity
SOD activity was determined in the sample according to the method of Woolliams et al. (1983) using Randox superoxide dismutase kit. Absorbance was measured photometrically at 505 nm. A standard curve was plotted for each standard against the percentage of inhibition, which was used to determine the superoxide dismutase activity (U/ml).
2.3.11. Determination of (GSH-px) assay
Glutathione peroxidase activity in the sample was measured according to the Paglia and Valentine’s method (1967) using Randox GSH-px kit. The activity of GSH-px was measured at 340 nm by measuring the decrease of NADPH absorbance using an extension coefficient of 6.22 mM−1 cm−1.
2.3.12. Determination of serum arginase
Serum arginase estimation was based upon the colorimetric determination of urea by condensation with diacetyl monoxime in an acid medium in the presence of ferric chloride and carbazide according to the method of Marsh et al. (1965).
2.3.13. Determination of serum α-l-fucosidase
The assay used for α-l-fucosidase, was based on the enzymatic cleavage of the synthetic substrate p-nitro phenyl a-l-fucopyranoside to p-nitrophenyl and l-fucose. The yellow color of p-nitrophenyl in an alkaline medium was measured quantitatively at 405 nm (Zietke et al., 1972).
2.4. Gene expression
To determine mRNA expression levels of GSH-px and SOD (Cu–Zn-dependent superoxide dismutase) total RNA was isolated from liver, brain, and Kidney using RNeasy Mini kit, (Qiagen) according to the manufacturers’ protocol. Following the photometrical determination of RNA concentration and purity at 260 and 280 nm, RNA quality was checked by testing the integrity of the 18S- and 28S- ribosomal RNA bands and by controlling the absence of genomic DNA in 1.0% agarose gels. Total RNA (2 μg) was transcribed into cDNA in a 20 μl final volume of reaction buffer [2 μl 10× Buffer; 2 μl dNTP mix (5 mM each); 1 μl RNase inhibitor (10 U/μl); 2 μl oligo dT primers (100 μM); 1 μl Omniscript reverse transcriptase and the corresponding amount of RNA (100 ng)] by incubation for 1 h at 37 °C. The reaction was stopped by incubation at 99 °C for 5 min. cDNA’s were stored at −20 °C until usage. The amplification of transcripts by Polymerase Chain Reaction was performed with 100 ng of the synthesized cDNA and specific primers for a given gene of interest (Table 1). In a typical PCR, a fresh master mix was prepared by mixing (per sample) 2.5 μl 10× PCR buffer, 1 μl MgCl2 (25 mM), 2 μl dNTP mix (2.5 mM of each dNTP), 0.5 μl Taq DNA polymerase (final concentration 2.5 U/ml), and 17 μl water. To the resulting 23 μl per sample, 1 μl of a pre-made mix of forward and reverse primers (5 μM each; final concentration 200 nm) and 1 μl cDNA template was added, for a final reaction volume of 25 μl. The thermal cycler was started with initial denaturation at 94 °C for 3 min, denaturation at 94 °C for 30 s, annealing at 58 °C for 30 s and extension at 72 °C for 60 s. These steps were repeated for 30 cycles. Last extension was carried out at 72 °C for 5 min and then finally the reaction was maintained at 4 °C. After the reaction was completed, PCR tubes were stored at −20 °C until further use. All PCR amplifications were performed on a Primus advanced thermocycler. From each PCR reaction, 5 μl was electrophoresed in a 1% agarose gel in Tris-borate- EDTA buffer. The DNA was visualized and photographed using the BioRad Gel documentation system.
Table 1.
List of primers used in this study.
| Primer name | Sequence | Product size |
|---|---|---|
| Cu–Zn SOD – F | 5′TCTAAGAAACATGGCGGTCC3′ | 311 bp |
| Cu–Zn SOD – R | 5′CAGTTAGCAGGCCAGCAGAT3′ | |
| GPx-F | 5′CTCTCCGCGGTGGCACAGT3′ | 290 bp |
| GPx-R | 5′CCACCACCGGGTCGGACATAC3′ |
2.5. Statistical analysis
The obtained results were expressed as mean ± SE. Data were evaluated statistically with computerized SPSS package program (IPM-SPSS statistics Ver.21 software for Windows) using one-way analysis of variance (ANOVA). Significant differences among means were estimated at p < 0.05.
3. Results
3.1. Effect on serum aminotransferases (ALT and AST) activity
Fig. 1 display the effect of treatment with NaNO2, sunset yellow and co-administration with broccoli and beet extracts on the enzymatic activities that reflect the liver function of rats. A significant increase in aspartate aminotransferase (AST) and alanine aminotransferase (ALT) was observed in groups treated with NaNO2 or sunset yellow as compared with the control group. Significant decrement appeared in AST and ALT activities in groups treated with broccoli and beet extracts co-administration compared with the NaNO2 or sunset yellow.
Figure 1.

Effect of treatment with broccoli or beet extracts on ALT and AST serum enzymes activities indicative of liver function of rats treated with sunset yellow or sodium nitrite. Data are expressed as mean ± SE. (a) significant versus control; (b) significant versus NaNO2 control; and (c) significant versus sunset yellow control.
3.2. Effect on serum alkaline phosphatase (ALP) activity
Fig. 2 shows a significant effect of NaNO2 or sunset yellow groups compared with the control rat group. However, a significant decrease in alkaline phosphatase (ALP) activity was detected in groups co-administered beet or broccoli compared to the NaNO2 and sunset yellow groups.
Figure 2.

Effect of treatment with broccoli or beet extracts on ALP serum enzymes activities indicative of liver function of rats treated with sunset yellow or sodium nitrite. Data are expressed as mean ± SE. (a) significant versus control; (b) significant versus NaNO2 control; and (c) significant versus sunset yellow control.
3.3. Effect on serum urea and creatinine
Indices of kidney functions were displayed in Fig. 3. The levels of urea and creatinine significantly increased in serum of rats that received NaNO2 or sunset yellow as compared to the control group. On the other hand, rats administered beet or broccoli extracts along with sunset yellow revealed a non-significant change in creatinine level whereas significant decrement in urea was recorded as compared to the sunset yellow treated group.
Figure 3.

Effect of treatment with broccoli or beet extracts on kidney function indices of rats treated with sunset yellow or sodium nitrite. Data are expressed as mean ± SE. (a) significant versus control; (b) significant versus NaNO2 control; and (c) significant versus sunset yellow control.
3.4. Effect on serum total lipids
Administration of NaNO2 or sunset yellow caused a significant elevation in serum total lipid level as compared with the control group. Co-treatment with beet or broccoli extracts induced a significant decrease in serum total lipids level when compared with NaNO2 or sunset yellow treated groups (Fig. 4).
Figure 4.

Effect of treatment with broccoli or beet extracts on serum total lipids levels of rats treated with sunset yellow or sodium nitrite. Data are expressed as mean ± SE. (a) significant versus control; (b) significant versus NaNO2 control; and (c) significant versus sunset yellow control.
3.5. Effect on serum total cholesterol
Fig. 5 showed that serum total cholesterol levels were significantly increased in groups of rats dosed with NaNO2 or sunset yellow when compared to the control rat group. Co-treatment with beet or broccoli extracts show a non-significant effect in serum total cholesterol level when compared with NaNO2 or sunset yellow treated groups (Fig. 5).
Figure 5.

Effect of treatment with broccoli or beet extracts on serum total cholesterol levels of rats treated with sunset yellow or sodium nitrite. Data are expressed as mean ± SE. (a) significant versus control; (b) significant versus NaNO2 control; and (c) significant versus sunset yellow control.
3.6. Effect on serum triglycerides
Treatment with NaNO2 led to a significant increase in serum triglyceride content as compared to the control group (Fig. 6). However, co-administration with beet extracts significantly improved the reduction of triglyceride content that was induced by NaNO2. The treatment with broccoli extract show a non-significant effect on triglyceride content when compared with NaNO2 treated rats. Sunset yellow treated rat group as well as the co-administration with beet or broccoli did not show a significant effect on the triglyceride (Fig. 6).
Figure 6.

Effect of treatment with broccoli or beet extracts on serum triglycerides levels of rats treated with sunset yellow or sodium nitrite. Data are expressed as mean ± SE. (a) significant versus control; (b) significant versus NaNO2 control; and (c) significant versus sunset yellow control.
3.7. Effect on lipid peroxide
Fig. 7 shows the effects of the administration of beet or broccoli extracts on the levels of liver, kidney and brain tissues MDA in NaNO2 or sunset yellow treated rats. NaNO2 or sunset yellow treatment as well as co-treatment with beet or broccoli extract brought a non-significant change of MDA levels in liver and kidney tissues as compared with the control, NaNO2, and sunset yellow groups, whereas, a significant effect was observed in rats treated with NaNO2 or unset yellow as compared with the control group.
Figure 7.

Effect of treatment with broccoli or beet extracts on MDA levels of rat liver, kidney and brain tissues treated with sunset yellow or sodium nitrite. Data are expressed as mean ± SE. (a) significant versus control; (b) significant versus NaNO2 control; and (c) significant versus sunset yellow control.
3.8. Effect on reduced glutathione concentration
Fig. 8 depicts the effect of NaNO2 or sunset yellow along with broccoli and beet extracts on the GSH levels in liver; kidney and brain treated rat. A significant reduction in the GSH level was recorded in NaNO2 or sunset treated rat groups as compared to the control group. Whereas broccoli and beet extracts show an increase in the GSH levels as compared to NaNO2 or sunset yellow treated groups in liver tissues.
Figure 8.

Effect of treatment with broccoli or beet extracts on GSH of rat liver, kidney and brain tissues treated with sunset yellow or sodium nitrite. Data are expressed as mean ± SE. (a) significant versus control; (b) significant versus NaNO2 control; and (c) significant versus sunset yellow control.
3.9. Effect on SOD activity
Fig. 9 shows the activity of superoxide dismutase (SOD) of all groups of rats. Rats treated with NaNO2 or sunset yellow showed a significant decrease in the activity of SOD in liver, kidney and brain tissues compared to the rats in the control group. However, rats treated with NaNO2 or sunset yellow along with beet or broccoli showed a significant increase in the activity of SOD in liver, kidney and brain tissues compared to the NaNO2 or sunset yellow treated groups.
Figure 9.

Effect of treatment with broccoli or beet extracts on SOD of rat liver, kidney and brain tissues treated with sunset yellow or sodium nitrite. Data are expressed as mean ± SE. (a) significant versus control; (b) significant versus NaNO2 control; and (c) significant versus sunset yellow control.
3.10. Effect on GSH-px activity
Fig. 10 depicts the effect of the broccoli and beet extracts on the GSH-px levels in NANO2 or sunset yellow treated rat. A significant decrease in the GSH-px level was recorded in NaNO2 or sunset yellow treated rat liver, kidney and brain tissues as compared to the control group. Treatment of rats with beet or broccoli extract along with NaNO2 shows an increase in the GSH-px levels as compared to the NaNO2 treated group in the liver and brain whereas no significant effect was recorded for this enzyme activity in the kidney. However, rats treated with sunset yellow along with broccoli or beet did not show any significant difference as compared to the sunset yellow treated group in the liver and brain tissue. A significant elevation in the enzyme activity was observed in the kidney of the rat group treated with broccoli extract along with sunset yellow.
Figure 10.
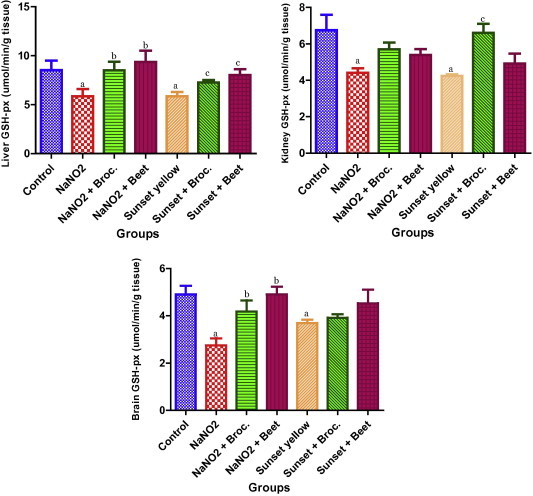
Effect of treatment with broccoli or beet extracts on GSH-px of rat liver, kidney and brain tissues treated with sunset yellow or sodium nitrite. Data are expressed as mean ± SE. (a) significant versus control; (b) significant versus NaNO2 control; and (c) significant versus sunset yellow control.
3.11. Effect on tumour markers
There was a non-significant change in arginase and a-l-fucosidase in the NaNO2 or sunset yellow control groups (Fig. 11). Co-administration of beet or broccoli shows similar results.
Figure 11.

Effect of treatment with broccoli or beet extracts on Tumor markers rats treated with sunset yellow or sodium nitrite. Data are expressed as mean ± SE.
3.12. Superoxide dismutase and glutathione peroxidase gene expression
To monitor and confirm the quality (integrity) of total RNA extracted from the liver, and pancreatic samples total RNA was assessed by visualization on 1.5% agarose gel electrophoresis. The results showed the appearance of two bright discrete bands that represent the 28S and 18S rRNA with an estimated size of 4.8 and 1.9 kb, respectively. The 28S rRNA band appears approximately twice as intense as the 18S rRNA band suggesting that the RNA is intact and a high-quality RNA preparation. The smearing between the 28S and 18S is normal, as this is where most of the mRNA will migrate. Thus, the total RNA showed adequate integrity for use in further experiments.
Complementary DNA was produced and amplified using RNA purified from liver; kidney and brain tissues of rat groups treated with NaNO2, sunset yellow, to induce oxidative stress or co-administration of these chemicals with beet or broccoli or not treated rat groups. Primers designed to amplify portions of Cu–Zn SOD and GSH-px did amplify the expected fragments (Fig. 12). Differences in band density between NaNO2 or sunset yellow treated, and untreated rat groups were observed after RT-PCR reactions for GSH-px (Fig. 12A–C), but were not observed for co-administered rat groups with beet or broccoli. The mRNA expressions of Cu–Zn SOD in all organs were significantly higher in treated rat groups with NaNO2 or sunset yellow or co-administered with beet or broccoli than in rat groups without treatment (Fig. 12D–F). These results indicated that the activities of antioxidant enzymes such as Cu–Zn SOD were associated with the expressions of each respective gene.
Figure 12.
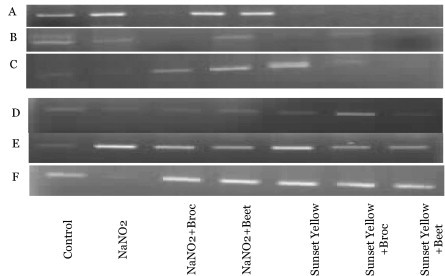
Gel electrophoresis of the RT-PCR product of SOD and GSH-px genes in liver, kidney and brain tissues treated with various treatments (A) GSH-px-Liver; (B) GSH-px kidney; (C) GSH-px-brain; (D) SOD-liver; (E) SOD-kidney; and (F) SOD-brain.
4. Discussion
Serum aminotransferases activities are used as toxicity markers in studying hepatotoxicity caused by chemicals (Govindwar and Dalvi, 1990). In this study, NaNO2 or sunset yellow was administered orally, and later they reach the liver through the portal vein and may cause destructive changes in hepatic cells leading to the release of the enzymes from the cytoplasm into the blood circulation after rupture of the plasma membrane and cellular damage (Bansal et al., 2005). Therefore, a significant increase in the activities of serum ALT and AST was recorded. These results are in agreement with Helal et al. (2000) who reported an elevation of serum ALT and AST after treatment of rats with sunset yellow. The present study revealed an increase in the ALP activity in rats treated with NaNO2 or sunset yellow, which is an indication of obstructive damage in the liver tissue. The present data showed that NaNO2 or sunset yellow increase in both serum creatinine and urea levels, which is strictly associated to the injury of renal function.
In the present investigation, significant changes occurred in the level of serum total lipids of rats treated with NaNO2 or sunset yellow. It is well known that the increase in cholesterol concentration is an indication of membrane structure and function disruption, thus influence its fluidity, permeability, activity of associated enzymes and transport system. Beet plays a role in peroxidation by inhibiting the free-radical attack on membranes. Previous phytochemical investigations on this plant demonstrated the presence of polyphenolic compounds. These constituents have been reported to protect lipids, blood, and body fluids against the attack of reactive oxygen species like superoxide, peroxide, and hydroxyl radicals. The presence of poly phenolic compounds in B. vulgaris extracts might be responsible for their observed antioxidant activity. Since reactive oxygen species are involved in stress and pathogenesis of cancer, diabetes mellitus, atherosclerosis, and dementia, the use of this plant may be beneficial in preventing initiation or progress of such disorders.
It is well recognized that free radicals are critically involved in various pathological conditions such as cancer, cardiovascular disorders, arthritis and liver diseases. Under normal physiological conditions, low concentrations of lipid peroxidation products are found in tissues and cells. In the presence of oxidative stress, more lipid peroxidation products are formed due to cell damage. Cellular antioxidant enzymes such as superoxide dismutase, glutathione peroxidase, and catalase normally challenge oxidative stress. Data in this study showed an increased in MDA concentration in the liver, kidney and brain tissues which may be related to the increase in free radicals. This finding was consistent with the observation that the free radicals reduced the activity of the endogenous antioxidant enzyme SOD (Conner and Grisham 1996). It is known that free radical scavenging enzymes such as SOD protects the biological systems from oxidative stress. The current study showed a significant decrease in the activity of SOD in groups of rats administrated with NaNO2 or sunset yellow. This reduction could be attributed to an enhanced production of free radicals during NaNO2 or sunset yellow metabolism. In this study, administration of NaNO2 or sunset yellow depleted the level of glutathione (GSH), such depletion agreed with that reported by Kweon et al. (2003), Pradeep et al. (2007), Sivaramakrishnan et al. (2008). Glutathione is required to maintain the normal reduced state of cells and to counteract all the deleterious effects of oxidative stress. Thus, GSH is involved in many cellular processes including the detoxification of endogenous and exogenous compounds. Sunset yellow interacts with the large nucleophilic pool of GSH thereby reducing the macromolecule and carcinogen interaction (Ketterer, 1998). The depletion of liver GSH in NaNO2 or sunset yellow treated rats may be responsible for the increase in lipid peroxidation. A significant decrease in the activities of GSH dependent enzyme, GSH-px in NaNO2 or sunset yellow treated rats may be due to decreased expression of these antioxidants during hepatocellular damage.
This study revealed oral administration of broccoli and beet extracts caused a significant decrease in serum levels of AST, ALT, and ALP. However, there were significant increases in the levels of SOD and GSH-px. These results agreed with Wargovich (1999) who reported that cruciferous vegetables namely cabbage, cauliflower and broccoli are rich in anti-carcinogens. A possible mechanism of reduced activities of the tested enzymes and hepatoprotective effect of broccoli and beet extracts may be related to their antioxidant effect of the phenolic and flavonoid compounds. Previous study reported that polyphenols can inhibit nitrosation and flavonoids have hepatoprotective activities (Orhan et al., 2007, 2012).
When analyzing good-quality RNA, two very bright ribosomal RNA bands observed during this study, as rRNA accounts for around 80% of cellular RNA and the 2:1 ratio (28S:18S) was observed, which is a good indication that the RNA is completely intact. Since the 28S rRNA is more labile than the 18S rRNA, equal intensities of the two bands generally indicate that some degradation has occurred (Aranda et al., 2012). Smearing between the 28S and 18S is normal, as this is where most of the mRNA will migrate. The gel electrophoresis obtained proved that the homogenization was performed well since there was no or little DNA in the upper part of the gel.
Oxidative stress is responsible for an increase in the accumulation of the reactive oxygen species in cells, which may subsequently lead to an increase in the expression of genes encoding antioxidant enzymes (Michiels et al., 1994). Variances in band density of amplified portions of Cu–Zn SOD and GSH-px between rats in the control group and the treated groups (NaNO2, sunset yellow, co-administration with beet or broccoli) suggest that these enzymes may be differentially expressed in cells exposed to oxidative stress compared with those that are not. Variation in antioxidant enzymes responses to oxidative stress may be due to the balance that must be achieved to boost protection of the cell under stressful conditions (Michiels et al., 1994).
Acknowledgement
The authors are indebted to the Deanship of Scientific Research, King Khalid University for financial support of this project (kku-sci-11/019).
Footnotes
Peer review under responsibility of King Saud University.
References
- Aly H.A., Mansour A.M., Abo-Salem O.M., Abd-Ellah H.F., Abdel-Naim A.B. Potential testicular toxicity of sodium nitrate in adult rats. Food Chem. Toxicol. 2010;48:572–578. doi: 10.1016/j.fct.2009.11.034. [DOI] [PubMed] [Google Scholar]
- Aranda P.S., LaJoie D.M., Jorcyk C.L. Bleach gel: a simple agarose gel for analyzing RNA quality. Electrophoresis. 2012;33:366–369. doi: 10.1002/elps.201100335. [DOI] [PMC free article] [PubMed] [Google Scholar]
- Bansal A.K., Bansal M., Soni G., Bhatnagar D. Protective role of Vitamin E pre-treatment on N-nitrosodiethylamine induced oxidative stress in rat liver. Chem. Biol. Interact. 2005;156:101–111. doi: 10.1016/j.cbi.2005.08.001. [DOI] [PubMed] [Google Scholar]
- Belfield A., Goldberg D. Colorimetric determination of alkaline phosphatase activity. Enzyme. 1971;12:561–566. doi: 10.1159/000459586. [DOI] [PubMed] [Google Scholar]
- Beutler E., Duron O., Kelly B.M. Improved method for the determination of blood glutathione. J. Lab. Clin. Med. 1963;61:882–888. [PubMed] [Google Scholar]
- Bradford M.M. A rapid and sensitive method for the quantitation of microgram quantities of protein utilizing the principle of protein-dye binding. Anal. Biochem. 1976;72:248–254. doi: 10.1016/0003-2697(76)90527-3. [DOI] [PubMed] [Google Scholar]
- Catapano A.L., Maggi F.M., Tragni E. Low density lipoprotein oxidation, antioxidants, and atherosclerosis. Curr. Opin. Cardiol. 2000;15:355–363. doi: 10.1097/00001573-200009000-00008. [DOI] [PubMed] [Google Scholar]
- Chaoui A.A., Zaki A., Talibi A., Chait A., Derouiche A., Aboussaouira T., Benabdjlil F., Himmi T. Effects of inorganic nitrates on thyroid gland activity and morphology in female rats. Therapie. 2004;59:471–475. doi: 10.2515/therapie:2004079. [DOI] [PubMed] [Google Scholar]
- Conner E.M., Grisham M.B. Inflammation, free radicals, and antioxidants. Nutrition. 1996;12:274–277. doi: 10.1016/s0899-9007(96)00000-8. [DOI] [PubMed] [Google Scholar]
- Deuter, P., Grundy, T., 2004. Beetroot Commercial Production and Processing. Agency for Food and Fibre Sciences. Holland Horticultural Limited Partnership.
- El-Samrages Y., editor. Food Additives. Intechweb.org; Croatia: 2012. [Google Scholar]
- FAIRS Country Report, 2012. Food and Agricultural Import Regulations and Standards – Narrative, Saudi Arabia, ed. O.o.A.A.o.t.U.F.A.S.i.s. Arabia.
- Faller A.L.K., Fialho E. The antioxidant capacity and polyphenol content of organic and conventional retail vegetables after domestic cooking. Food Res. Int. 2009;42:210–215. [Google Scholar]
- Fang Y.Z., Yang S., Wu G. Free radicals, antioxidants, and nutrition. Nutrition. 2002;18:872–879. doi: 10.1016/s0899-9007(02)00916-4. [DOI] [PubMed] [Google Scholar]
- Govindwar S.P., Dalvi R.R. Age-dependent toxicity of acorn extract in young and old male rats. Vet. Hum. Toxicol. 1990;32:23–26. [PubMed] [Google Scholar]
- Grosse, Y., Baan, R., Straif, K., Secretan, B., El Ghissassi, F., Cogliano, V., Group, W.H.O.I.A.f.R.o.C.M.W., 2006. Carcinogenicity of nitrate, nitrite, and cyanobacterial peptide toxins. Lancet Oncol. 7, 628–629. [DOI] [PubMed]
- Helal E.G.E., Zaahkouk S.A.M., Mekkawy H.A. Effect of some food colorants (synthetic and natiral products) of young albino rats. Egypt. J. Hospital Med. 2000;1:103–113. [Google Scholar]
- Kanner J., Harel S., Granit R. Betalains–a new class of dietary cationized antioxidants. J. Agric. Food Chem. 2001;49:5178–5185. doi: 10.1021/jf010456f. [DOI] [PubMed] [Google Scholar]
- Ketterer B. Glutathione S-transferases and prevention of cellular free radical damage. Free Radic. Res. 1998;28:647–658. doi: 10.3109/10715769809065820. [DOI] [PubMed] [Google Scholar]
- Kirsh V.A., Peters U., Mayne S.T., Suba A.F., Chatterjee N., Johnson C.C., Hayes R.B. Prospective study of fruit and vegetable intake and risk of prostate cancer. J. Natl. Cancer Inst. 2007;99:1200–1209. doi: 10.1093/jnci/djm065. [DOI] [PubMed] [Google Scholar]
- Knobeloch L., Salna B., Hogan A., Postle J., Anderson H. Blue babies and nitrate-contaminated well water. Environ. Health Perspect. 2000;108:675–680. doi: 10.1289/ehp.00108675. [DOI] [PMC free article] [PubMed] [Google Scholar]
- Kweon S., Park K.A., Choi H. Chemopreventive effect of garlic powder diet in diethylnitrosamine-induced rat hepatocarcinogenesis. Life Sci. 2003;73:2515–2526. doi: 10.1016/s0024-3205(03)00660-x. [DOI] [PubMed] [Google Scholar]
- Lin C.H., Chang C.Y. Textural change and antioxidant properties of broccoli under different cooking treatments. Food Chem. 2005;90:9–15. [Google Scholar]
- Macioszek V.K., Kononowicz A.K. The evaluation of the genotoxicity of two commonly used food colors: quinoline yellow (E 104) and brilliant black BN (E 151) Cell. Mol. Biol. Lett. 2004;9:107–122. [PubMed] [Google Scholar]
- Marsh W.H., Fingerhut B., Miller H. Automated and manual direct methods for the determination of blood urea. Clin. Chem. 1965;11:624–627. [PubMed] [Google Scholar]
- McCann D., Barrett A., Cooper A., Crumpler D., Dalen L., Grimshaw K., Kitchin E., Lok K., Porteous L., Prince E., Sonuga-Barke E., Warner J.O., Stevenson J. Food additives and hyperactive behaviour in 3-year-old and 8/9-year-old children in the community: a randomised, double-blinded, placebo-controlled trial. Lancet. 2007;370:1560–1567. doi: 10.1016/S0140-6736(07)61306-3. [DOI] [PubMed] [Google Scholar]
- McGowan M.W., Artiss J.D., Strandbergh D.R., Zak B. A peroxidase-coupled method for the colorimetric determination of serum triglycerides. Clin. Chem. 1983;29:538–542. [PubMed] [Google Scholar]
- Michiels C., Raes M., Toussaint O., Remacle J. Importance of Se-glutathione peroxidase, catalase, and Cu/Zn-SOD for cell survival against oxidative stress. Free Radic. Biol. Med. 1994;17:235–248. doi: 10.1016/0891-5849(94)90079-5. [DOI] [PubMed] [Google Scholar]
- Monero D.A., Perez-Balibrea S., Ferreres F., Gil-Izquierdo A., Garcia-Viguera C. Acylated anthocyanins in broccoli sprouts. Food Chem. 2010;123:358–363. [Google Scholar]
- Nituc E., Nastase V., Mihailescu G., Chioveanu D. Researches of the nitrates and nitrites in some well waters from rural area in correlation with methoglobinemia morbidity. Rev. Med. Chir. Soc. Med. Nat. Iasi. 2010;114:580–586. [PubMed] [Google Scholar]
- Ohkawa H., Ohishi N., Yagi K. Assay for lipid peroxides in animal tissues by thiobarbituric acid reaction. Anal. Biochem. 1979;95:351–358. doi: 10.1016/0003-2697(79)90738-3. [DOI] [PubMed] [Google Scholar]
- Orhan D.D., Orhan N., Ergun E., Ergun F. Hepatoprotective effect of Vitis vinifera L. leaves on carbon tetrachloride-induced acute liver damage in rats. J. Ethnopharmacol. 2007;112:145–151. doi: 10.1016/j.jep.2007.02.013. [DOI] [PubMed] [Google Scholar]
- Orhan I.E., Sener B., Musharraf S.G. Antioxidant and hepatoprotective activity appraisal of four selected Fumaria species and their total phenol and flavonoid quantities. Exp. Toxicol. Pathol. 2012;64:205–209. doi: 10.1016/j.etp.2010.08.007. [DOI] [PubMed] [Google Scholar]
- Paglia D.E., Valentine W.N. Studies on the quantitative and qualitative characterization of erythrocyte glutathione peroxidase. J. Lab. Clin. Med. 1967;70:158–169. [PubMed] [Google Scholar]
- Pearson A.M., Gillett T.A. Chapman & Hall; NY: 1996. Processed Meats. [Google Scholar]
- Pegg R.B., Shahidi F. Food and Nutrition Press, Inc.; Trumbull, CT: 2000. Nitrite Curing of Meat. The N-Nitrosamine Problem and Nitrite alternatives. [Google Scholar]
- Podsedek A. Natural antioxidants and antioxidant capacity of Brassica vegetables: a review. Swiss Soc. Food Sci. Technol. 2007;40:1–11. [Google Scholar]
- Pradeep K., Mohan C.V., Gobianand K., Karthikeyan S. Silymarin modulates the oxidant-antioxidant imbalance during diethylnitrosamine induced oxidative stress in rats. Eur. J. Pharmacol. 2007;560:110–116. doi: 10.1016/j.ejphar.2006.12.023. [DOI] [PubMed] [Google Scholar]
- Pradhan S.K., Holopainen J.K., Weisell J., Heinonen-Tanski H. Human urine and wood ash as plant nutrient for red beet (Beta vulgaris) cultivation: impacts on yield quality. J. Agric. Food Chem. 2010;58:2034–2039. doi: 10.1021/jf9029157. [DOI] [PubMed] [Google Scholar]
- Radikova Z., Tajtakova M., Kocan A., Trnovec T., Sebokova E., Klimes I., Langer P. Possible effects of environmental nitrates and toxic organochlorines on human thyroid in highly polluted areas in Slovakia. Thyroid. 2008;18:353–362. doi: 10.1089/thy.2007.0182. [DOI] [PubMed] [Google Scholar]
- Rehman H.U. Methemoglobinemia. West. J. Med. 2001;175:193–196. doi: 10.1136/ewjm.175.3.193. [DOI] [PMC free article] [PubMed] [Google Scholar]
- Reitman S., Frankel S. A colorimetric method for the determination of serum glutamic oxalacetic and glutamic pyruvic transaminases. Am. J. Clin. Pathol. 1957;28:56–63. doi: 10.1093/ajcp/28.1.56. [DOI] [PubMed] [Google Scholar]
- Roeschlau P., Bernt E., Gruber W. Enzymatic determination of total cholesterol in serum. Z. Klin. Chem. Klin. Biochem. 1974;12:226. [PubMed] [Google Scholar]
- Roya M.K., Junejaa L.R., Isobeb S., Tsushidab T. Steam processed broccoli (Brassica oleracea) has higher antioxidant activity in chemical and cellular assay systems. Food Chem. 2009;114:263–269. [Google Scholar]
- Sasaki Y.F., Kawaguchi S., Kamaya A., Ohshita M., Kabasawa K., Iwama K., Taniguchi K., Tsuda S. The comet assay with 8 mouse organs: results with 39 currently used food additives. Mutat. Res. 2002;519:103–119. doi: 10.1016/s1383-5718(02)00128-6. [DOI] [PubMed] [Google Scholar]
- Sindelar J.J., Milkowski A.L. Human safety controversies surrounding nitrate and nitrite in the diet. Nitric Oxide. 2012;26:259–266. doi: 10.1016/j.niox.2012.03.011. [DOI] [PubMed] [Google Scholar]
- Sivaramakrishnan V., Shilpa P.N., Praveen Kumar V.R., Niranjali Devaraj S. Attenuation of N-nitrosodiethylamine-induced hepatocellular carcinogenesis by a novel flavonol-Morin. Chem. Biol. Interact. 2008;171:79–88. doi: 10.1016/j.cbi.2007.09.003. [DOI] [PubMed] [Google Scholar]
- Tanaka T. Reproductive and neurobehavioural toxicity study of trartrazine administration to mice in the diet. Food Chem. Toxicol. 2005;5:16–25. [Google Scholar]
- Tsuda S., Murakami M., Matsusaka N., Kano K., Taniguchi K., Sasaki Y.F. DNA damage induced by red food dyes orally administered to pregnant and male mice. Toxicol. Sci. 2001;61:92–99. doi: 10.1093/toxsci/61.1.92. [DOI] [PubMed] [Google Scholar]
- van Herck H., Baumans V., Brandt C.J., Hesp A.P., Sturkenboom J.H., van Lith H.A., van Tintelen G., Beynen A.C. Orbital sinus blood sampling in rats as performed by different animal technicians: the influence of technique and expertise. Lab. Anim. 1998;32:377–386. doi: 10.1258/002367798780599794. [DOI] [PubMed] [Google Scholar]
- Wargovich M.J. Nutrition and cancer: the herbal revolution. Curr. Opin. Gastroenterol. 1999;15:177–180. doi: 10.1097/00001574-199903000-00016. [DOI] [PubMed] [Google Scholar]
- WHO, 1987. Principles for the safety assessment of food additives and contaminants in food. Environmental Health Criteria.
- WHO, 2007. Nitrate and nitrite in drinking water development of WHO guidelines for drinking water quality, Geneva, Switzerland, pp. 1–21.
- WHO, 2011. Nitrate and nitrite in drinking-water background document for development of WHO guidelines for drinking-water quality, World Health Organization, Geneva, Switzerland, pp. 1–23.
- Woolliams J.A., Wiener G., Anderson P.H., McMurray C.H. Variation in the activities of glutathione peroxidase and superoxide dismutase and in the concentration of copper in the blood in various breed crosses of sheep. Res. Vet. Sci. 1983;34:253–256. [PubMed] [Google Scholar]
- Yagi K. Simple assay for the level of total lipid peroxides in serum or plasma. Methods Mol. Biol. 1998;108:101–106. doi: 10.1385/0-89603-472-0:101. [DOI] [PubMed] [Google Scholar]
- Yen G.C., Chang Y.C., Su S.W. Anti-oxidant activity and active compounds of rice Koji fermented with Aspegillus candidus. Food Chem. 2003;83:49–54. [Google Scholar]
- Yilmaz S., Unal F., Yuzbasioglu D. The in vitro genotoxicity of benzoic acid in human peripheral blood lymphocytes. Cytotechnology. 2009;60(1–3):55–61. doi: 10.1007/s10616-009-9214-z. [DOI] [PMC free article] [PubMed] [Google Scholar]
- Zeiger E. Mutagenicity of chemicals added to foods. Mutat. Res. 1993;290:53–61. doi: 10.1016/0027-5107(93)90032-b. [DOI] [PubMed] [Google Scholar]
- Zietke K., Okada S., O’Brien J.S. Fucosidosis diagnosis by serum assay a-l-fucosidase. J. Lab. Clin. Med. 1972;79:1649–1654. [PubMed] [Google Scholar]
- Zraly Z., Pisarikova B., Trckova M., Herzig I., Juzl M., Simeonovova J. Effect of lupin and amaranth on growth efficiency, health and carcass characteristics and meat quality of market pigs. Acta Veterinaria Brno. 2006;75:363–372. [Google Scholar]