

Abstract
The understanding of neural activity patterns is fundamentally linked to an understanding of how the brain's network architecture shapes dynamical processes. Established approaches rely mostly on deviations of a given network from certain classes of random graphs. Hypotheses about the supposed role of prominent topological features (for instance, the roles of modularity, network motifs or hierarchical network organization) are derived from these deviations. An alternative strategy could be to study deviations of network architectures from regular graphs (rings and lattices) and consider the implications of such deviations for self-organized dynamic patterns on the network. Following this strategy, we draw on the theory of spatio-temporal pattern formation and propose a novel perspective for analysing dynamics on networks, by evaluating how the self-organized dynamics are confined by network architecture to a small set of permissible collective states. In particular, we discuss the role of prominent topological features of brain connectivity, such as hubs, modules and hierarchy, in shaping activity patterns. We illustrate the notion of network-guided pattern formation with numerical simulations and outline how it can facilitate the understanding of neural dynamics.
Keywords: brain connectivity, hierarchy, modularity, network analysis, Turing patterns, self-organization
1. Background: self-organized dynamic patterns in complex brain networks
A wide range of biological systems are organized in a network-like fashion. Accordingly, the large and diverse field of network science has since its very beginning resorted to biological examples to motivate, propose and refine methods for the analysis of complex networks (e.g. [1–3]). In this way, network science has become a new important paradigm for the understanding of biological systems. Clearly, one of the most fascinating examples of a biological network is the brain. The way in which the brain's network topology shapes, organizes and constrains dynamical processes has received a great amount of attention in recent years and has provided new perspectives in theoretical neuroscience [4,5].
Another diversely explored paradigm for the understanding of biological systems is the concept of self-organized patterns, where collective modes of the system emerge from the local interactions of components (e.g. [6]). Diverse forms of distributed computation and global organization are implemented in biological systems via such local interactions, from the rich ornaments of seashells and the diversity of animal coat patterns to the myriad of fractal structures in biology and pattern-forming colonies of bacteria. Particularly fascinating are patterns changing with time, resulting in spatio-temporal patterns, such as propagating waves and aggregation streams. Bacteria form large branched and nested aggregation-like patterns to immobilize themselves against water flow (see Levine & Ben-Jacob [7] for a review of various such forms of pattern formation). The individual amoeba in Dictyostelium discoideum colonies initiates a transition to a collective multicellular state via a quorum-sensing form of communication: a cAMP signal propagating through the community in the form of spiral waves and the subsequent chemotactic response of the cells leads to branch-like aggregation streams (e.g. [8–10]). So far, however, these patterns have been mostly discussed for regular interaction architectures, such as lattices.
In this review, we explore a novel view where these two paradigms, network science on the one hand and self-organized pattern formation on the other, are functionally integrated. We discuss some recent findings regarding dynamical processes in topologically complex brain networks, to demonstrate the occurrence of pattern formation guided by the characteristic network architecture. Furthermore, we illustrate with a few simple examples that network-guided pattern formation is a universal and unifying approach for understanding a heterogeneous set of observations about neural dynamics in structured graphs. Our goal, thus, is to provide the first steps in a unifying framework for these diverse perspectives, explaining how dynamics and topology are tuned in a synergistic fashion via network-guided biological self-organization.
We focus on the organization of excitable dynamics on graphs. On regular graphs (i.e. rings and lattices), the natural approach of describing dynamical processes is by resorting to the language of large-scale spatio-temporal patterns emerging from local interactions in a self-organized fashion. The exact layout of the patterns is typically determined by random fluctuations or by systematic differences between the nodes of the graph. Here, we show that on a graph with less regularity, patterns can be confined by the network architecture to a few network-compatible modes. This phenomenon of network-guided pattern formation can facilitate the interpretation of neural dynamics.
The logic of this paper is as follows. First, in §1c, we describe some fundamental topological features of brain networks that have received attention over the past few years, in particular, their heterogeneous degree distribution (§1c(i)), resulting in the existence of hubs; as well as modules (§1c(ii)) and a hierarchical organization of networks (§1c(iii)). Next, in §2, we introduce two minimal dynamical models, helping us to probe these dynamics for the phenomenon of network-guided pattern formation, specifically, in §2b reaction–diffusion dynamics as the prototype of pattern-forming dynamical systems, and in §2c a simple three-state model of excitable dynamics, which has been employed in various systems for studying the interplay of network topology and dynamics. Finally, in §3, we attempt to derive from these observations some tentative general conclusions for the organization of brain dynamics.
(a). Theories of spatio-temporal pattern formation
Theories of spatio-temporal pattern formation have contributed fundamentally to a deep understanding of natural processes, particularly in biology. One striking example is Turing's concept of reaction–diffusion processes, which has a vast range of applications—from biology to social systems [11]. At the same time, these theories (or classes of models) are well embedded in the broader framework of self-organization.
Self-organization is the emergence of large-scale patterns, based on collective dynamical states, from local interactions. Clearly, on regular architectures (such as rings or lattices), the emergence of patterns can be easily assessed. In more intricately connected systems, such collective states have been described only for simple cases such as synchronization [12]. Over the past few years, some progress has been made in extending the concept of patterns on graphs to more general forms of dynamics, for example, to reaction–diffusion systems [13] and to a wave-like organization of excitable dynamics around hubs [14].
(b). Merging the perspectives of pattern formation and complex networks
Very much in the light of Nakao & Mikhailov [13] and Müller-Linow et al. [14], we want to understand what the network equivalents of classical spatio-temporal patterns are, and how, for example, the presence of hubs and modules in networks relates the processes behind spatio-temporal patterns to the theory of complex systems.
In Müller-Linow et al. [14], it was shown that different topological features of complex networks, such as node centrality and modularity, organize the synchronized network function at different levels of spontaneous activity. Essentially, two types of correlations between network topology and dynamics were observed: waves propagating from central nodes and module-based synchronization. These two dynamic regimes represent a graph-equivalent to classical spatio-temporal pattern formation. Remarkably, the dynamic behaviour of hierarchical modular networks can switch from one of these modes to the other as levels of spontaneous network activation change.
In addition, several other studies have attempted to relate notions of spatio-temporal pattern formation with dynamics on graphs. Wang et al. [15] emphasized that a certain form of noise-induced pattern formation, spatial coherence resonance, is suppressed by the presence of long-ranging shortcuts and, in general, a small-world network architecture. Liao et al. [16] rediscovered the target waves around hub nodes previously described by Müller-Linow et al. [14]. They emphasized that large portions of the graph can be enslaved by such patterns (see also [17,18]). The interesting phenomenon of synchronization waves described by Leyva et al. [19] resorts to an embedding of the network in real space. Synchronization waves in this context are characterized by the degree of information transmission.
The waves-to-sync transition in hierarchical graphs (concentric waves around hubs are gradually substituted by synchronous activity within modules) with an increasing rate of spontaneous activity (as described by Müller-Linow et al. [14]) is one example of such collective modes selected for and stabilized by the graph's topology and dynamical parameters. The dominant (and functionally important) feature of hierarchical graphs is that hierarchy (independently of its exact definition) shapes every topological scale. Other graph properties (such as modularity or a broad degree distribution) typically reside on a single scale. Therefore, potentially a large number of self-organized, collective modes can ‘lock tot’ hierarchical topologies. We argue that this ‘versatility’ of hierarchical networks is the main reason for their ubiquity in biological systems.
(c). Essential aspects of the organization of brain networks
Brain networks can show features of different prototype networks (figure 1). For example, an individual brain network might possess properties of small-world, modular or hierarchical networks. Network topology might also differ at different scales of network organization, for instance, showing random or regular axonal connectivity at the scale of small neuronal populations and modular connectivity for cortico-cortical fibre tracts [26]. Generally, however, biological neural networks do not conform completely to any of such benchmark networks. Instead, they combine different topological features, including a non-random degree distribution, the existence of network modules as well as the hierarchical combination of such features at different scales of organization. These features are reviewed in the following paragraphs.
Figure 1.

Prototype network topologies and brain connectivity examples. (a) Erdös–Rényi random network. (b) Regular or lattice network with dense connectivity between neighbours. (c) Modular network with two modules. (d) Hierarchical modular network with two modules consisting of two sub-modules each. (e) Rat thalamocortical network of 23 brain regions [20]. (f) Cat connectivity among 55 cortical and subcortical regions [21,22]. (g) Connectivity among 30 regions of the primate (macaque monkey) visual cortex [23,24]. (h) Connectivity among 33 human brain regions (left hemisphere) based on DSI [25]. In all panels, regional nodes are arranged on a circle, with node colour indicating the degree of the node, that is, the number of its connections (light grey: low degree; dark grey: high degree). Nodes are arranged to minimize the step distance along the circle between connected nodes, thus also indicating regions of densely connected network modules (module borders are indicated through bars outside the circle).
(i). Heterogenous degree distribution
The term random network typically refers to Erdös–Rényi random networks [27], in which potential connections between nodes are established with a probability p. This probability, for a sufficiently large network, is equivalent to the edge density of the network; that is, the connection density. In the creation of random networks, the process of establishing connections resembles flipping a coin where an edge is established with probability p (and not established with probability q = 1 − p). Thus, the distribution of node-degrees follows a binomial probability distribution. Neural networks, however, also contain highly connected nodes, or hubs, that are unlikely to occur in random networks. Examples for such highly connected hubs are subcortical structures, such as the amygdala and hippocampus, or cortical structures, such as the frontal eye field and the lateral intraparietal region [28,29]. Therefore, neural systems have a heterogeneous degree distribution containing hubs and share some of the features of scale-free networks [28,30].
(ii). Modules
Another near-ubiquitous feature of brain networks is the occurrence of modules, within which network nodes are more frequently or densely linked than with the rest of the network [24,31]. Modularization may be a consequence of the increasing specialization and complexity of neural connectivity in larger brain networks [32]. Sensory organs and motor units require functional specialization, which begins with the spatial aggregation of neurons into ganglia or topologically into modules (figure 1c), as in the roundworm Caenorhabditis elegans [33–35]. For the cortical network of the cat (figure 1f), modules correspond to large-scale functional units for fronto-limbic, somatosensory-motor, auditory and visual processing. Spatial and topological modules do not necessarily overlap [36]; however, both tend to be well connected internally, with fewer connections to the rest of the network. There exist a wide range of different algorithms to detect clusters of a network (e.g. [24,37,38]).
(iii). Hierarchy
Another reflection of network complexity is the combination, or encapsulation, of topological features at different scales of network organization, which may be termed hierarchy. For example, small modules may be encapsulated in larger modules, which in turn may be contained in even larger modules, resulting in hierarchical modular networks (figure 1d) [39,40]. One example of such hierarchical modularity is the cortical visual system of the non-human primate, the rhesus macaque monkey. Here, the visual module consists of two network components (figure 1g): the dorsal pathway for processing object movement and the ventral pathway for processing objects' features such as colour and form [23,24,41]. Alternative concepts of network hierarchy exist that are based on a sequential network organization or a local versus global access of network nodes (such as in networks with hubs).
Out of these topological features, hierarchy, though poorly conceptualized at the moment, is particularly interesting. Hierarchical organization is an essential attribute of complex biological networks. It implies across-scales information exchange between local signal processing and global integration [42]. Moreover, hierarchy is linked to aspects of top-down control, regulation and efficiency (e.g. [2,43,44]) and can hint on developmental principles at evolutionary and ontogenetic scales. For example, gene duplication and area specialization have been discussed as generators of hierarchical neural systems. While there has been impressive progress in understanding biological systems at each hierarchical level (e.g. modelling of single neurons, neuroimaging of the whole brain), the across-scales organization of these systems (i.e. how properties on one scale imply functional features on another scale) is much less well understood, but see Breakspear & Stam [45]. In general, hierarchical network features have been rarely analysed and are only poorly understood at the moment.
2. Observations: features of dynamic patterns in complex brain networks
(a). Benchmark networks, brain connectivity examples and model dynamics
We show four different examples for structural brain networks (figure 1e–h), two of which are analysed below regarding the link between topology and dynamics: first, the rat thalamocortical network of 23 cortical and subcortical regions based on tract-tracing studies [20]; second, the cat brain network of 55 cortical and subcortical regions based on tract-tracing [24,31,46]; third, the rhesus monkey network of 30 brain regions of the visual cortex, excluding the less well-characterized areas medial dorsal parietal and medial intraparietal, based on tract-tracing [23,24]; and finally, the network of 33 human cortical regions in the left hemisphere based on diffusion spectrum imaging (DSI) [25]. For visualization purposes, all nodes were arranged such that the step distance along a circle was minimized for connected nodes, resulting in the modular grouping of densely interconnected sets of nodes [31].
Patterns arising in these networks are explored with two different simple dynamics, a reaction–diffusion system and a basic excitable model.
(b). An example of network-shaped self-organized dynamics: Turing patterns on graphs
Let us start with a thought experiment based upon Turing patterns arising in one-dimensional reaction–diffusion systems. In particular, let us consider these patterns established on a discretized one-dimensional system, that is, a (closed) chain of elements.
In order to study such dynamics on arbitrary networks, we here resort to a cellular automaton representation of reaction–diffusion dynamics, similar to the one discussed by Young [47]. The update rule for each node is given by
 |
2.1 |
where d(i,j) denotes the (topological) distance between nodes i and j and Θ(x) yields 1 for x > 0 and −1 otherwise. The quantity H can be considered as an external field biasing the balance of activator (+1) and inhibitor (−1) states. Figure 2a sketches the interaction potential underlying the system from equation (2.1), characterized by the range r1 and strength W1 of the activator and the range r2 and strength W2 of the inhibitor. An example of the patterns arising in this system is shown in figure 2b. Starting from random initial conditions, rapidly a pattern of alternating spatial regions dominated by the activator (light colour) and the inhibitor (dark colour), respectively, emerges.
Figure 2.
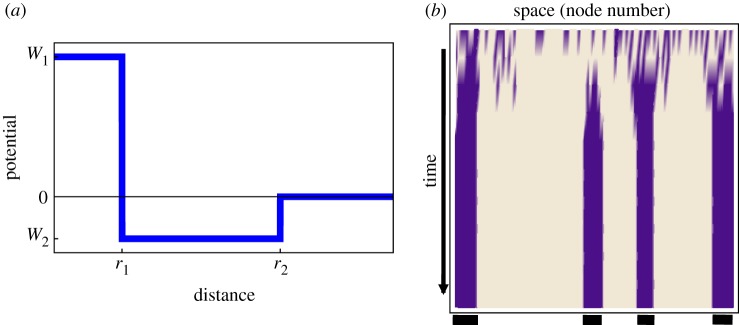
Cellular automation model of a reaction–diffusion system: (a) interaction potential of elements as a function of the distance (adapted from Young [47]); (b) example of a pattern arising in a one-dimensional system (a ring graph); dark colour: high inhibitor, light colour: high activator. Parameters are: r1 = 1, r2 = 3, W1 = 1, W2 = −0.3, H = 3. (Online version in colour.)
This is a striking feature of Turing patterns: in spite of the spatial isotropy, some neighbouring elements are in identical states, whereas others display sharp differences. Here, the dynamics self-organize on a spatially homogeneous system (a chain ‘network’).
The overlay of 100 such asymptotic patterns (figure 3a) shows that each spatial site is equally likely to host any of these two regions.
Figure 3.
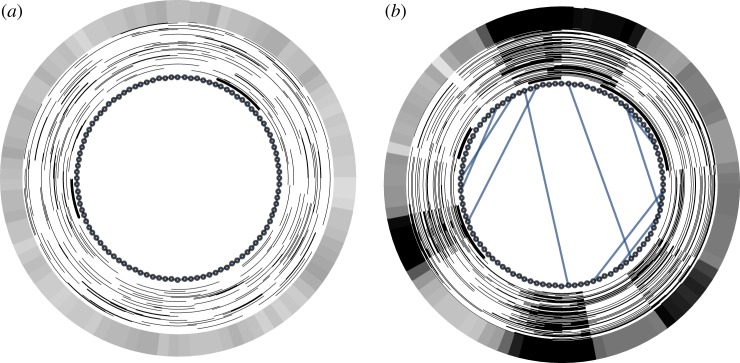
The network is represented on the inside: (a) 100-node ring graph, representing a regular one-dimensional space with periodic boundary conditions; (b) small-world graph obtained from (a) by adding 10 random shortcuts. Around the network, the asymptotic high-activator (white) and high-inhibitor (black) regions are shown as rings for 100 runs, each starting from random initial conditions. The outside ring represents the activator–inhibitor asymmetry (number of runs with high activator minus number of runs with high inhibitor computed across the 100 runs shown) for each node. While the patterns average out on the ring graph (a), the shortcuts select certain topology-compatible modes, leading to systematic high-activator and high-inhibitor regions (b). Parameter values are the same as in figure 2. The representation of asymptotic states arranged around the network is the same as indicated below the space–time plot in figure 2b. (Online version in colour.)
Let us now disrupt the spatial homogeneity by adding a few long-ranging shortcuts. We see (figure 3b) that the range of possible patterns self-organizing on these systems becomes confined by the spatial inhomogeneities. This is the general phenomenon we would like to call network-shaped self-organization.
Figure 4 shows the result of activator–inhibitor dynamics (as given by equation (2.1)) on the empirical networks from figure 1, i.e. for rat, cat, macaque and human. The two main observations are that (i) the phenomenon of network-guided self-organization is also seen in the network topologies derived from empirical data and (ii) apparently, the confinement of patterns is not trivially linked to select topological features (degree, modularity, etc.), but rather seems to arise from the interplay of several of these features.
Figure 4.

Simulation of network dynamics with the same layout as for figure 3, but for the empirical networks shown in figure 1e–h: (a) rat thalamocortical network, (b) cat cortical network, (c) macaque visual cortex and (d) human cortical network (left hemisphere). (Online version in colour.)
(c). Influence of specific topological features on excitable network dynamics
In a range of previous investigations on excitable dynamics on graphs [14,48–50], we have identified several examples of network-shaped self-organization and, in particular, specific topological features serving as ‘organizers’ of self-organized dynamical modes. In the following, we illustrate some of these topological organizers, particularly hubs, modules and network hierarchy.
We use a three-state cellular automaton model of excitable dynamics, representing a stylized biological neuron or population. The model has been termed SER model, as each node can be in an susceptible/excitable (S), active/excited (E) or refractory (R) state. The model operates on discrete time and employs the following synchronous update rules.
A transition from S to E occurs when at least one neighbour of the S state node is active. After one time step in the state E, a node enters the state R. The transition from R to S occurs stochastically with the recovery probability p, leading to a geometric distribution of refractory times with an average of 1/p. The model may also include spontaneous transitions from S to E with a probability f (e.g. [14,48,49]).
In Hütt et al. [50], a model variant with a relative excitation threshold was used. For a node i with ki neighbours, the transition from S to E occurs when at least κki neighbours are active. The parameter κ thus serves as a relative excitation threshold. In such a relative-threshold scenario, low-degree nodes are easier to excite (requiring a smaller number of neighbouring excitations) than high-degree nodes.
For p = f = 1, we have a deterministic model, which was investigated in detail in Garcia et al. [18], where the role of cycles in storing excitations and supporting self-sustained activity was elucidated. The respective influence of hubs (high-degree nodes) and modules in shaping activation patterns has been investigated with a focus on spontaneous excitations [14,49]. By determining the length of unperturbed propagation of excitations, such spontaneous excitations select the ‘topological scale’ on which such patterns can be systematically formed. Relatedly, a phenomenon of stochastic resonance (noise-facilitated signal propagation) has been evidenced in so-called ‘sub-threshold’ networks, that is, for which a single input excitation does not propagate to the output nodes [50].
The discrete dynamics facilitate a discussion of how excitation patterns are shaped by topological features, due to the possibility of exhaustively mapping all system states and the feasibility of computing large numbers of network and parameter variations. The approach allowed us to assess qualitatively contributions to functional connectivity and the relationship between structural and functional connectivity.
Let  be the state of node i at time t. It is convenient to discuss the excitation pattern instead
In this way, we can define a co-activation matrix,
and also a time-delayed co-activation matrix (or signal propagation matrix),
Figures 5 and 6 compare several minimal topological situations in the context of possible contributions to these matrices. Figure 5a shows a three-chain with an excitation entering at the middle node, leading to a joint excitation at the other two nodes and, consequently, a contribution to Cij. Even though other entry points of excitations, as well as an embedding of this small network ‘motif’ into a larger network lead to a multitude of other contributions to both Cij and Ci→j, we can nevertheless deduce that common neighbours lead to an increase in synchronous activity. When a link is added to the two nodes under consideration (thus moving from a three-chain to a three-node loop), the sequential excitation of the two nodes becomes possible (in addition to the previous modes), thus allowing for a contribution to Ci→j.
Figure 5.
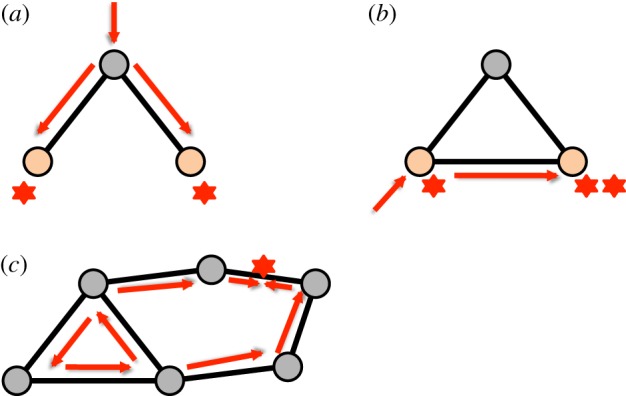
Schematic of the minimal topological situations underlying co-activation of nodes: (a) co-activation by a common neighbour, (b) sequential activation due to direct links and (c) enslavement of nodes by a short (here three-node) cycle. (Online version in colour.)
Figure 6.

Schematic of the minimal topological situations leading to ring waves around hubs: (a) an incoming excitation activates the hub and leads to a subsequent excitation of all susceptible nearest neighbours; (b) susceptible nodes with a distance of 2 from the hub are then synchronously activated in the following time step. (Online version in colour.)
Figure 5c illustrates a more sophisticated contribution to network-shaped self-organization, namely the enslavement of nodes by periodic activity of short cycles. This phenomenon has been analysed in detail in Garcia et al. [18].
(i). Heterogeneous degree distribution
A heterogeneous degree distribution means that some nodes have more connections than others, resulting in the occurrence of hubs, which also have characteristic dynamic features. First, hubs are more active than low-degree nodes. Second, Garcia et al. [18] showed that the node degree is linked to the directed propagation of activity: high-degree nodes (hubs) act as ‘senders’, whereas low-degree nodes act predominantly as ‘receivers’ of activity. The reasons for this behaviour are indicated in figure 6 which illustrates the minimal topological mechanism of how propagating waves organize around hubs (as explored by Müller-Linow et al. [14]): single incoming excitations at a hub are amplified and spread out in a time-synchronous fashion. On a long time scale, the overlay of many such events leads to substantial contributions to Cij in cases where nodes i and j have the same distance from the hub.
(ii). Modules
In sparsely connected graphs, events of apparent transfer of activity between nodes correspond to actual causal transfers. In such graphs, there may exist a correlation or even anti-correlation between structural links and co-activations, depending on the parameters of the specific dynamic model. For instance, in the simple deterministic SER model outlined above, sparse random graphs show an anti-correlation between structural links and co-activations [18]. In denser networks, not all apparent transfers of activity correspond to actual causal transfers. In particular, in dense local neighbourhoods of networks, that is, within modules, the local (anti-)correlation between links and co-activations becomes reshaped by the larger scale network features. Specifically, common input of activity from within the same modules results in modular co-activations and appearance of correlation between pairwise links and co-activations [18]. This is an important finding, because it suggests that the frequently made observation between structural and functional links in brain connectivity [51,52] is primarily induced by the modular organization of such networks.
(iii). Hierarchy
Hierarchy can be expressed by different topological features of a network, such as a combination or encapsulation of features, or sequential arrangements of connectivity. Consequently, there may be different ways in which hierarchy shapes neural dynamics. For example, in hierarchical networks combining modular and hub features, one can observe either hub- or module-driven dynamics of the kind discussed above. These dynamics switch depending on the amount of spontaneous node activation or noise in the system [14]. Therefore, this particular hierarchical arrangement provides a transition between different dynamic regimes.
Neural systems are implicitly and explicitly hierarchical. They are explicitly hierarchical, because in many cases the functional components are spread over many scales in space and time (e.g. single ion channels up to brain areas). They are implicitly hierarchical, because their organization and underlying interaction patterns (at a specific spatial or temporal scale) often have a nested and layered structure. This implicit hierarchical organization (the network-related hierarchy) has been implicated in a variety of optimal behaviours and dynamic functions by merging different topological features (e.g. modularity and integration). Moreover, hierarchy is related to the compressibility of random walks [53], to the coexistence of time scales [12], to the range of possible responses upon stimulation [14] and to the storage of patterns in the networks [54]. The impact a hierarchical structure leaves in dynamical processes can qualitatively be described as multi-scale patterns: the distribution of dynamical values across the graph remains invariant under topological coarse-graining (or, more specifically, it obeys well-defined scaling relationships, when such coarse-graining is performed iteratively [44]).
More generally, hierarchical (modular) networks facilitate network-sustained activity [40,55,56], which is a precondition for criticality. The link between network topology and criticality can be made explicit via the topological dimension, which is finite for some (in particular, sparse) hierarchical modular networks, resulting in expanded parameter regimes for criticality, so-called Griffiths phases [57].
3. Conclusion
(a). A new perspective of neural network dynamics
If the brain were a lattice, neural activity would necessarily produce rich and diverse spatio-temporal patterns, such as spiral waves, synchronous oscillations and concentric waves emanating from periodically firing pacemakers. Noise would be able to interact with the deterministic dynamics to produce coherent activity from, for instance, subthreshold activity. The system would thus display noise-facilitated, noise-induced and noise-sustained patterns, according to well-established principles of self-organizing patterns. Quite obviously, the brain is not a lattice. Neither can a random graph serve as a plausible representation of the intricate overlay of structural elements on all scales observed in real biological neural networks.
Here, we have formulated a new perspective on neural dynamics by drawing on concepts of spatio-temporal pattern formation. The heterogeneous network architecture is then viewed as a structural property confining patterns to few possible, network-compliant modes. Typical network analyses highlight and investigate deviations from random graphs. Our perspective draws attention to the deviations from regular graphs, as these deviations are the pattern-confining structural elements.
(b). Specific implications for understanding brain dynamics
What concrete evidence exists for network-guided self-organization in neurobiological data? Based on the topological ingredients discussed in §1c and the subsequent detailed analysis of different dynamical processes on graphs in §2, the notion of network-guided pattern formation points to several building blocks of excitation patterns relevant to neural dynamics and shaped by network topology:
(1) hubs leading to the propagation of waves [14],
(2) modules leading to localized synchronization, which in turn results in a strong agreement between structural and functional connectivity (as discussed by Garcia et al. [18]); and
(3) hierarchical network organization with the potential of facilitating self-sustained activity, criticality, as well as transitions between different dynamical behaviours (see, in particular, Müller-Linow et al. [14] for the latter point).
Indeed, characteristic spatio-temporal patterns and their implications for functional neural dynamics have been demonstrated in different models of biological neural networks as well as for empirical data. For instance, in the large-scale thalamocortical model of Izhikevich & Edelman [58], the authors describe the emergence of waves and rhythms on different scales. Additional empirical examples are spreading depression waves associated with retinal migraine [59] and spiral wave dynamics in the neocortex [60].
The spatial embedding of the networks can be a principal factor for the arising patterns: activity is spreading to nearby or adjacent patches of neural tissue, in which case networks form a grid or lattice on the brain surface [61]. Qualitatively speaking, patterns are observed in spite of the network, rather than due to the network. By contrast, the phenomenon discussed in this paper addresses the possibility of self-organized patterns where spatial embedding is not the determining factor of the dynamic behaviour. In biological terms, connections might link distant brain regions disturbing spatially localized dynamics [36,62]. Moreover, these long-distance connections might not even affect delays for activity diffusion due to increased axon diameter or myelination [63]. In these cases, the network topology as such dictates the permissible self-organized patterns.
The most striking example of network-guided self-organization has been discussed in Moretti & Munoz [57], where network heterogeneity generates regions in the network with long activity transients (see also [64,65]). In Moretti & Munoz [57], such Griffiths phase dynamics were suggested as a mechanism for self-sustained activity and critical dynamical states that do not require a careful parameter tuning. Similar to the Turing patterns arising from reaction–diffusion dynamics and the excitation waves around hubs discussed on §2c(i) and figure 6, these dynamics are (less regular) forms of collective dynamic behaviours emerging from local interactions.
Criticality is one example of pattern-like self-organized collective dynamics. The importance of critical dynamical states, associated with power-law distributions of activity, has been intensely debated in neuroscience (e.g. [66,67]).
Remarkably, the network prerequisites discussed for Griffiths phase dynamics and a resulting expanded parameter range for criticality (in particular a specific ‘spectral fingerprint’ [57] which can be directly computed from the adjacency matrix) are similar to the requirements for Turing instability on graphs [13] and the synchronizability of graphs [68].
A series of observations on the agreement of structural and functional connectivity recently established using a simple model of excitable dynamics on graphs [18] provide further evidence for network-guided self-organization, in particular, the observation that modules enhance the match between structural and functional connectivity in the (dense) modules, while a broad degree distribution tends to reduce the match due to the organization of activity around hubs. Figure 7, as well as the discussions by Garcia et al. [18], provide detailed accounts of these associations. The effects captured by the schematic representations of local dynamics shown in figures 5 and 6 are the underlying microscopic mechanisms for the coactivation patterns observed in figure 7.
Figure 7.

Cortical connectivity of the cat (a–c) and macaque visual cortex (d–f), together with the resulting activation patterns. Column (a,d): adjacency matrix (intra-module links are represented in black and inter-module links are represented in grey). Column (b,e): average co-activation matrix Cij binarized with a threshold of 0.46. Column (c,f): time-delayed co-activation (or signal propagation) matrix Ci→j binarized with a threshold of 0.28. Figure adapted from Garcia et al. [18].
Modular node activations, and anti-correlations of different modules, are a prominent and conspicuous feature of functional neural dynamics (e.g. Fox et al. [69]). They have been reproduced in a variety of large-scale computational modes (e.g. [70,71]). Our thinking suggests that this phenomenon may primarily result from the spatio-temporal pattern formation in modular neural networks, rather than depend on particular parameters of the local node dynamics.
As a further example, in Hütt et al. [50], it has been observed that signal coherence (measured by the amount of interdependent excitations) is enhanced by noise in a resonant fashion, with noise being provided by spontaneous excitations. This collective effect is similar to the well-known phenomenon of spatio-temporal stochastic resonance [72].
Finally and generally, the structural ingredients of self-sustained activity have been intensely discussed over the past few years (e.g. Deco et al. [71,73]). Network-guided self-organization may provide a promising novel framework for better understanding the network requirements for such collective dynamic states of neuronal activity.
Funding statement
M.T.H. is supported by DFG grant no. HU 937/7-1. M.K. was supported by the WCU programme through the KOSEF funded by the MEST (R31-10089), EPSRC (EP/K026992/1) and the CARMEN e-science project (http://www.carmen.org.uk) funded by EPSRC (EP/E002331/1). C.C.H. is supported by DFG grant nos. HI 1286/5-1 and SFB 936/A1.
References
- 1.Strogatz SH. 2001. Exploring complex networks. Nature 410, 268–276. ( 10.1038/35065725) [DOI] [PubMed] [Google Scholar]
- 2.Barabási A-L, Oltvai ZN. 2004. Network biology: understanding the cell's functional organization. Nat. Rev. Genet. 5, 101–113. ( 10.1038/nrg1272) [DOI] [PubMed] [Google Scholar]
- 3.Barabási A-L. 2012. The network takeover. Nat. Phys. 8, 14–16. ( 10.1038/nphys2188) [DOI] [Google Scholar]
- 4.Bullmore E, Sporns O. 2009. Complex brain networks: graph theoretical analysis of structural and functional systems. Nat. Rev. Neurosci. 10, 186–198. ( 10.1038/nrn2575) [DOI] [PubMed] [Google Scholar]
- 5.Sporns O. 2011. Networks of the brain. Cambridge, MA: MIT Press. [Google Scholar]
- 6.Mikhailov AS, Calenbuhr V. 2002. From cells to societies: models of complex coherent action. Berlin, Germany: Springer. [Google Scholar]
- 7.Levine H, Ben-Jacob E. 2004. Physical schemata underlying biological pattern formation: examples, issues and strategies. Phys. Biol. 1, P14–P22. ( 10.1088/1478-3967/1/2/P01) [DOI] [PubMed] [Google Scholar]
- 8.Kessler D, Levine H. 1993. Pattern formation in Dictyostelium via the dynamics of cooperative biological entities. Phys. Rev. E 48, 4801–4804. ( 10.1103/PhysRevE.48.4801) [DOI] [PubMed] [Google Scholar]
- 9.Sawai S, Thomason P, Cox E. 2005. An autoregulatory circuit for long-range self-organization in Dictyostelium cell populations. Nature 433, 323–326. ( 10.1038/nature03228) [DOI] [PubMed] [Google Scholar]
- 10.Geberth D, Hütt M. 2009. Predicting the distribution of spiral waves from cell properties in a developmentalpath model of Dictyostelium pattern formation. PLoS Comput. Biol. 5, e1000422 ( 10.1371/journal.pcbi.1000422) [DOI] [PMC free article] [PubMed] [Google Scholar]
- 11.Turing AM. 1952. The chemical basis of morphogenesis. Phil. Trans. R. Soc. Lond. B 237, 37–72. ( 10.1098/rstb.1952.0012) [DOI] [PMC free article] [PubMed] [Google Scholar]
- 12.Arenas A, Díaz-Guilera A, Pérez-Vicente C. 2006. Synchronization reveals topological scales in complex networks. Phys. Rev. Lett. 96, 114102 ( 10.1103/PhysRevLett.96.114102) [DOI] [PubMed] [Google Scholar]
- 13.Nakao H, Mikhailov AS. 2010. Turing patterns in network-organized activator-inhibitor systems. Nat. Phys. 6, 544–550. [Google Scholar]
- 14.Müller-Linow M, Hilgetag CC, Hütt M-T. 2008. Organization of excitable dynamics in hierarchical biological networks. PLoS Comput. Biol. 4, e1000190 ( 10.1371/journal.pcbi.1000190) [DOI] [PMC free article] [PubMed] [Google Scholar]
- 15.Wang QY, Perc M, Duan ZS, Chen GR. 2010. Spatial coherence resonance in delayed Hodgkin–Huxley neuronal networks. Int. J. Mod. Phys. B 24, 1201–1213. ( 10.1142/S0217979210055317) [DOI] [Google Scholar]
- 16.Liao X, Xia Q, Qian Y, Zhang L, Hu G, Mi Y. 2011. Pattern formation in oscillatory complex networks consisting of excitable nodes. Phys. Rev. E 83, 056204 ( 10.1103/PhysRevE.83.056204) [DOI] [PubMed] [Google Scholar]
- 17.Qian Y, Huang X, Hu G, Liao X. 2010. Structure and control of self-sustained target waves in excitable small-world networks. Phys. Rev. E 81, 036101 ( 10.1103/PhysRevE.81.036101) [DOI] [PubMed] [Google Scholar]
- 18.Garcia GC, Lesne A, Hütt M, Hilgetag CC. 2012. Building blocks of self-sustained activity in a simple deterministic model of excitable neural networks. Front. Comput. Neurosci. 6, 50 ( 10.3389/fncom.2012.00050) [DOI] [PMC free article] [PubMed] [Google Scholar]
- 19.Leyva I, Navas A, Sendiña Nadal I, Buldú JM, Almendral JA, Boccaletti S. 2011. Synchronization waves in geometric networks. Phys. Rev. E, 84, 065101 ( 10.1103/PhysRevE.84.065101) [DOI] [PubMed] [Google Scholar]
- 20.Burns GAPC, Young MP. 2000. Analysis of the connectional organization of neural systems associated with the hippocampus in rats. Phil. Trans. R. Soc. Lond. B 355, 55–70. ( 10.1098/rstb.2000.0549) [DOI] [PMC free article] [PubMed] [Google Scholar]
- 21.Scannell J, Blakemore C, Young M. 1995. Analysis of connectivity in the cat cerebral cortex. J. Neurosci. 15, 1463–1483. [DOI] [PMC free article] [PubMed] [Google Scholar]
- 22.Scannell JW, Burns GA, Hilgetag CC, O'Neil MA, Young MP. 1999. The connectional organization of the cortico-thalamic system of the cat. Cereb. Cortex 9, 277–299. ( 10.1093/cercor/9.3.277) [DOI] [PubMed] [Google Scholar]
- 23.Felleman DJ, van Essen DC. 1991. Distributed hierarchical processing in the primate cerebral cortex. Cereb. Cortex 1, 1–47. ( 10.1093/cercor/1.1.1) [DOI] [PubMed] [Google Scholar]
- 24.Hilgetag C-C, Burns GAPC, O'Neill MA, Scannell JW, Young MP. 2000. Anatomical connectivity defines the organization of clusters of cortical areas in the macaque monkey and the cat. Phil. Trans. R. Soc. Lond. B 355, 91–110. ( 10.1098/rstb.2000.0551) [DOI] [PMC free article] [PubMed] [Google Scholar]
- 25.Hagmann P, Cammoun L, Gigandet X, Meuli R, Honey CJ, Wedeen VJ, Sporns O. 2008. Mapping the structural core of human cerebral cortex. PLoS Biol. 6, e159 ( 10.1371/journal.pbio.0060159) [DOI] [PMC free article] [PubMed] [Google Scholar]
- 26.Kaiser M, Varier S. 2011. Evolution and development of brain networks: from Caenorhabditis elegans to Homo sapiens. Network Comput. Neural Syst. 22, 143–147. [DOI] [PubMed] [Google Scholar]
- 27.Erdös P, Rényi A. 1960. On the evolution of random graphs. Publ. Math. Inst. Hung. Acad. Sci. 5, 17–61. [Google Scholar]
- 28.Kaiser M, Martin R, Andras P, Young MP. 2007. Simulation of robustness against lesions of cortical networks. Eur. J. Neurosci. 25, 3185–3192. ( 10.1111/j.1460-9568.2007.05574.x) [DOI] [PubMed] [Google Scholar]
- 29.Sporns O, Honey CJ, Kötter R. 2007. Identification and classification of hubs in brain networks. PLoS ONE 2, e1049 ( 10.1371/journal.pone.0001049) [DOI] [PMC free article] [PubMed] [Google Scholar]
- 30.Eguíluz VM, Chialvo DR, Cecchi G, Baliki M, Apkarian AV. 2005. Scale-free brain functional networks. Phys. Rev. Lett. 94, 018102 ( 10.1103/PhysRevLett.94.018102) [DOI] [PubMed] [Google Scholar]
- 31.Hilgetag CC, Kaiser M. 2004. Clustered organisation of cortical connectivity. Neuroinformatics 2, 353–360. ( 10.1385/NI:2:3:353) [DOI] [PubMed] [Google Scholar]
- 32.Sporns O, Tononi G, Edelman GM. 2000. Theoretical neuroanatomy: relating anatomical and functional connectivity in graphs and cortical connection matrices. Cereb. Cortex 10, 127–141. ( 10.1093/cercor/10.2.127) [DOI] [PubMed] [Google Scholar]
- 33.White JG, Southgate E, Thomson JN, Brenner S. 1986. The structure of the nervous system of the nematode Caenorhabditis elegans. Phil. Trans. R. Soc. Lond. B 314, 1–340. ( 10.1098/rstb.1986.0056) [DOI] [PubMed] [Google Scholar]
- 34.Achacoso T, Yamamoto W. 1992. AY’s neuroanatomy of C. elegans for computation. Boca Raton, FL: CRC Press. [Google Scholar]
- 35.Cherniak C. 1994. Component placement optimization in the brain. J. Neurosci. 14, 2418–2427. [DOI] [PMC free article] [PubMed] [Google Scholar]
- 36.Costa LdF, Kaiser M, Hilgetag CC. 2007. Predicting the connectivity of primate cortical networks from topological and spatial node properties. BMC Syst. Biol. 1, 16 ( 10.1186/1752-0509-1-16) [DOI] [PMC free article] [PubMed] [Google Scholar]
- 37.Girvan M, Newman MEJ. 2002. Community structure in social and biological networks. Proc. Natl Acad. Sci. USA 99, 7821–7826. ( 10.1073/pnas.122653799) [DOI] [PMC free article] [PubMed] [Google Scholar]
- 38.Palla G, Derenyi I, Farkas I, Vicsek T. 2005. Uncovering the overlapping community structure of complex networks in nature and society. Nature 435, 814–818. ( 10.1038/nature03607) [DOI] [PubMed] [Google Scholar]
- 39.Sporns O. 2006. Small-world connectivity, motif composition, and complexity of fractal neuronal connections. Biosystems 85, 55–64. ( 10.1016/j.biosystems.2006.02.008) [DOI] [PubMed] [Google Scholar]
- 40.Kaiser M, Görner M, Hilgetag C. 2007. Criticality of spreading dynamics in hierarchical cluster networks without inhibition. New J. Phys. 9, 110 ( 10.1088/1367-2630/9/5/110) [DOI] [Google Scholar]
- 41.Young MP. 1992. Objective analysis of the topological organization of the primate cortical visual system. Nature 358, 152–155. ( 10.1038/358152a0) [DOI] [PubMed] [Google Scholar]
- 42.Friston K. 2008. Hierarchical models in the brain. PLoS Comput. Biol. 4, e1000211 ( 10.1371/journal.pcbi.1000211) [DOI] [PMC free article] [PubMed] [Google Scholar]
- 43.Yu H, Gerstein M. 2006. Genomic analysis of the hierarchical structure of regulatory networks. Proc. Natl Acad. Sci. USA 103, 14 724–14 731. ( 10.1073/pnas.0508637103) [DOI] [PMC free article] [PubMed] [Google Scholar]
- 44.Gallos LK, Song C, Havlin S, Makse HA. 2007. Scaling theory of transport in complex biological networks. Proc. Natl Acad. Sci. USA 104, 7746–7751. ( 10.1073/pnas.0700250104) [DOI] [PMC free article] [PubMed] [Google Scholar]
- 45.Breakspear M, Stam CJ. 2005. Dynamics of a neural system with a multiscale architecture. Phil. Trans. R. Soc. B 360, 1051–1074. ( 10.1098/rstb.2005.1643) [DOI] [PMC free article] [PubMed] [Google Scholar]
- 46.Sporns O, Chialvo DR, Kaiser M, Hilgetag CC. 2004. Organization, development and function of complex brain networks. Trends Cogn. Sci. 8, 418–425. ( 10.1016/j.tics.2004.07.008) [DOI] [PubMed] [Google Scholar]
- 47.Young DA. 1984. A local activator-inhibitor model of vertebrate skin patterns. Math. Biosci. 72, 51–58. ( 10.1016/0025-5564(84)90060-9) [DOI] [Google Scholar]
- 48.Müller-Linow M, Marr C, Hütt M. 2006. Topology regulates the distribution pattern of excitations in excitable dynamics on graphs. Phys. Rev. E 74, 1–7. ( 10.1103/PhysRevE.74.016112) [DOI] [PubMed] [Google Scholar]
- 49.Hütt M, Lesne A. 2009. Interplay between topology and dynamics in excitation patterns on hierarchical graphs. Front. Neuroinform. 3, O28 ( 10.3389/neuro.11.028.2009) [DOI] [PMC free article] [PubMed] [Google Scholar]
- 50.Hütt M-T, Jain M, Hilgetag CC, Lesne A. 2012. Stochastic resonance in discrete excitable dynamics on graphs. Chaos Solitons Fractals 45, 611–618. ( 10.1016/j.chaos.2011.12.011) [DOI] [Google Scholar]
- 51.Haimovici A, Tagliazucchi E, Balenzuela P, Chialvo DR. 2013. Brain organization into resting state networks emerges at criticality on a model of the human connectome. Phys. Rev. Lett. 110, 178101 ( 10.1103/PhysRevLett.110.178101) [DOI] [PubMed] [Google Scholar]
- 52.Honey CJ, Sporns O, Cammoun L, Gigandet X, Thiran JP, Meuli R, Hagmann P. 2009. Predicting human resting-state functional connectivity from structural connectivity. Proc. Natl Acad. Sci. USA 106, 2035–2040. ( 10.1073/pnas.0811168106) [DOI] [PMC free article] [PubMed] [Google Scholar]
- 53.Rosvall M, Bergstrom CT. 2011. Multilevel compression of random walks on networks reveals hierarchical organization in large integrated systems. PLoS ONE 6, e18209 ( 10.1371/journal.pone.0018209) [DOI] [PMC free article] [PubMed] [Google Scholar]
- 54.Kashtan N, Noor E, Alon U. 2007. Varying environments can speed up evolution. Proc. Natl Acad. Sci. USA 104, 13 711–13 716. ( 10.1073/pnas.0611630104) [DOI] [PMC free article] [PubMed] [Google Scholar]
- 55.Kaiser M, Hilgetag CC. 2010. Optimal hierarchical modular topologies for producing limited sustained activation of neural networks. Front. Neuroinform. 4, 8 ( 10.3389/fninf.2010.00112) [DOI] [PMC free article] [PubMed] [Google Scholar]
- 56.Wang S-J, Hilgetag CC, Zhou C. 2011. Sustained activity in hierarchical modular neural networks: self-organized criticality and oscillations. Front. Comput. Neurosci. 5, 30. [DOI] [PMC free article] [PubMed] [Google Scholar]
- 57.Moretti P, Munoz MA. 2013. Griffiths phases and the stretching of criticality in brain networks. Nat. Commun. 4, 1–10. ( 10.1038/ncomms3521) [DOI] [PubMed] [Google Scholar]
- 58.Izhikevich E, Edelman G. 2008. Large-scale model of mammalian thalamocortical systems. Proc. Natl Acad. Sci. USA 105, 3593–3598. ( 10.1073/pnas.0712231105) [DOI] [PMC free article] [PubMed] [Google Scholar]
- 59.Yu Y, et al. 2012. Reentrant spiral waves of spreading depression cause macular degeneration in hypoglycemic chicken retina. Proc. Natl Acad. Sci. USA 109, 2585–2589. ( 10.1073/pnas.1121111109) [DOI] [PMC free article] [PubMed] [Google Scholar]
- 60.Huang X, Xu W, Liang J, Takagaki K, Gao X, Wu J-Y. 2010. Spiral wave dynamics in neocortex. Neuron 68, 978–990. ( 10.1016/j.neuron.2010.11.007) [DOI] [PMC free article] [PubMed] [Google Scholar]
- 61.O'Dea R, Crofts JJ, Kaiser M. 2013. Spreading dynamics on spatially constrained complex brain networks. J. R. Soc. Interface 10, 20130016 ( 10.1098/rsif.2013.0016) [DOI] [PMC free article] [PubMed] [Google Scholar]
- 62.Knock SA, McIntosh AR, Sporns O, Kötter R, Hagmann P, Jirsa VK. 2009. The effects of physiologically plausible connectivity structure on local and global dynamics in large scale brain models. J. Neurosci. Methods 183, 86–94. ( 10.1016/j.jneumeth.2009.07.007) [DOI] [PubMed] [Google Scholar]
- 63.Buzsaki G, Logothetis N, Singer W. 2013. Scaling brain size, keeping timing: evolutionary preservation of brain rhythms. Neuron 80, 751–764. ( 10.1016/j.neuron.2013.10.002) [DOI] [PMC free article] [PubMed] [Google Scholar]
- 64.Hilgetag CC, Hütt M-T. 2014. Hierarchical modular brain connectivity is a stretch for criticality. Trends Cogn. Sci. 18, 114–115. ( 10.1016/j.tics.2013.10.016) [DOI] [PubMed] [Google Scholar]
- 65.Munoz MA, Juhasz R, Castellano C, Odor G. 2010. Griffiths phases on complex networks. Phys. Rev. Lett. 105, 128701 ( 10.1103/PhysRevLett.105.128701) [DOI] [PubMed] [Google Scholar]
- 66.Rubinov M, Sporns O, Thivierge J-P, Breakspear M. 2011. Neurobiologically realistic determinants of self-organized criticality in networks of spiking neurons. PLoS Comput. Biol. 7, e1002038 ( 10.1371/journal.pcbi.1002038) [DOI] [PMC free article] [PubMed] [Google Scholar]
- 67.Tagliazucchi E, Balenzuela P, Fraiman D, Chialvo DR. 2012. Criticality in large-scale brain FMRI dynamics unveiled by a novel point process analysis. Front. Physiol. 3, 15 ( 10.3389/fphys.2012.00015) [DOI] [PMC free article] [PubMed] [Google Scholar]
- 68.Arenas A, Díaz-Guilera A, Kurths J, Moreno Y, Zhou C. 2008. Synchronization in complex networks. Phys. Rep. 469, 93–153. ( 10.1016/j.physrep.2008.09.002) [DOI] [Google Scholar]
- 69.Fox MD, Snyder AZ, Vincent JL, Corbetta M, Van Essen DC, Raichle ME. 2005. The human brain is intrinsically organized into dynamic, anticorrelated functional networks. Proc. Natl Acad. Sci. USA 102, 9673–9678. ( 10.1073/pnas.0504136102) [DOI] [PMC free article] [PubMed] [Google Scholar]
- 70.Honey CJ, Kötter R, Breakspear M, Sporns O. 2007. Network structure of cerebral cortex shapes functional connectivity on multiple time scales. Proc. Natl Acad. Sci. USA 104, 10240–10245. ( 10.1073/pnas.0701519104) [DOI] [PMC free article] [PubMed] [Google Scholar]
- 71.Deco G, Jirsa V, McIntosh AR, Sporns O, Kotter R. 2009. Key role of coupling, delay, and noise in resting brain fluctuations. Proc. Natl Acad. Sci. USA 106, 10 302–10 307. ( 10.1073/pnas.0901831106) [DOI] [PMC free article] [PubMed] [Google Scholar]
- 72.Jung P, Mayer-Kress G. 1995. Spatiotemporal stochastic resonance in excitable media. Phys. Rev. Lett. 74, 2130–2133. ( 10.1103/PhysRevLett.74.2130) [DOI] [PubMed] [Google Scholar]
- 73.Deco G, Jirsa VK, Mcintosh AR. 2011. Emerging concepts for the dynamical organization of resting-state activity in the brain. Nat. Rev. Neurosci. 12, 43–56. ( 10.1038/nrn2961) [DOI] [PubMed] [Google Scholar]