

Abstract
Functional coupling across distributed brain regions varies across task contexts, yet there are stable features. To better understand the range and central tendencies of network configurations, coupling patterns were explored using functional MRI (fMRI) across 14 distinct continuously performed task states ranging from passive fixation to increasingly demanding classification tasks. Mean global correlation profiles across the cortex ranged from 0.69 to 0.82 between task states. Network configurations from both passive fixation and classification tasks similarly predicted task coactivation patterns estimated from meta-analysis of the literature. Thus, even across markedly different task states, central tendencies dominate the coupling configurations. Beyond these shared components, distinct task states displayed significant differences in coupling patterns in response to their varied demands. One possibility is that anatomical connectivity provides constraints that act as attractors pulling network configurations towards a limited number of robust states. Reconfigurable coupling modes emerge as significant modifications to a core functional architecture.
Keywords: functional connectivity, resting-state, cortical networks, MRI, intrinsic connectivity
1. Introduction
Recorded under similar conditions over an extended period of time, the human brain possesses a stable set of functionally coupled networks that echo many known features of anatomical organization [1–13]. The same ‘usual suspects’—that is, large-scale, distributed cortical and subcortical networks—tend to recur. This observation emphasizes stability in the spatial patterns of functional connectivity MRI (fcMRI) signals.
However, reconfigurations can be directly induced by changing the behavioural task or behavioural context [14–39]. For example, employing a pattern classification approach, Shirer et al. [27] distinguished functional connectivity patterns obtained from four covert cognitive task states. These patterns could be identified across independent cohorts of subjects with high accuracy.
Such reliable changes raise the question of which cognitive state(s), if any, produce the most representative patterns of functional coupling [36], and what dynamic range should be expected across substantially varied behavioural paradigms. Intrinsic fluctuations of activity within, as well as outside, task-relevant brain regions have been observed to affect subsequent behaviour [40–42]. These empirical observations underscore the point that intrinsic fluctuations and changes in connectivity are functionally relevant [43–52]. However, they also complicate efforts to use functional connectivity approaches to determine which features of network organization are invariant across states and which are state-dependent.
This paper explores both stable and reconfigurable features of functional organization to provide insight into this question (see also [37]). Our goals are both conceptual and practical. In terms of conceptual goals, we sought to understand how network configurations change across a broad range of task states to better characterize what is stable and what is reconfigurable in terms of network organization. Data from 14 short, continuous tasks were collected from a large sample of participants (N = 48). Two features of the experimental design were central to our investigation. First, the tasks were all continuous—subjects engaged trial after trial of the same task without jittered gaps or long pauses to create, to the degree possible, constant task states. Second, the studied tasks differed markedly along multiple dimensions to maximally survey a broad range of task states. Tasks ranged from passive activities to stimulus-driven classification paradigms with auditory and visual stimuli. Some tasks were made to be difficult and others easy, and some demanded attention to single modalities while others required multiple modalities. In terms of practical goals, this diversity of tasks also allowed us to ask a basic question: since fcMRI is so widely used in the field to glean insight into network organization, to what degree are results reported in the literature dependent on the specific task used at acquisition?
To foreshadow the findings, we observed that reconfigurations varied around a central tendency of coupling patterns that was evident across all tasks. Relevant to the practical use of fcMRI to identify network organization, certain broad properties appear to be robust across a wide range of acquisition states, probably because they reflect the most stable, anatomically constrained configurations. However, details differ from task state to task state and it is unclear whether any particular state provides a privileged view of cortical organization. Our discussion of the implications of these observations is motivated by several recent papers that have also grappled with the observation of both stable and dynamic components of functional network configurations [48–53].
2. Material and methods
(a). Participants
Participants (N = 48) were scanned across a battery of 14 short tasks in a single session (ages 18–35; mean age 20.8; 46% male). Participants had no history of mental illness and had normal or corrected-to-normal vision and normal hearing. Written informed consent in accordance with guidelines set by institutional review boards of Harvard University was obtained from each subject prior to data collection.
(b). Behavioural tasks
Participants completed one run each of 14 continuous tasks. Tasks were run in separate scans and were grouped into three domains: Passive (4), Sensory (6) and Word (4). These domains were counterbalanced across participants. Each set of tasks within each domain was also counterbalanced. While the task demands and stimuli varied across domain sets, an important feature common to all tasks is that they were run in continuous blocks that contained no extended inter-trial intervals or null events besides extended (30 s) periods of passive fixation at the beginning and end of each run. Participants performed each task once.
A central fixation crosshair (plus sign) was present throughout all runs. Runs always began with a passive fixation period lasting 30 s. Following this, the word START appeared indicating that participants should begin performing the task. Task blocks lasted 180 s. Participants were instructed to perform the task continuously until the word STOP appeared, after which they returned to passively fixating for the remainder of the run (27 s). Subjects were only included in analyses if good-quality data (temporal signal-to-noise ratio (SNR) > 100; [54]) were available for all 14 tasks, resulting in a final sample size of 48 participants (58 participants were enrolled and 10 participants were excluded for low SNR or for incomplete sessions).
(i). Passive tasks
The Passive tasks were a set of tasks that manipulated cognitive processes through instruction without introducing different stimuli or demanding any overt motor responses. The Count task was a silent, self-paced counting task in which participants counted backwards from 1000 by threes. In the Imagine task, participants were told to imagine living out the next day, starting from the time they woke. A third Fixate task consisted of passively fixating the central crosshair. Finally, the Monitor task required participants to continue to fixate the centre crosshair while broadening their attention covertly to monitor for the possible appearance of a rare, briefly presented small dot. In no instance were dots actually presented during the run, rendering this task perceptually identical to the other tasks. Thus, in all of the Passive tasks, the actual stimulus presented and run structure were identical. What the participants did passively during the middle 180 s blocks differed across tasks based on pre-scan instructions and on subject expectations (see [55] for a similar paradigm design). Note that the use of the term ‘passive’ is intended to refer to the absence of external (motor) response requirements in this set of tasks, as well as the absence of externally delivered stimuli. See the electronic supplementary material for additional discussion and details of the tasks.
(ii). Sensory tasks
Participants completed two runs of an Auditory detection task, two runs of a Visual discrimination task and two runs of a combined Auditory/Visual task. In each run pair, one run contained high-fidelity stimuli (high volume complex tones, high visual contrast Gabor gratings, or both in the auditory/visual case) and the other contained low-fidelity stimuli (weak tones, gratings or both). Low-fidelity volume and contrast levels were set individually prior to the experimental run according to participants' discrimination thresholds (see the electronic supplementary material).
In all Sensory tasks, the low-fidelity stimuli caused longer response times and lower accuracy, as expected. Hence, the term ‘easy’ is used throughout to designate task conditions that used high-fidelity stimuli, and ‘hard’ designates tasks that used low-fidelity stimuli.
In the auditory detection task, participants indicated with a left- or right-hand button press whether they perceived a complex tone on the left or right side.
In the visual discrimination task, participants judged the orientation of peripherally presented Gabor contrast gratings (presented 7° off-centre). Responses were made with the index or middle finger of the hand congruent to the visual stimulus.
In the combined auditory/visual task, the tone and Gabor stimuli were always presented on congruent sides. The Gabor stimulus preceded the tone by approximately 40 ms to increase the likelihood that they would be perceived simultaneously [56]. Participants were instructed to respond to the Gabor gratings in the same manner as the visual discrimination task. They were informed that the tone would always appear on the same side as the grating. Additional details can be found in the electronic supplementary material.
(iii). Word tasks
In the Semantic task runs, participants classified single, centrally presented nouns as describing either an abstract concept or a concrete object (adapted from [57]). In one run of the task, stimuli consisted of 90 unique words (Semantic—New), whereas in another run only 10 words were used, which were repeated throughout the block (Semantic—Repeat). Response times and accuracies confirmed that classification of new words was more effortful than classification of repeated words.
N-Back tasks comprised the final pair (adapted from [58]). For the 2-Back task, participants were instructed to press one key if the current word matched the word that was presented two words prior, and another key if it did not. For the 0-Back task, one word was designated the ‘target’. Participants were to press one key when the target word appeared, and another key if the current word did not match the target.
In all Word tasks, trials consisted of 1 s word presentation followed by 1 s fixation. Each run contained 90 trials. Lists of abstract and concrete words were drawn from a previously used set [59]. Words were counterbalanced across the four tasks. Text was centrally presented (black on a white background) and participants responded with the index and middle fingers of their left hands. A short practice block preceded each task. Full details can be found in the electronic supplementary material.
(c). MRI data acquisition and preprocessing
Imaging data were acquired on a 3-T Tim Trio scanner (Siemens, Erlangen, Germany) using the vendor-supplied 12-channel phased-array head coil. Functional data consisted of gradient-echo echo-planar images sensitive to blood oxygenation level-dependent contrast [60,61]. Parameters for the functional scans were: repetition time (TR) 3000 ms, echo time (TE) 30 ms, flip angle 85°, 3 × 3 × 3 mm voxels, field of view 216 and 47 axial slices collected with interleaved acquisition. Slices were oriented along the anterior commissure–posterior commissure plane. Functional runs lasted 3.95 min (79 time points). Structural data included a multiecho T1-weighted magnetization-prepared gradient-echo image [62].
Functional connectivity analysis was conducted only on frames obtained during the active task period of each run. As such, the first 15 (corresponding to the fixation period, start cue and first four frames of the task) and last 10 frames (corresponding to the end cue and final fixation period) of each run were discarded. Subsequent processing steps included (i) correcting for slice acquisition-dependent time shifts in each volume with SPM2 (Wellcome Department of Cognitive Neurology, London, UK), (ii) correcting for head motion using rigid body translation and rotation parameters (FSL [63,64]), (iii) removing linear trends over each run and (iv) a low-pass temporal filter to retain frequencies below 0.08 Hz. Spurious variance was removed using linear regression with terms for head motion, whole-brain signal, ventricle signal, white matter signal and their derivatives.
Individual participants' T1 scans were reconstructed into surface representations using FreeSurfer (http://surfer.nmr.mgh.harvard.edu). Functional data were registered to structural images using FreeSurfer's FsFast package ([65]; http://surfer.nmr.mgh.harvard.edu/fswiki/FsFast). The structural preprocessing and structural–functional data alignment steps are detailed in [12]. Functional data were smoothed on the surface using a 6-mm full-width half-maximum kernel and were downsampled to a 4-mm mesh.
(d). Analysis of network configurations
Comparing network organization between tasks is inherently a tricky enterprise because either assumptions about region definition or parcellations need to be made, or global coupling properties must be compared at the level of voxels/vertices, which makes recovering the origins of matrix differences difficult. To circumvent the limitations of each kind of analysis, we took multiple approaches. All approaches converged on the same basic results, bolstering confidence in our conclusions.
(i). Region-based matrix analysis
To explore differences in network properties in relation to commonly described functional networks, we constructed a large set of regions based on the parcellation of resting-state data in Yeo et al. [12]. Using the 17-network parcellation as a reference, we defined 114 regions that surveyed all 17 networks with multiple, separate regions per network. Correlation matrices were constructed that included all region pairs for each of the tasks as well as differences between tasks. Within the matrices, regional correlations were ordered within networks to allow patterns of change and similarity to be easily appreciated (figure 1; similar to [66,67]). Multiple comparisons between tasks were statistically corrected using the network-based statistic method described in Zalesky et al. [68]. Differences between the tasks compared were all significant at p < 0.001 for a range of thresholds. For visualization purposes, the maps in figure 1 were thresholded at t = 3.5 (d.f. = 47, p < 0.001).
Figure 1.

Functional coupling within and between functional networks reveals similarities and differences across task states. Regions of interest obtained from the 17-network parcellation in Yeo et al. [12] were arranged by network membership. Correlation matrices were computed for four passive, continuous tasks collected in 48 subjects. Tasks were perceptually matched across conditions and required no overt responses. Tasks consisted of an external attention task (monitor), a backwards counting task (count), an episodic imagining task (imagine) and a passive fixation task (fixate). (a) Across all tasks, positive correlations predominantly fall along the diagonal, indicating that the arrangement according to network captures much of the structure of the coupling patterns in each task. (b) Examples of direct comparisons between task variants reveal differences in coupling within (along diagonal) and between (off-diagonal) functional networks.
(ii). Cluster-based parcellation
The above analysis is biased because it begins with a set of regions derived from a specific parcellation solution obtained from a unique task state (eyes open rest). As an alternative means to visualize variations and stability in network configurations, we computed network parcellation estimates for each task state directly. In addition to providing another way to visualize alternative network configurations, this analysis approach also provides practical information about how sensitive network parcellations are to the acquisition state.
Clustering of functional data was performed for each task separately following the procedure in Yeo et al. [12]. For each subject, the Pearson's product moment correlation was computed between each surface vertex (N = 18 715) and 1175 regions of interest spread evenly over the cortical surface. The regions consisted of single vertices spaced approximately 16 mm apart. The ‘connectivity profile’ of each surface vertex is its functional coupling to these regions. Each participant's 18 715 × 1175 matrix of correlations was binarized to retain the top 10% of correlations before averaging for the group estimates. The connectivity profiles were clustered using a mixture of von Mises–Fisher distributions [12,69]. For details see Yeo et al. [12].
Parcellation of cerebellar volumetric data was performed as in Buckner et al. [70]. For each task, each voxel in the cerebellum was assigned to its ‘best-fit’ cerebral cortical network based on that voxel's correlation matrix to the cerebral cortical surface.
Using these approaches, the number of clusters must be specified a priori. Because Yeo et al. [12] found solutions with 7- and 17-network clusters to be particularly stable, and in order to compare task parcellations to these previous resting-state parcellations, we adopted 7- and 17-network clustering for this study. This practical choice should not be taken to imply that these network solutions are more meaningful than alternatives. The 7-network cerebral cortical parcellations were used to assess the stability of network border locations across tasks (figure 2). Representative 7-network task parcellations are also displayed in figure 9. The 17-network parcellations were used to quantify the relationship between cerebral and cerebellar network representation (figure 9) as well as to illustrate how lateralized asymmetries in the parcellations arise in certain task contexts (electronic supplementary material, figure S4).
Figure 2.
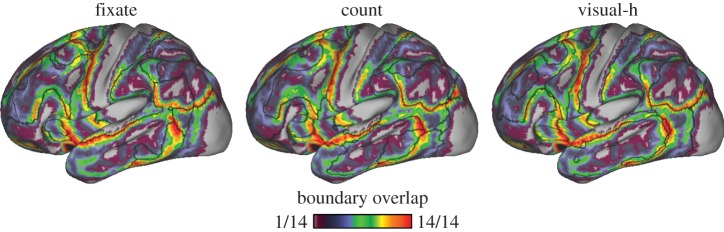
Network transitions vary across functional states. 7-Network clustering parcellations were computed separately for all 14 tasks (N = 48). Heatmap indicates number of tasks (out of 14) for which a transition between networks falls at a given location on the lateral left hemisphere. Black lines indicate the location of network boundaries for the three particular tasks shown. Some border locations are highly consistent across tasks—e.g. transitions occurring near pre-central cortex and between inferior parietal and occipital regions. Other locations consistently do not contain network transitions, for instance in parts of medial prefrontal, somatomotor and occipital cortex. Certain regions in prefrontal, temporal and parietal cortex exhibit considerable variability of network topography across tasks. The agreement between any given task and the other 13 tasks' network boundary locations was similar across all tasks (mean overlap was 64–67%). The passive fixation task (fixate) agreement to the other tasks was not exceptional in this respect (mean overlap = 66%). h, hard.
Figure 9.

Cerebro-cerebellar network organization is conserved across task states. A roughly homotopic relationship exists between the proportion of the cerebral cortex and the cerebellum assigned to each network. The top row re-plots data from [70], demonstrating this relationship for eyes open rest data acquired from N = 1000 participants. A similar correlation persists in all 14 tasks measured in this study, though the details of the network configurations change in each case. (Bottom rows) Representative examples of homotopic scaling across Passive, Word and Sensory task variants. Left column shows the lateral views of the 7-network cerebral cortical parcellation for each task. Middle column shows a representative coronal slice of the corresponding cerebellar parcellation. Right column plots percentage of cerebellum (volume) against percentage of cerebrum (surface area). Points in scatter plot represent each of the 17 networks, following [70]. Black asterisks indicate networks that formed splits between homotopic regions in both the cerebral and cerebellar cortices for particular tasks.
(iii). Global coupling profile correspondence
As another strategy to explore functional coupling differences, the global correlation profile of each task was compared with the remaining 13 to assess agreement across tasks. This was achieved in two ways: (i) calculating the global correlation between each possible pair of tasks (figure 3) and (ii) calculating the agreement between whole-cortex correlations in each task to the mean correlation profile computed from the other tasks (figure 4). Each comparison was performed on the full, 18 715 × 18 715 correlation matrix representing the complete connectivity profile of the cortical surface. We ranked the tasks in terms of their agreement to the other tasks (figure 4; electronic supplementary material, figure S1).
Figure 3.
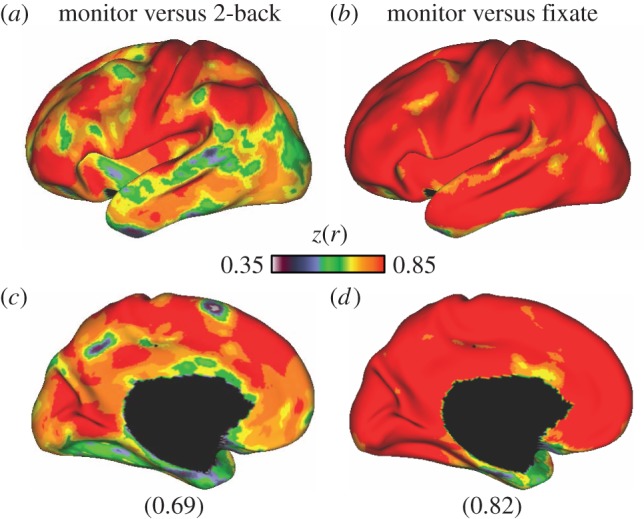
Global coupling profiles are substantially similar across tasks. Across all possible pairs of tasks (91 pairs), the lowest and highest mean correlation of whole-cortex global connectivity profiles ranged between 0.69 and 0.82. (a,c) The global connectivity correspondence between the monitor and 2-back (hard) tasks, the task pair with the lowest global coupling correspondence (0.69). (b,d) The agreement between the monitor and fixate tasks, the pair with the highest (0.82) agreement. Lateral surface views of the left hemisphere are shown on (a,b) and medial views are at (c,d). A large proportion of the correlation structure is shared, even across these distinct task states.
Figure 4.

Global fcMRI coupling structure is shared across task variants. A substantial portion of the coupling structure in each task is common across all tasks. (a) Correlation of whole-cortex correlation profiles computed between each task and the average of the remaining 13 tasks. The lowest and highest mean correspondence belonged to the 2-back (mean = 0.60) and 0-back (mean = 0.71) tasks, respectively. (b) Correlation between the global connectivity profiles of the four passive tasks to the remainder of the 13 tasks. Within the four passive tasks, average correlations ranged between 0.63 and 0.70.
(iv). Seed-based maps
Finally, seed-based maps were constructed to identify specific regions that exhibited changes in whole-cortex connectivity as a function of task (figures 5–7 and the electronic supplementary material, figure S2). We identified regions on the cortical surface that had varied correspondence between a given task and the average of the remaining tasks (see figures 3 and 4). Using these regions as seeds, we plotted the whole-brain correlation maps from individual tasks. Each seed was a single surface vertex (approx. 4 × 4 mm). For these maps, the vertex-level correlation pattern from each task was displayed on the cortical surface for each seed region.
Figure 5.

Variation in coupling to lateral temporal cortex. (Centre) Connectivity for a seed region (black circle) in right lateral temporal cortex, computed from a correlation matrix obtained from averaging the matrices of all 14 tasks. (Perimeter) Correlation maps for the same seed region in each of the 14 tasks are arranged clockwise from top in order of best to worst agreement to the centre map. Only positive correlations are shown. Numbers indicate z(r) between correlation maps. aud/vis, audio/visual; e, easy; h, hard; n, new; r, repeat.
Figure 6.

Variation in coupling to intraparietal sulcus. Formatting as in figure 5. Note the change in the ranking of best-to-worst agreement with the average correlation map relative to figure 5. In this case, the visual discrimination tasks show the best agreement to the task-averaged solution.
Figure 7.

Variation in coupling to dorsolateral prefrontal cortex. Formatting as in figure 5. A seed region in dorsolateral prefrontal cortex is correlated with a large swath of lateral prefrontal cortex as well as portions of the inferior parietal lobule and intraparietal sulcus, consistent with the fronto-parietal control network [12]. In this case, the auditory–hard task has highest agreement to the average, whereas the fixate task has the lowest.
(e). Comparison between functional connectivity MRI and task coactivation
An intriguing finding in the literature is that intrinsic functional connectivity networks measured at rest correspond to task-based coactivation patterns ([71–73], but see [30]). An interesting question is whether rest has a privileged position such that functional coupling measured during passive fixation or during rest is the best way to ascertain stable underlying functional network configurations. One possibility is that the network repertoire measured during passive fixation is a better predictor of diverse coactivation states because it is absent contamination of a particular configuration elicited by active task demands. An alternative possibility is that every task state, including passive visual fixation or rest, is an arbitrary state with its own idiosyncratic demands and thus not inherently more appropriate for coupling analysis than other task states.
To investigate whether passive fixation and active task states equally predict task coactivation data, we used a previously published dataset (N = 16 [24,74]) consisting of two runs each of passive fixation and of the same abstract/concrete word classification task described above. We calculated the correlation between the whole-cortex coupling patterns in these data and the whole-cortex coactivation patterns available from the NeuroSynth database (figure 8). Briefly, NeuroSynth [75] (http://neurosynth.org/) permits automated extraction of coordinates from a large set of published functional MRI (fMRI) articles. These can be interrogated for term-based or coactivation-based meta-analyses.
Figure 8.
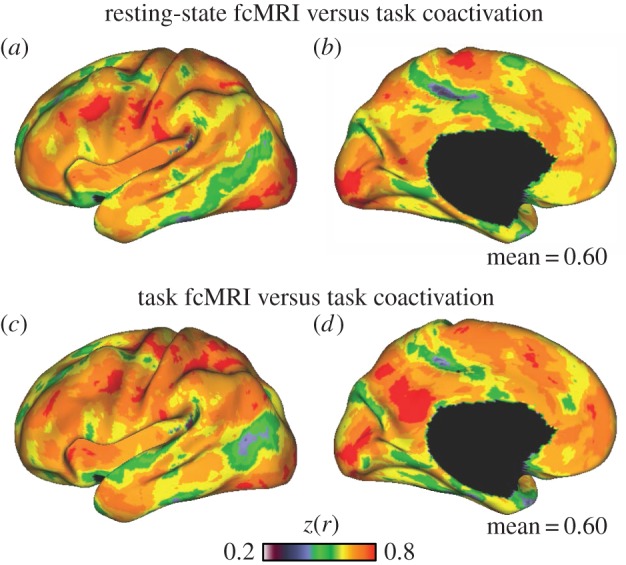
Functional coupling in active and passive states similarly predicts task coactivation. (a,b) Replicating previous work [71], passive state correlation patterns across the cerebral cortex predict co-activation patterns from large-scale meta-analytic databases such as Neurosynth (mean r = 0.60). The passive (resting-state) task was passive visual fixation. (c,d) fcMRI correlation matrices obtained from active semantic classification task data predict meta-analytic co-activation patterns to a similar degree (mean r = 0.60). Only left hemisphere is shown.
(f). Visualization
Parcellation and seed-based correlation maps were transformed from FreeSurfer surface space to the inflated PALS cortical surface using Caret software [76,77].
3. Results
(a). Functional coupling is modified by task state
A central finding that will emerge in multiple ways throughout the results is that different task states modify functional coupling patterns while at the same time they show strong central tendencies. To illustrate this point, figure 1 displays the functional coupling matrices for the four Passive task states (imagine, count, monitor and fixate). Like the earlier work of Shirer et al. [27], these task states present a particularly interesting contrast because the stimulation (a visual crosshair) and response demands are held constant. What does differ across the tasks is the participant expectations and, presumably, internal cognitive states.
The first observation is that the coupling matrix between the 114 regions is highly similar across the four tasks (figure 1a). However, significant differences emerge when the direct contrasts between the task states are analysed (figure 1b). These differences include coupling changes that are within-network (effects along the diagonal of the matrix) as well as differences between networks (effects away from the matrix diagonal).
As another means to quantify similarity and differences, network parcellations were estimated as a proxy for network stability. The 7-network clustering solution for each task was estimated and the boundaries of derived networks extracted. Figure 2 depicts network boundary locations as a count reflecting the number of tasks that had a boundary in common at each location. The agreement between any given task and the other 13 tasks' network boundary locations was similar across all tasks (mean overlap was 64–67%). The passive fixation task (fixate) agreement to the other tasks was not exceptional in this respect (mean overlap = 66%).
Global coupling profile correspondence was next compared between all possible task pairs (91 pairs) across the full cerebral cortex. Mean global correlations between task coupling patterns were statistically significant (t90 = 210.28, p < 0.001) and ranged between 0.69 and 0.82 across all possible pairs. Grubbs' test did not detect any outliers at an alpha of 0.05, suggesting that no task pairs were exceptional; rather, the range of correlations followed an approximately normal distribution. The correspondence between the monitor and 2-back tasks was the poorest, whereas the agreement between the monitor and fixate tasks was the highest. These two extremes are illustrated in figure 3.
When comparing each task with the average correlation profiles of the remaining 13 tasks, the 2-back task was also found to be least similar to the average of the others (mean correlation = 0.60). The 0-back task was most similar to the average of the other tasks (mean correlation = 0.71). The difference in correspondence between the 2-back and 0-back conditions to each of the other tasks was significant (t11 = 7.79, p < 0.001). The left hemisphere correspondence maps of global coupling patterns between each task and the remaining 13 are shown in figure 4 and the electronic supplementary material, figure S1.
(b). Coupling differences vary around a central tendency
While the central tendency in coupling patterns across tasks is apparent from the above results, it is also clear that different states produce different configurations. We plotted the seed-based correlation maps from individual tasks (figures 5–7 and the electronic supplementary material, figure S2) to the average across tasks, using seed regions that had variable degrees of correspondence. These examples illustrate the extent of variation that occurs in the coupling patterns of individual tasks relative to the average.
For example, a seed region in right lateral temporal cortex was correlated with anterior inferior prefrontal cortex, the inferior parietal lobule and caudal dorsal prefrontal cortex in the task-averaged matrix (figure 5). This region's coupling profile exhibited relatively little variation across tasks, with individual task correspondence ranging between 0.72 and 0.83 to the task-averaged map. The intraparietal sulcus region depicted in figure 6 had greater variation in the extent to which individual tasks agreed with the averaged global profiles, with agreement ranging between 0.57 and 0.87. Figure 7 shows variation around coupling patterns associated with a dorsolateral prefrontal seed region. In this region, the auditory–hard task had the highest agreement to the task-averaged result, whereas the fixate condition had the lowest. Note that the ranking of worst-to-best agreement between each of the tasks and the remaining tasks differs across the three examples in figures 5–7.
The electronic supplementary material, figure S2, shows three additional examples. Each case was selected to emphasize particular features of variation. Figure S2a in the electronic supplementary material depicts an example in which different tasks emphasize different components relative to the task-averaged correlation map. A seed region in left posterior prefrontal cortex couples to an extended region in lateral parietal cortex in the external attention task (monitor), but favours higher correlations to extended portions of lateral prefrontal cortex in the semantic–new task. In figure S2b of the electronic supplementary material, a seed region in right temporo-parietal junction differentially couples to the anterior insula, prefrontal cortex and inferior parietal sulcus across two passive task variants (count and monitor). Finally, a striking example of attenuation relative to the average is shown in figure S2c of the electronic supplementary material. The task-averaged correlation map for a region placed in left anterior insular cortex contains regions in caudal and lateral prefrontal cortex as well as the temporo-parietal junction and inferior parietal sulcus. Correlations to these regions were robust in the audio/visual tasks but attenuated in the count task.
Stimulus-driven coactivation probably affects the coupling patterns we observed across tasks. However, as is shown in the electronic supplementary material, figure S3, coincident stimulation does not necessarily lead to merging of networks. While the 2-back and fixate tasks have substantially different evoked response patterns, seed-regions placed in task-evoked regions had broadly similar coupling profiles across the two tasks (electronic supplementary material, figure S3). These findings emphasize that, while coupling patterns are modified by task context, there is a broadly similar, robust underlying scaffolding that is converged upon by these quite different task states (see also [37]).
Finally, the mean correspondence of a task to the other tasks in its set (i.e. 0-back to the other Word tasks) was significantly higher than the mean correspondence to tasks outside of its set (i.e. 0-back to Passive or Sensory tasks) (t13 = 9.02, p < 0.001). From a practical perspective, this implies that no single task is likely to exist that can maximally capture the range of possible coupling configurations.
(c). Central tendencies across states underlie the relationship between coupling and task coactivation
Smith et al. [71] demonstrated significant correspondence between regions that covary during rest (resting-state networks) and activation locations that covary in a large database of task-based fMRI studies (BrainMap—www.brainmap.org). This observation suggests that resting-state networks recapitulate functionally meaningful brain organization. But is rest better than other task states for revealing these meaningful aspects of organization? To address this question, we first replicated the basic Smith et al. [71] result. The whole-cortex fcMRI global coupling profile measured during passive rest was correlated with the coactivation patterns derived from the NeuroSynth database [75] (http://neurosynth.org/).
The mean correlation between the passive rest task data and functional co-activation measured across the cerebral cortex was 0.60 (figure 8a,b). We next repeated the same procedure using continuous semantic task data instead of passive fixation data (figure 8c,d). fcMRI patterns derived from this active semantic classification task were equally good at predicting the Neurosynth results (mean = 0.60). Thus, while we replicate the observation that coupling patterns measured at rest predict much of the coactivation variance found in task-based paradigms, we do not find that passive rest is any better at predicting coactivation than another arbitrary, active task.
(d). Network organization is broadly preserved across tasks with some notable differences
Given passive rest does not predict task coactivation better than coupling during an arbitrary, active task, one is left wondering to what degree the field would be emphasizing different features of network organization had functional coupling been routinely analysed during a different task. Therefore, a practical question to ask is whether network estimates change substantially as a function of acquisition task state. Two separate analyses were performed to provide insight into this question. The first analysis focused on the cerebral cortex and the second on the cerebellum.
(i). Cerebral cortex
Previously, we employed mixture modelling to parcellate the cerebral cortex into networks using resting-state data [12] and have recently shown that such networks generalize to alternative estimation approaches [78]. Here, we estimated cluster-based parcellation on data from the 14 tasks independently to determine whether differences in coupling patterns would change network estimation in meaningful ways (examples are illustrated in figure 9).
Many features of network organization are stable. The cerebral cortical parcellations all show a similar dissociation between sensory and motor networks on the one hand and association networks on the other. Specifically, sensory and sensorimotor networks tended to cluster in predominantly local components, whereas association networks form distributed networks that spanned multiple lobes [12,78]. This was evident in the 7-network (figure 9) as well as the 17-network parcellation (electronic supplementary material, figure S4) across all tasks.
Beyond this general consensus, the parcellations of the cerebral cortex differed across tasks in certain respects. The electronic supplementary material, figure S4, shows that in the audio/visual task (as well as the visual tasks), the 17-network clustering solution split left and right hemisphere visual cortex into separate networks. However, these visual regions were not grouped into a common network with the somatomotor regions and did not have a network component in the cerebellum (see below). Visual networks also remained distinct from auditory networks in the audio/visual tasks, despite the concurrent presentation of auditory and visual stimuli in those conditions. These observations suggest that, though stimulus-driven coactivation is expected to influence coupling profiles, it does not necessarily obligate a merging of networks that contain regions engaged by the task.
(ii). Cerebellum
Though the details of network topography differed across tasks in the cerebrum and cerebellum, the orderly arrangement and dual representation of networks in the anterior and posterior cerebellar cortex (previously identified in resting-state data [70]) could be detected in all tasks. That is, although some significant details differ, the same basic topography of the cerebellum's mapping to the cerebral cortex reveals itself regardless of the acquisition state initiating the parcellation including (i) the observation that the cerebellum mostly maps to cerebral association networks, (ii) the presence of a primary and secondary representation for all networks and (iii) the observation that the secondary cerebellar map is a mirror reversal of the primary map.
In general, differences in the cerebral networks across tasks were also reflected in differences in the cerebellar network configurations. For example, the audio/visual discrimination tasks produced lateralized parcellations of the motor domains of the anterior and posterior cerebellum, mirroring the same networks in contralateral somatomotor cortices of the cerebrum (figure 9 and the electronic supplementary material, figure S4). Asymmetry of non-motor networks was observed in the posterior cerebellum in the semantic task (figure 9). This asymmetry is mirrored in the parcellation of contralateral cerebral cortical networks for this task (see also [79]). These examples suggest that clustering task data reveal insights into functional reorganization.
Finally, in Buckner et al. [70], we reported that the percentage of the cerebellum assigned to a given network was predicted by the percentage of the cerebrum dedicated to that same network. We explored this association in each task by plotting the percentage of vertices in the cerebral cortex assigned to a given network as a function of the percentage of voxels in the cerebellum belonging to that network. The roughly homotopic relationship first observed with resting-state data [70] held across all 14 tasks in this study (scatter plots in figure 9), again emphasizing that the broad organizational properties of the cerebellum are robust to the arbitrary acquisition state initiating the parcellation.
4. Discussion
Consistent with a broad range of ideas and empirical observations [36,43–52], our analyses of functional network configurations are consistent with the possibility that cortical regions or neuronal subpopulations reconfigure their coupling in response to task demands. A common theme that emerges is that functional interactions (which are constrained by anatomical connections but not fully determined by them) are critically relevant when characterizing a network's functional properties [80]. From this perspective, studying coupling patterns in a single state alone (such as during passive fixation) is insufficient to distinguish the stable network properties from task-varying contributions.
Our findings revealed that coupling configurations estimated from a wide range of task paradigms contain common features. However, beyond these shared components, even variants of passive task paradigms are sufficient to induce significant changes to coupling patterns within and across networks. Surveying across 14 tasks and a range of paradigm domains enabled us to identify those properties that are robust across different behavioural contexts, as well as to identify zones and features that show variability across states.
(a). A central tendency of coupling patterns across behavioural states
While dynamical reconfigurations adjust details, certain broad properties of functional connectivity networks generalize across many contexts and analysis strategies [1–13]. For instance, regions at and near primary sensory and motor cortices tend to show local functional coupling. By contrast, association regions tend to couple in large distributed networks with a prefrontal, parietal association, frontal midline and temporal component. While the details of their exact topography changes with different task acquisitions, this general pattern is observed across the range of tasks in our sample (figures 1, 5–7 and 9).
A relevant question is how much of the global coupling configurations are common across behavioural states? Within the cerebral cortex, global coupling profiles compared between all possible pairs of tasks in our sample ranged from 0.69 to 0.82. On the one hand, changing the composition of the task battery would undoubtedly alter these ranges as well as which tasks become the worst- and best-agreeing tasks. Had our task battery consisted of 13 auditory tasks and one 0-back task, we would not expect the 0-back task to emerge with the highest agreement to the other tasks, as is presently the case (figure 4). On the other hand, that the lowest mean correlation was as much as 0.69 between quite varied task paradigms suggests that the common tendencies across states account for a considerable portion of the observed coupling patterns.
Shared features of the coupling patterns across behavioural states may reflect constraints from anatomical connectivity. The preserved, orderly topography of cerebro-cerebellar coupling is consistent with this possibility (figure 9). As can be appreciated from the coronal sections in figure 9, the anterior and posterior portions of the cerebellum consistently contain an orderly arrangement of cerebral cortical networks. Across all tasks, networks contained anterior and posterior cerebellar components that mirrored one another in a topography that is consistent with our previous investigation of cerebellar resting-state networks (top panel in figure 9; see also [70]). This indicates that multiple cerebral networks couple to the cerebellum in an orderly manner that is resilient to the particular task used at acquisition.
It is possible that collecting the tasks in a single session could have contributed to the observed stability of the present results. If so, the reported range of correspondence between tasks would be an overestimate. However, previous studies have indicated that test–retest reliability of resting-state functional connectivity remains quite high even when scans are acquired months apart (e.g. [8]). Resting-state networks also tend to agree across participants and scan sites. For example, the global correspondence between the passive fixation condition in this study and the full correlation matrix from an independent sample of 1000 subjects reported in Yeo et al. [12] was 0.91. Finally, the variation between tasks was strongly predicted by how similar the tasks are to each other.
However, functional coupling stability is heterogeneous across the cerebral cortex in test–retest measures [8] as well as between individuals [81]. Thus an important avenue to explore in future work will be to determine whether similar patterns of heterogeneity can be observed in other behavioural states both within and across subjects.
(b). Reconfigurable functional coupling
Engel et al. [52], in a comprehensive review on the neurophysiology of intrinsic coupling patterns, conclude that while certain features of intrinsic coupling modes may be anchored by structural connectivity, these may best be viewed as priors or ‘dispositions’ that constrain possible network states in different behavioural contexts (see also [82]). Our results are consistent with this framework, showing that fcMRI coupling patterns across tasks vary around a central tendency. Differences manifest as modifications among a core configuration that was common across states.
The global profile comparisons (figures 3 and 4) and seed-based correlation maps (figures 5–7) provide a sense of the variability. There is heterogeneity across the cortex; for instance, portions of the inferior parietal lobule, somatomotor cortex, posterior insular cortex and lateral temporal cortex were in relatively close agreement across all tasks. By contrast, prefontal cortex, portions of the superior parietal lobule and temporal and anterior insular cortices appear to possess an especially high concentration of zones whose coupling patterns varied as a function of task.
We observed that the mean correspondence of a task's coupling profile to the other tasks in its set (i.e. 0-back to the other Word tasks) was significantly higher than the mean correspondence to tasks outside of its set (i.e. 0-back to Passive or Sensory tasks). From a practical perspective, this indicates that no one task is likely to become the gold standard to which all other states maximally agree.
Reconfiguration as a function of task could either be facilitated by the intrinsic dynamics of brain circuits, or, more mundanely, apparent changes could be illusory if regions are jointly driven by synchronous sets of inputs or task demands. Stimulus-driven coactivation is thus expected to at least partly influence the coupling patterns we observed across tasks. However, as is shown in the electronic supplementary material, figures S3 and S4, synchronous input does not necessarily obligate regions to couple together into a common network. For example, coincident auditory and visual input did not induce auditory and visual networks to cluster together. This reinforces the notion that, while dynamical reconfigurations are expected, they are also likely to respect underlying anatomical constraints. In this respect, equally informative to the observed task-varying changes is the absence of change, which may reflect core constraints to reconfiguration.
Finally, we observed consistently high coupling variability in certain regions such as the anterior temporal lobes and orbital frontal cortices. This may be due to low SNR or susceptibility. Additionally, regions exhibiting some of the highest variability appeared to follow major morphological features, such as a band of high variability along the cingulate sulcus (figure 4). Regions along the superior temporal gyrus and inferior to the inferior parietal lobule also had low agreement across tasks. Visual inspection of seed-based correlation maps revealed that these regions, like the low SNR regions, displayed predominantly local, relatively noisy correlation maps. Reconfigurations in these regions' coupling patterns primarily concerned the extent of local correlations. We do not interpret these regions further.
(c). Implications for interpreting the relationship between coupling and coactivation
Correspondence has been observed between network topography obtained from resting-state functional connectivity and task-induced activations measured across a range of cognitive domains ([71–73], but see [30]). However, a basic question is whether the resting-state provides a privileged view of intrinsic connectivity?
Our results indicate that functional coupling in a continuous semantic task is equally good at predicting meta-analytic coactivation as is resting-state functional coupling (figure 8). In some sense, this is not surprising. The correlation between rest-based fcMRI and task-based fcMRI in these data was 0.75, indicating substantial shared variance in connectivity profiles between the two states. But it does shift emphasis from the resting-state being a ‘privileged state’ for revealing functional networks, towards it being only one of many behavioural states that each reveal a consistent central tendency as well as idiosyncratic aspects of coupling [67]. The 14 tasks we collected are clearly not exhaustive of the space of possible behavioural activities, nor are they uniformly sampled across the three broad domains we chose (passive, word-based and sensory tasks). However, given the prevalent use of unconstrained rest states for functional connectivity analysis, it is informative that the passive fixation condition was no more representative of the other tasks' connectivity patterns than the other paradigms measured in this study (figures 2–7).
These observations suggest that task responses should not be thought of as activating network subsets or core building blocks that are selectively identified by analysis of rest-state functional coupling. Rather, the results are consistent with the possibility that functional coupling across multiple task states—including passive states and during active tasks—varies around a core that may reflect stable features of brain architecture. The possibility of a core functional architecture may explain why analyses focusing on stable features of functional coupling make observations paralleling known anatomic connectivity, while analyses focusing on transient configurations detect state-dependent modes that are influenced by recent experience and momentary task states.
Supplementary Material
Acknowledgements
The authors thank Tal Yarkoni for use of the NeuroSynth database, Brian Wei Yang, Michelle Zad and Susanna Crowell for assistance with data collection and analysis, Matt Hutchison for comments, and the Harvard's Center for Brain Science Neuroimaging Core (Tammy Moran, Stephanie McMains and Ross Mair). Resting-state data were obtained from the Brain Genomics Superstruct Project.
Funding statement
F.M.K. was supported by the Ashford Graduate Fellowship Fund. Research was supported by the Simons Foundation, the Athinoula A. Martinos Center for Biomedical Imaging (P41EB015896, S10RR021110, S10RR023401 and S10RR019307) and the National University of Singapore Tier 1 grant.
References
- 1.Beckmann CF, DeLuca M, Devlin JT, Smith SM. 2005. Investigations into resting-state connectivity using independent component analysis. Phil. Trans. R. Soc. Lond. B 360, 1001–1013. ( 10.1098/rstb.2005.1634) [DOI] [PMC free article] [PubMed] [Google Scholar]
- 2.Damoiseaux JS, Rombouts SARB, Barkhof F, Scheltens P, Stam CJ, Smith SM, Beckmann CF. 2006. Consistent resting-state networks across healthy subjects. Proc. Natl Acad. Sci. USA 103, 13 848–13 853. ( 10.1073/pnas.0601.4171.03) [DOI] [PMC free article] [PubMed] [Google Scholar]
- 3.De Luca M, Beckmann CF, De Stefano N, Matthews PM, Smith SM. 2006. fMRI resting state networks define distinct modes of long-distance interactions in the human brain. NeuroImage 29, 1359–1367. ( 10.1016/j.neuroimage.2005.08.035) [DOI] [PubMed] [Google Scholar]
- 4.Fox M, Corbetta M, Snyder A, Vincent JL, Raichle ME. 2006. Spontaneous neuronal activity distinguishes human dorsal and ventral attention systems. Proc. Natl Acad. Sci. USA 103, 10 046–10 051. ( 10.1073/pnas.0604187103) [DOI] [PMC free article] [PubMed] [Google Scholar]
- 5.Seeley WW, Menon V, Schatzberg AF, Keller J, Glover GH, Kenna H, Reiss AL, Greicius MD. 2007. Dissociable intrinsic connectivity networks for salience processing and executive control. J. Neurosci. 27, 2349–2356. ( 10.1523/JNEUROSCI.5587-06.2007) [DOI] [PMC free article] [PubMed] [Google Scholar]
- 6.He Y, et al. 2009. Uncovering intrinsic modular organization of spontaneous brain activity in humans. PLoS ONE 4, e5226 ( 10.1371/journal.pone.0005226) [DOI] [PMC free article] [PubMed] [Google Scholar]
- 7.Meunier D, Lambiotte R, Fornito A, Ersche KD, Bullmore ET. 2009. Hierarchical modularity in human brain functional networks. Front. Neuroinform. 3, 37 ( 10.3389/neuro.11.037.2009) [DOI] [PMC free article] [PubMed] [Google Scholar]
- 8.Shehzad Z, et al. 2009. The resting brain: unconstrained yet reliable. Cereb. Cortex 19, 2209–2229. ( 10.1093/cercor/bhn256) [DOI] [PMC free article] [PubMed] [Google Scholar]
- 9.Zuo X-N, Kelly C, Adelstein JS, Klein DF, Castellanos FX, Milham MP. 2010. Reliable intrinsic connectivity networks: test–retest evaluation using ICA and dual regression approach. NeuroImage 49, 2163–2177. ( 10.1016/j.neuroimage.2009.10.080) [DOI] [PMC free article] [PubMed] [Google Scholar]
- 10.Power JD, et al. 2011. Functional network organization of the human brain. Neuron 72, 665–678. ( 10.1016/j.neuron.2011.09.006) [DOI] [PMC free article] [PubMed] [Google Scholar]
- 11.Tomasi D, Volkow ND. 2011. Association between functional connectivity hubs and brain networks. Cereb. Cortex 21, 2003–2013. ( 10.1093/cercor/bhq268) [DOI] [PMC free article] [PubMed] [Google Scholar]
- 12.Yeo BTT, et al. 2011. The organization of the human cerebral cortex estimated by intrinsic functional connectivity. J. Neurophysiol. 106, 1125–1165. ( 10.1152/jn.00338.2011) [DOI] [PMC free article] [PubMed] [Google Scholar]
- 13.Smith SM, et al. 2013. Functional connectomics from resting-state fMRI. Trends Cogn. Sci. 17, 666–682. ( 10.1016/j.tics.2013.09.016) [DOI] [PMC free article] [PubMed] [Google Scholar]
- 14.McIntosh AR, Rajah MN, Lobaugh NJ. 2003. Functional connectivity of the medial temporal lobe relates to learning and awareness. J. Neurosci. 23, 6520–6528. [DOI] [PMC free article] [PubMed] [Google Scholar]
- 15.Hampson M, Olson IR, Leung H-C, Skudlarski P, Gore JC. 2004. Changes in functional connectivity of human MT/V5 with visual motion input. Neuroreport 15, 1315–1319. ( 10.1097/01.wnr.0000129997.95055.15) [DOI] [PubMed] [Google Scholar]
- 16.Rissman J, Gazzaley A, D'Esposito M. 2004. Measuring functional connectivity during distinct stages of a cognitive task. NeuroImage 23, 752–763. ( 10.1016/j.neuroimage.2004.06.035) [DOI] [PubMed] [Google Scholar]
- 17.Hampson M, Driesen NR, Skudlarski P, Gore JC, Constable RT. 2006. Brain connectivity related to working memory performance. J. Neurosci. 26, 13 338–13 343. ( 10.1523/JNEUROSCI.3408-06.2006) [DOI] [PMC free article] [PubMed] [Google Scholar]
- 18.Summerfield C, Greene M, Wager T, Egner T, Hirsch J, Mangels J. 2006. Neocortical connectivity during episodic memory formation. PLoS Biol. 4, e128 ( 10.1371/journal.pbio.0040128) [DOI] [PMC free article] [PubMed] [Google Scholar]
- 19.Albert NB, Robertson EM, Miall RC. 2009. The resting human brain and motor learning. Curr. Biol. 19, 1023–1027. ( 10.1016/j.cub.2009.04.028) [DOI] [PMC free article] [PubMed] [Google Scholar]
- 20.Lewis CM, Baldassarre A, Committeri G, Romani GL, Corbetta M. 2009. Learning sculpts the spontaneous activity of the resting human brain. Proc. Natl Acad. Sci. USA 106, 17 558–17 563. ( 10.1073/pnas.0902455106) [DOI] [PMC free article] [PubMed] [Google Scholar]
- 21.Hasson U, Nusbaum HC, Small SL. 2009. Task-dependent organization of brain regions active during rest. Proc. Natl Acad. Sci. USA 106, 10 841–10 846. ( 10.1073/pnas.0903253106) [DOI] [PMC free article] [PubMed] [Google Scholar]
- 22.Pyka M, Beckmann CF, Schöning S, Hauke S, Heider D, Kugel H, Arolt V, Konrad C. 2009. Impact of working memory load on fMRI resting state pattern in subsequent resting phases. PLoS ONE 4, e7198 ( 10.1371/journal.pone.0007198) [DOI] [PMC free article] [PubMed] [Google Scholar]
- 23.Richiardi J, Eryilmaz H, Schwartz S, Vuilleumier P, Van De Ville D. 2011. Decoding brain states from fMRI connectivity graphs. NeuroImage 56, 616–626. ( 10.1016/j.neuroimage.2010.05.081) [DOI] [PubMed] [Google Scholar]
- 24.Sepulcre J, Liu H, Talukdar T, Martincorena I, Yeo BTT, Buckner RL. 2010. The organization of local and distant functional connectivity in the human brain. PLoS Comput. Biol. 6, e1000808 ( 10.1371/journal.pcbi.1000808) [DOI] [PMC free article] [PubMed] [Google Scholar]
- 25.Stevens WD, Buckner RL, Schacter DL. 2010. Correlated low-frequency BOLD fluctuations in the resting human brain are modulated by recent experience in category-preferential visual regions. Cereb. Cortex 20, 1997–2006. ( 10.1093/cercor/bhp270) [DOI] [PMC free article] [PubMed] [Google Scholar]
- 26.Tambini A, Ketz N, Davachi L. 2010. Enhanced brain correlations during rest are related to memory for recent experiences. Neuron 65, 280–290. ( 10.1016/j.neuron.2010.01.001) [DOI] [PMC free article] [PubMed] [Google Scholar]
- 27.Shirer WR, Ryali S, Rykhlevskaia E, Menon V, Greicius MD. 2011. Decoding subject-driven cognitive states with whole-brain connectivity patterns. Cereb. Cortex 22, 158–165. ( 10.1093/cercor/bhr099) [DOI] [PMC free article] [PubMed] [Google Scholar]
- 28.Vahdat S, Darainy M, Milner TE, Ostry DJ. 2011. Functionally specific changes in resting-state sensorimotor networks after motor learning. J. Neurosci. 31, 16 907–16 915. ( 10.1523/JNEUROSCI.2737-11.2011) [DOI] [PMC free article] [PubMed] [Google Scholar]
- 29.Fornito A, Harrison BJ, Zalesky A, Simons JS. 2012. Competitive and cooperative dynamics of large-scale brain functional networks supporting recollection. Proc. Natl Acad. Sci. USA 109, 12 788–12 793. ( 10.1073/pnas.1204185109) [DOI] [PMC free article] [PubMed] [Google Scholar]
- 30.Mennes M, Kelly C, Colcombe S, Castellanos FX, Milham MP. 2012. The extrinsic and intrinsic functional architectures of the human brain are not equivalent. Cereb. Cortex. 23, 223–229. ( 10.1093/cercor/bhs010) [DOI] [PMC free article] [PubMed] [Google Scholar]
- 31.Norman-Haignere SV, McCarthy G, Chun MM, Turk-Browne NB. 2012. Category-selective background connectivity in ventral visual cortex. Cereb. Cortex. 22, 391–402. ( 10.1093/cercor/bhr118) [DOI] [PMC free article] [PubMed] [Google Scholar]
- 32.Elton A, Gao W. 2013. Divergent task-dependent functional connectivity of executive control and salience networks. Cortex 52, 56–66. ( 10.1016/j.cortex.2013.10.012) [DOI] [PubMed] [Google Scholar]
- 33.Gao W, Gilmore JH, Alcauter S, Lin W. 2013. The dynamic reorganization of the default-mode network during a visual classification task. Front. Syst. Neurosci. 7, 34 ( 10.3389/fnsys.2013.00034) [DOI] [PMC free article] [PubMed] [Google Scholar]
- 34.Gießing C, Thiel CM, Alexander-Bloch AF, Patel AX, Bullmore ET. 2013. Human brain functional network changes associated with enhanced and impaired attentional task performance. J. Neurosci. 33, 5903–5914. ( 10.1523/JNEUROSCI.4854-12.2013) [DOI] [PMC free article] [PubMed] [Google Scholar]
- 35.Tambini A, Davachi L. 2013. Persistence of hippocampal multivoxel patterns into postencoding rest is related to memory. Proc. Natl Acad. Sci. USA 110, 19 591–19 596. ( 10.1073/pnas.1308499110) [DOI] [PMC free article] [PubMed] [Google Scholar]
- 36.Cole MW, Reynolds JR, Power JD, Repovs G, Anticevic A, Braver TS. 2013. Multi-task connectivity reveals flexible hubs for adaptive task control. Nat. Neurosci. 16, 1348–1355. ( 10.1038/nn.3470) [DOI] [PMC free article] [PubMed] [Google Scholar]
- 37.Cole MW, Bassett DS, Power JD, Petersen SE. 2013. Multi-state task functional connectivity reveals the human brain's dynamic network architecture and stable functional backbone. Abstract presented at Society for Neuroscience. San Diego, CA, USA; 9–13 November 2013. [Google Scholar]
- 38.Staresina BP, Alink A, Kriegeskorte N, Henson RN. 2013. Awake reactivation predicts memory in humans. Proc. Natl Acad. Sci. USA 110, 21 159–21 164. ( 10.1073/pnas.1311989110) [DOI] [PMC free article] [PubMed] [Google Scholar]
- 39.Hellyer PJ, Shanahan M, Scott G, Wise RJS, Sharp DJ, Leech R. 2014. The control of global brain dynamics: opposing actions of frontoparietal control and default mode networks on attention. J. Neurosci. 34, 451–461. ( 10.1523/JNEUROSCI.1853-13.2014) [DOI] [PMC free article] [PubMed] [Google Scholar]
- 40.Fox MD, Snyder AZ, Zacks JM, Raichle ME. 2006. Coherent spontaneous activity accounts for trial-to-trial variability in human evoked brain responses. Nat. Neurosci. 9, 23–25. ( 10.1038/nn1616) [DOI] [PubMed] [Google Scholar]
- 41.Hesselmann G, Kell CA, Eger E, Kleinschmidt A. 2008. Spontaneous local variations in ongoing neural activity bias perceptual decisions. Proc. Natl Acad. Sci. USA 105, 10 984–10 989. ( 10.1073/pnas.0712043105) [DOI] [PMC free article] [PubMed] [Google Scholar]
- 42.Baldassarre A, Lewis CM, Committeri G, Snyder AZ, Romani GL, Corbetta M. 2012. Individual variability in functional connectivity predicts performance of a perceptual task. Proc. Natl Acad. Sci. USA 109, 3516–3521. ( 10.1073/pnas.1113148109) [DOI] [PMC free article] [PubMed] [Google Scholar]
- 43.Dehaene S, Kerszberg M, Changeux J-P. 1998. A neuronal model of a global workspace in effortful cognitive tasks. Proc. Natl Acad. Sci. USA 95, 14 529–14 534. ( 10.1073/pnas.95.24.14529) [DOI] [PMC free article] [PubMed] [Google Scholar]
- 44.Mesulam MM. 1998. From sensation to cognition. Brain 121, 1013–1052. ( 10.1093/brain/121.6.1013) [DOI] [PubMed] [Google Scholar]
- 45.Fries P. 2005. A mechanism for cognitive dynamics: neuronal communication through neuronal coherence. Trends Cogn. Sci. 9, 474–480. ( 10.1016/j.tics.2005.08.011) [DOI] [PubMed] [Google Scholar]
- 46.Friston KJ. 2011. Functional and effective connectivity: a review. Brain Connect. 1, 13–36. ( 10.1089/brain.2011.0008) [DOI] [PubMed] [Google Scholar]
- 47.Bullmore E, Sporns O. 2012. The economy of brain network organization. Nat. Rev. Neurosci. 13, 336–349. [DOI] [PubMed] [Google Scholar]
- 48.Deco G, Jirsa VK. 2012. Ongoing cortical activity at rest: criticality, multistability, and ghost attractors. J. Neurosci. 32, 3366–3375. ( 10.1523/JNEUROSCI.2523-11.2012) [DOI] [PMC free article] [PubMed] [Google Scholar]
- 49.Leopold DA, Maier A. 2012. Ongoing physiological processes in the cerebral cortex. NeuroImage 62, 2190–2200. ( 10.1016/j.neuroimage.2011.10.059) [DOI] [PMC free article] [PubMed] [Google Scholar]
- 50.Deco G, Jirsa VK, McIntosh AR. 2013. Resting brains never rest: computational insights into potential cognitive architectures. Trends Neurosci. 36, 268–274. ( 10.1016/j.tins.2013.03.001) [DOI] [PubMed] [Google Scholar]
- 51.Deco G, Ponce-Alvarez A, Mantini D, Romani GL, Hagmann P, Corbetta M. 2013. Resting-state functional connectivity emerges from structurally and dynamically shaped slow linear fluctuations. J. Neurosci. 33, 11 239–11 252. ( 10.1523/JNEUROSCI.1091-13.2013) [DOI] [PMC free article] [PubMed] [Google Scholar]
- 52.Engel AK, Gerloff C, Hilgetag CC, Nolte G. 2013. Intrinsic coupling modes: multiscale interactions in ongoing brain activity. Neuron 80, 867–886. ( 10.1016/j.neuron.2013.09.038) [DOI] [PubMed] [Google Scholar]
- 53.Liu X, Duyn JH. 2013. Time-varying functional network information extracted from brief instances of spontaneous brain activity. Proc. Natl Acad. Sci. USA 110, 4392–4397. ( 10.1073/pnas.1216856110) [DOI] [PMC free article] [PubMed] [Google Scholar]
- 54.Van Dijk KRA, Sabuncu MR, Buckner RL. 2012. The influence of head motion on intrinsic functional connectivity MRI. NeuroImage 59, 431–438. ( 10.1016/j.neuroimage.2011.07.044) [DOI] [PMC free article] [PubMed] [Google Scholar]
- 55.Andrews-Hanna JR, Reidler JS, Huang C, Buckner RL. 2010. Evidence for the default network's role in spontaneous cognition. J. Neurophysiol. 104, 322–335. ( 10.1152/jn.00830.2009) [DOI] [PMC free article] [PubMed] [Google Scholar]
- 56.Stein BE, Meredith MA. 1993. The merging of the senses. Cambridge, UK: MIT Press. [Google Scholar]
- 57.Wagner AD, Koutstaal W, Maril A, Schacter DL, Buckner RL. 2000. Task-specific repetition priming in left inferior prefrontal cortex. Cereb. Cortex 10, 1176–1184. ( 10.1093/cercor/10.12.1176) [DOI] [PubMed] [Google Scholar]
- 58.Braver T, Cohen J, Nystrom L, Jonides J. 1997. A parametric study of prefrontal cortex involvement in human working memory. NeuroImage 5, 49–62. ( 10.1006/nimg.1996.0247) [DOI] [PubMed] [Google Scholar]
- 59.Poldrack RA, Wagner AD, Prull MW, Desmond JE, Glover GH, Gabrieli JD. 1999. Functional specialization for semantic and phonological processing in the left inferior prefrontal cortex. NeuroImage 10, 15–35. ( 10.1006/nimg.1999.0441) [DOI] [PubMed] [Google Scholar]
- 60.Kwong KK, et al. 1992. Dynamic magnetic resonance imaging of human brain activity during primary sensory stimulation. Proc. Natl Acad. Sci. USA 89, 5675–5679. ( 10.1073/pnas.89.12.5675) [DOI] [PMC free article] [PubMed] [Google Scholar]
- 61.Ogawa S, Tank DW, Menon R, Ellermann JM, Kim S-G, Merkle H, Uğurbil K. 1992. Intrinsic signal changes accompanying sensory stimulation: functional brain mapping with magnetic resonance imaging. Proc. Natl Acad. Sci. USA 89, 5951–5955. ( 10.1073/pnas.89.13.5951) [DOI] [PMC free article] [PubMed] [Google Scholar]
- 62.van der Kouwe AJW, Benner T, Salat DH, Fischl B. 2008. Brain morphometry with multiecho MPRAGE. NeuroImage 40, 559–569. ( 10.1016/j.neuroimage.2007.12.025) [DOI] [PMC free article] [PubMed] [Google Scholar]
- 63.Jenkinson M, Bannister P, Brady M, Smith S. 2002. Improved optimization for the robust and accurate linear registration and motion correction of brain images. NeuroImage 17, 825–841. ( 10.1006/nimg.2002.1132) [DOI] [PubMed] [Google Scholar]
- 64.Smith SM, et al. 2004. Advances in functional and structural MR image analysis and implementation as FSL. NeuroImage 23, S208–S219. ( 10.1016/j.neuroimage.2004.07.051) [DOI] [PubMed] [Google Scholar]
- 65.Greve DN, Fischl B. 2009. Accurate and robust brain image alignment using boundary-based registration. NeuroImage 48, 63–72. ( 10.1016/j.neuroimage.2009.06.060) [DOI] [PMC free article] [PubMed] [Google Scholar]
- 66.Baker JT, Holmes JA, Masters GA, Yeo BTT, Krienen FM, Buckner RL, Ongur D. 2013. Disruption of cortical association networks in schizophrenia and psychotic bipolar disorder. JAMA Psychiatry 71, 109–118. ( 10.1001/jamapsychiatry.2013.3469) [DOI] [PMC free article] [PubMed] [Google Scholar]
- 67.Buckner RL, Krienen FM, Yeo BTT. 2013. Opportunities and limitations of intrinsic functional connectivity MRI. Nat. Neurosci. 16, 832–837. ( 10.1038/nn.3423) [DOI] [PubMed] [Google Scholar]
- 68.Zalesky A, Fornito A, Bullmore ET. 2010. Network-based statistic: identifying differences in brain networks. NeuroImage 53, 1197–1207. ( 10.1016/j.neuroimage.2010.06.041) [DOI] [PubMed] [Google Scholar]
- 69.Lashkari D, Vul E, Kanwisher N, Golland P. 2010. Discovering structure in the space of fMRI selectivity profiles. NeuroImage 50, 1085–1098. ( 10.1016/j.neuroimage.2009.12.106) [DOI] [PMC free article] [PubMed] [Google Scholar]
- 70.Buckner RL, Krienen FM, Castellanos A, Diaz JC, Yeo BTT. 2011. The organization of the human cerebellum estimated by intrinsic functional connectivity. J. Neurophysiol. 106, 2322–2345. ( 10.1152/jn.00339.2011) [DOI] [PMC free article] [PubMed] [Google Scholar]
- 71.Smith SM, et al. 2009. Correspondence of the brain's functional architecture during activation and rest. Proc. Natl Acad. Sci. USA 106, 13 040–13 045. ( 10.1073/pnas.0905267106) [DOI] [PMC free article] [PubMed] [Google Scholar]
- 72.Nelson SM, et al. 2010. A parcellation scheme for human left lateral parietal cortex. Neuron 67, 156–170. ( 10.1016/j.neuron.2010.05.025) [DOI] [PMC free article] [PubMed] [Google Scholar]
- 73.Crossley NA, Mechelli A, Vértes PE, Winton-Brown TT, Patel AX, Ginestet CE, McGuire P, Bullmore ET. 2013. Cognitive relevance of the community structure of the human brain functional coactivation network. Proc. Natl Acad. Sci. USA 110, 11 583–11 588. ( 10.1073/pnas.1220826110) [DOI] [PMC free article] [PubMed] [Google Scholar]
- 74.Buckner RL, Sepulcre J, Talukdar T, Krienen FM, Liu H, Hedden T, Andrews-Hanna JR, Sperling RA, Johnson KA. 2009. Cortical hubs revealed by intrinsic functional connectivity: mapping, assessment of stability, and relation to Alzheimer's disease. J. Neurosci. 29, 1860–1873. ( 10.1523/JNEUROSCI.5062-08.2009) [DOI] [PMC free article] [PubMed] [Google Scholar]
- 75.Yarkoni T, Poldrack RA, Nichols TE, Van Essen DC, Wager TD. 2011. Large-scale automated synthesis of human functional neuroimaging data. Nat. Meth. 8, 665–670. ( 10.1038/nmeth.1635) [DOI] [PMC free article] [PubMed] [Google Scholar]
- 76.Van Essen DC. 2005. A population-average, landmark- and surface-based (PALS) atlas of human cerebral cortex. NeuroImage 28, 635–662. ( 10.1016/j.neuroimage.2005.06.058) [DOI] [PubMed] [Google Scholar]
- 77.Van Essen DC, Dierker D. 2007. Surface-based and probabilistic atlases of primate cerebral cortex. Neuron 56, 209–225. ( 10.1016/j.neuron.2007.10.015) [DOI] [PubMed] [Google Scholar]
- 78.Yeo BTT, Krienen FM, Chee MWI, Buckner RL. 2013. Estimates of segregation and overlap of functional connectivity networks in the human cerebral cortex. NeuroImage 88, 212–217. ( 10.1016/j.neuroimage.2013.10.046) [DOI] [PMC free article] [PubMed] [Google Scholar]
- 79.Wang D, Buckner RL, Liu H. 2013. Cerebellar asymmetry and its relation to cerebral asymmetry estimated by intrinsic functional connectivity. J. Neurophysiol. 109, 46–57. ( 10.1152/jn.00598.2012) [DOI] [PMC free article] [PubMed] [Google Scholar]
- 80.Price CJ, Friston KJ. 2005. Functional ontologies for cognition: the systematic definition of structure and function. Cogn. Neuropsychol. 22, 262–275. ( 10.1080/02643290442000095) [DOI] [PubMed] [Google Scholar]
- 81.Mueller S, Wang D, Fox MD, Yeo BTT, Sepulcre J, Sabuncu MR, Shafee R, Lu J, Liu H. 2012. Individual variability in functional connectivity architecture of the human brain. Neuron 77, 586–595. ( 10.1016/j.neuron.2012.12.028) [DOI] [PMC free article] [PubMed] [Google Scholar]
- 82.Deco G, Jirsa VK, McIntosh AR. 2011. Emerging concepts for the dynamical organization of resting-state activity in the brain. Nat. Rev. Neurosci. 12, 43–56. ( 10.1038/nrn2961) [DOI] [PubMed] [Google Scholar]
Associated Data
This section collects any data citations, data availability statements, or supplementary materials included in this article.