

Abstract
Inhalation of air-dispersed sub-micrometre and nano-sized particles presents a risk factor for animal and human health. Here, we show that nasal aerodynamics plays a pivotal role in the protection of the subterranean mole vole Ellobius talpinus from an increased exposure to nano-aerosols. Quantitative simulation of particle flow has shown that their deposition on the total surface of the nasal cavity is higher in the mole vole than in a terrestrial rodent Mus musculus (mouse), but lower on the olfactory epithelium. In agreement with simulation results, we found a reduced accumulation of manganese in olfactory bulbs of mole voles in comparison with mice after the inhalation of nano-sized MnCl2 aerosols. We ruled out the possibility that this reduction is owing to a lower transportation from epithelium to brain in the mole vole as intranasal instillations of MnCl2 solution and hydrated nanoparticles of manganese oxide MnO · (H2O)x revealed similar uptake rates for both species. Together, we conclude that nasal geometry contributes to the protection of brain and lung from accumulation of air-dispersed particles in mole voles.
Keywords: subterranean rodents, adaptation to dust, nanoparticles, nasal aerodynamics, Ellobius, Mus
1. Introduction
The life of subterranean fossorial rodents is associated with the constant digging of tunnels [1] and, as a result, breathing in air with a high concentration of dust particles. For digging, chisel-tooth-diggers use prominent teeth to loosen the soil keeping their lips closed behind the teeth to prevent soil from entering the buccal cavity [2]. In the process of digging, breathing takes place solely through the nose, which provides an attractive surface for accumulation of solid air-dispersed sub-micrometre and nano-sized particles inhaled from polluted air.
The particles deposited on olfactory epithelium can be transported into olfactory bulbs and further into the brain [3]. Intranasal application or inhalation of nano-sized and even sub-micrometre particles of titanium, silicon, iron and manganese (Mn) oxides results in a significant increase of the studied elements first in the olfactory bulbs and then in other parts of the brain of rats and mice [4–6]. Accumulation of certain metal ions, for example manganese, and nanoparticles results in severe neurotoxic effects [6,7]. In case of nanoparticles, these effects are independent of their chemical composition. For example, accumulation of seemingly neutral compounds, such as silicon and titanium oxide, in the brain triggers the activation of free radical oxidation and the expression of pro-inflammatory cytokines [5,8].
Fossorial animals inhabit environments with high concentrations of Mn and/or cadmium in soil [9] and are subjected to elevated levels of dust. We wondered whether in these animals the nasal aerodynamics could help the removal of sub-micrometre and nano-sized solids from the inhaled air before it reaches the lungs and olfactory epithelium. To test this idea, we conducted a comparative study of the geometry and the gas dynamics of the nasal cavities of species that occupy two distinct ecological niches: terrestrial and subterranean. Laboratory mice, Mus musculus, of the inbred line C57BL were used to represent aboveground rodents, whereas the mole vole, Ellobius talpinus, exemplified the underground fossorial lifestyle. The mole vole is a chisel-tooth-digger inhabiting steppe, forest-steppe and semi-desert in Eastern Europe, the Urals, Central Asia and southwest Siberia [10]. Both species are close in size allowing an adequate morphological comparison. First, we reconstructed the nasal cavities of the mouse and the mole vole using magnetic resonance imaging (MRI). Next, we performed comparative numerical simulations of intranasal flow of sub-micrometre and nano-sized particles followed by MRI analysis of manganese chloride (MnCl2) nano-aerosols and hydrated manganese oxide (MnO · (H2O)x) nanoparticles transportation efficiency from the nasal cavity to the brain. Collectively, these studies uncovered species-specific differences in the nasal geometry and aerodynamics, which in the mole vole lead to a reduced accumulation of nano-sized aerosols on the surface of olfactory epithelium and in the olfactory bulbs.
2. Material and methods
(a). Magnetic resonance imaging of the nasal cavity and the creation of a three-dimensional model
Geometric parameters of the nasal cavities of the laboratory mice (n = 3) and the mole vole (n = 3) were determined by MRI on BioSpec 117/16 USR (Bruker, Germany, 11.7T). The final geometry of the nasal cavities was deduced from comparison of MRI images with the rodent anatomical atlas [11] to account for small bones (see the electronic supplementary material for detailed description of the MRI study).
The shapes of the nose passages were modelled on the basis of a series of tomograms in parallel sections, which were obtained by MRI with a step size of 0.3 mm. A geometric model of the nasal cavity was constructed using the Grapher software system (Golden Software) and geometry software package Gambit. The procedure of construction is described in the electronic supplementary material.
(b). Numerical modelling of the nasal airflow and aerosol deposition in the nasal cavity
A steady-state air flow in nose passages in the breathing-in regime was calculated with the use of the Fluent 12 (ANSYS) software system.
Incompressible Navier–Stokes equations were used to describe the flow:
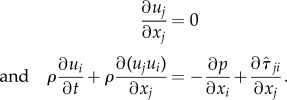 |
Here, t is the time, xi are the point coordinates in space, ui are the velocity components, ρ is the density, p is the pressure and μ is the viscosity. The tensor of viscous stresses is calculated by the following formula:
where Sij is the tensor of the strain rates
The no-slip conditions were imposed on the duct walls. A pressure drop between the duct entrance and exit was specified in the exit section; the value was negative in the case of inhaling. The steady-state solution was found by a time-dependent method, and the error was taken to be 10−5. The basic results were obtained on grids with the number of volume cells equal to (3.0–4.0) × 106. Some verification computations were performed on the finer meshes (see corresponding section in the electronic supplementary material).
The computations estimate the distribution of the flow velocity vector at all points of the nasal cavity and allow determination of the regions with the maximum velocity, the stagnant zones where the flow velocity is close to zero and reverse flow regions where the flow velocity is opposite to the main flow direction. In addition, the air mass flow was calculated for each value of the pressure drop.
In order to calculate the deposition of nanoparticles, uniform injection of approximately 4000 particles per injection into the nasal cavity was assumed. Particles that were 5–500 nm in size and had a material density of 1000 kg m−3 were considered. On the base of the program Fluent 12, the setting up of a problem was as follows: the Navier–Stokes equations were used for the motion of air, and the Lagrange approach was used to track the particle trajectories.
(c). Transfer of manganese from the nasal cavity into the brain
The study was conducted on six mice and six mole voles, with three animals in each of the experimental groups. In order to investigate the transfer of manganese ions and hydrated nanoparticles MnO · (H2O)x into the brain, MnCl2 and nanoparticles were administered into the left nostril, under an urethane anaesthesia (75 mg kg−1), using an automatic pipette until the nasal cavity was fully filled. The manganese-enhanced MRI (MEMRI) of the olfactory bulbs was studied 24 h following the intranasal administration on animals under isoflurane anaesthesia (SEP-10S PLUS, AitecsViltechmeda). See the electronic supplementary material for detailed description of MEMRI.
(d). Comparative analysis of manganese accumulation through inhalation of aerosols
The study was conducted on 10 mice of the inbred line C57BL/6 and 10 male mole voles. For the exposure to nano-aerosols, the following set-up was created (electronic supplementary material, figure S4a). The aerosol was created from 0.2 M MnCl2 solution with an average droplet size of approximately 47 nm (electronic supplementary material, figure S4b) pumped at the rate of approximately 125 000 particles ml−1. The resulting nano-aerosol had comparable characteristics to that used in the aerodynamic model with regard to the density approximately 1000 kg m−3, the droplet size and the lack of charge to prevent electrostatic effects on particles transmission.
Accumulation of manganese in the olfactory bulbs was studied using seven mice and seven mole voles, which were exposed to the aerosols for a period of 2 h. Three control mice and three control mole voles were also placed in the exposure chamber and provided with a manganese-free airborne mixture. The accumulation of manganese in the olfactory bulbs was detected by the MRI signal expressed in conventional units (CU). See the electronic supplementary material for detailed description of experimental procedures.
3. Results
(a). Magnetic resonance imaging analysis and three-dimensional modelling of the nasal cavity
The size and the shape of nasal cavities have pronounced differences between species in the area of maximum cross section (figure 1a), which is 1.13 ± 0.10 mm2 in the mouse and 3.33 ± 0.25 mm2 in the mole vole (p < 0.01, Mann–Whitney U-test). All dimensional characteristics of the nasal cavities of the mole vole surpassed that of the laboratory mouse (figure 1a′). For characterization of the total surface area (Sw) and the volume (V), the three-dimensional reconstructions of the nasal cavities from MRI data were obtained for an average body weight of 58 g for the mole vole and 31 g for the mouse. For the mole vole, the values of Sw and V were 515 mm2 and 60 μl, respectively, and for the mouse these values were 219 mm2 and 17 μl, respectively. V of the nasal cavity is a part of the ventilation dead space, which according to power law is proportional to body mass raised to power of 0.78 [12]. Thus, V per unit of body mass0.78 was equal to 2.5 μl g−1 in the mole vole and 1.2 μl g−1 in the mouse.
Figure 1.

Quantitative modelling of nasal aerodynamics and dust deposition in the mouse and the mole vole. (a) Three-dimensional models of the nasal cavities. The ethmoid turbinate (ET) is outlined with a black line. (a′) MRI slices of the maximum cross section (a, dashed line) of the nasal cavities and the quantitative values (means ± s.e.) for the maximum height (hmax), maximum width (Wmax) and length (L), derived from MRI scans of three mice and three mole voles. Differences between mouse and mole vole are statistically significant for all dimensions (p < 0.01, Mann–Whitney U-test). (b) The quantitative model of the absolute velocities |V|, and (b′) streamline distribution in the nasal cavities of laboratory mice and mole voles. Cross section in the middle of the model (vertical lines on (b′)) revealed the following proportions of the upper/middle/low parts of air flow expressed as % from the total flow: 41.1/53.8/5.1 for mouse and 30.9/42.5/26.6 for mole vole. (c) Fraction of particles deposited on the total surface of the nasal cavity in laboratory mice and mole voles, as a function of particle size and respiratory pressure changes (Pa). (d) Fraction of particles deposited on the surface of the olfactory epithelium (ET) in laboratory mice and mole voles, as a function of particle size and respiratory pressure changes (Pa).
(b). Quantitative modelling of aerodynamics
Respiratory parameters, registered from conscious animals (electronic supplementary material, figure S1), were used to determine the boundary values of respiration for the quantitative modelling of aerodynamics of the nasal cavity. In mice, tidal volume varied between 150 and 250 µl, with a respiratory rate of 170–320 cycles per minute. In the mole vole, the respiratory volume varied between 350 and 400 µl, and the rate was found to be between 150 and 200 cycles per minute.
Because breathing through the oral cavity is insignificant in rodents, the data from the plethysmography reflect the volumes of air that enter the nasal cavity during inhalation and exhalation. Based on these data, the average values of the airflow in the nasal cavities were determined to be 1.5 ml s−1 for the mouse and 2.5 ml s−1 for the mole vole. These values correspond to a pressure difference of 175 Pa for the mouse and 140 Pa for the mole vole. Thus, the main results of the calculations are presented for the interval of pressure drop from 100 to 200 Pa, which corresponds to a normal respiratory rate for the studied animals.
Theoretical visualization of the airflow in the nasal cavity and the flow characteristics are illustrated in figure 1b. In the nasal cavity of mole vole, the flow is divided into three parts, which are comparable in magnitude. Cross section in the middle of the nasal model length revealed the following proportions of the flows in the upper (30.9%), the middle (42.5%) and the low parts (26.6%) of the total air flow. By contrast to mole vole, the two dominant flows were evident in the cross section of mouse nasal cavity: the top—41.1%, the middle—53.8% and the low—5.1% (figure 1b′).
The volume fraction of ethmoid turbinate (ET) in the mole vole is higher than in the mouse, and airflow through this part of the nasal cavity is very weak (figure 1b′). The theoretically predicted dependence of the volume flow rate on respiratory effort indicates a lower resistance to the inhaled air flow in the mole vole as compared with the mouse (electronic supplementary material, figure S2).
(c). Quantitative modelling of aerosol deposition in the nasal cavity
The deposition of differently sized particles was calculated for the total surface area of the nasal cavity and for the surface of the ET, which is the main location for olfactory epithelium (figure 1a). The ET makes up 47.6% of the total surface area in the mouse and 54.6% in the mole vole. These values are in agreement with the data obtained during the analysis of serial histological slices of the laboratory mice [13].
In both species, the deposition of the particles in various regions of the nasal cavity is sharply reduced as the particle size increases from 5 to 50 nm and remains practically constant (very weak decreasing) after reaching 100 nm (figure 1c). In addition, the amount of sub-micrometre particles (greater than 50 nm) that are deposited on the total surface of the nasal cavity is approximately 1.5 times higher in the mole vole than in the mouse. However, on the surface of the ET, the deposition is opposite. In the mouse, twice as many particles are deposited on the ET as compared with the mole vole (figure 1d). In the mouse, the total deposition efficiency decreases with an increase of the pressure drop from 100 to 200 Pa. A similar pattern was described for the rat [14]. In the mole vole, total deposition has the same character for particles sized up to about 30 nm. But for greater size values, particle deposition increases with increase of pressure drop (or flow rate), suggesting that the structure of the mole vole nasal cavity promotes an effect of particle inertia to a greater extent. This effect is most likely owing to the differences in geometry of the nasal cavities for the mole vole and for the mouse and the rat, which are similar among themselves.
(d). The uptake of Mn2+ ions and MnO · (H2O)x nanoparticles from olfactory epithelium into the brain
To study the transfer of Mn2+ and nanoparticles, we instilled the solutions of MnCl2 or a suspension of MnO · (H2O)x into the left nostril. Mn accumulation in the olfactory bulbs was tested 24 h following the intranasal administrations by means of the MEMRI. The quantitative correspondence between the intensity of the MRI signal and the concentration of Mn in the olfactory bulb was assessed in a separate study on 12 mice (electronic supplementary material, figure S3). CU of the MRI signal showed highly significant correlation with the concentration of Mn in the studied brain tissue (r = 0.96, p = 0.003).
A two-factor analysis of variance showed that the intensity of the MRI signal (CU) in the olfactory bulbs (figure 2a) is independent of the animal species (F1,10 = 0.001, p = 0.98) and of the type of Mn administered (F1,10 = 0.03, p = 0.88).
Figure 2.
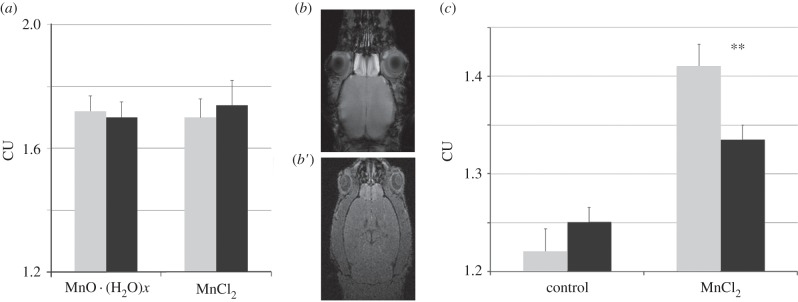
The accumulation of Mn in the olfactory bulbs of mice (grey bars) and mole voles (black bars) following the intranasal instillation of MnO · (H2O)x and MnCl2 solutions or inhalation of nano-aerosols containing MnCl2. (a) Intensity of the MRI signal in CU in the olfactory bulbs in mice and mole voles 24 h after intranasal application of the nanoparticles of MnO · (H2O)x and MnCl2 solutions. (b) MRI axial sections of the olfactory bulbs of mouse (b) and mole voles (b′) following 24 h inhalation of nano-aerosols containing MnCl2. (c) Intensity of the MRI signal (CU) in the olfactory bulbs of mice and mole voles in the control group and in the group exposed to nano-aerosols containing MnCl2 24 h before MRI study. Double asterisk (**): mole voles accumulate significantly less Mn in the bulbs from nano-aerosols than mice as revealed by Student t-test (t12 = 3.76, p = 0.003).
(e). Accumulation of Mn2+ ions in the brain following nano-aerosol exposure
The accumulation of Mn in the olfactory bulbs was investigated through MEMRI scans 24 h after a 2 h exposure of mice and mole voles to chambers containing aerosols of MnCl2 and chambers free of MnCl2 (control). The control animals of the investigated species did not vary in the intensity of MRI signal (t = 0.82, p = 0.46). However, the intensity of the MRI signal was significantly larger in laboratory mice exposed to the MnCl2 aerosols (figure 2b,c), compared with the mole voles exposed to the same condition (t = 3.76, p = 0.003).
To account for the effect of body size on accumulation of Mn2+ ions from the inhaled aerosols, we performed an additional experiment on Syrian hamsters. Syrian hamsters are terrestrial rodents, whose body mass is approximately two times higher than the mole vole's. Intensity of MRI signal in the olfactory bulb did not differ significantly from the mouse, but exceeded significantly the signal observed for the mole vole (electronic supplementary material, figure S5).
4. Discussion
Numerical simulation of intranasal airflows based on the geometric differences of the nasal cavities revealed that in the nasal cavities of the mouse, the air streaming through the dorsal meatus predominates; while in the nasal cavity of the mole vole the air streaming through the middle and ventral meatus prevails. The most obvious differences between the studied species occur in the spatial organization of the Z-shaped caudal flow, which directly hits the external surface of the ET in mouse and rat [15], while a buffer region is created between the caudal flow and the ET in the mole vole (figure 1b′).
The revealed differences in airflow organization result in theoretically predicted differences in deposition of inhaled aerosols in the studied species. The fraction of the particles deposited on the total surface of the nose is 1.5 times larger in the mole vole compared with the mouse, which corresponds to a greater than twofold difference in the surface area of the nasal cavity. Another important aspect, which was determined through quantitative modelling of the deposition of aerosols is that with a large change in pressure, which corresponds to forced breathing, the deposition of solid particles (more than 30 nm) increases in the mole vole. It is in contrast with our calculations for the laboratory mouse and the data for the rat [14]. Both terrestrial species show a decreasing deposition of solid particles with an increasing flow rate. In the mole vole nose, the stream after input section immediately expands and turns downward at an angle about twice as large than that of the mouse and the rat promoting an effect of particle inertia. In the input section, particles accelerate to high velocities in the narrow and elongated space of the nasal entry. Rapid turns deviate this flow significantly resulting in large particles (more than 30 nm) depositing on the surface by inertia, especially, under higher flow rates. This effect is reflected by an instant dependence between flow and deposition rates in the mole vole, but not in the mouse, in which the turn angle is smaller (figure 1b′). For smaller particles (less than 20 nm), however, inertia is low and the deposition rate depends inversely on the flow rate with less effect from the turn angle (figure 1c).
It is known that lung ventilation is determined by oxygen consumption, which varies from minimal values during sleep to maximum values during physical activity. In mice, the highest activity is observed when the mouse leaves its nesting chambers for ‘fresh air’ [16]. In fossorial rodents, represented by the mole vole, the highest intensity of energy metabolism and ventilation rate is observed during the process of digging tunnels [17]. In the subterranean mole vole, the deposition of sub-micrometre and nano-sized particles on the nasal epithelium is increased upon increase of respiratory rate, which results in the lowering of solids accumulation in the lower respiratory tract.
Despite the fact that the surface area of the ET in the mole vole is 2.7 times larger than in the mouse, the fraction of aerosols that is deposited in this area is two times lower. As a result, the total number of particles per square unit (mm2) deposited on the surface of the olfactory epithelium is approximately six times less in the mole vole than that in the mouse. This condition can play a significant role in the defence of the brain of subterranean rodents against potential neurotoxic particles, which make up part of the inhaled aerosols. Our data show that both Mn2+ ions and MnO · (H2O)x nanoparticles transfer efficiently from the olfactory epithelium into the bulbs and further into the brain in both species upon direct intranasal instillation. However, when Mn2+ ions were administered in the form of nano-sized aerosol (≈50 nm), the accumulation of Mn in the olfactory bulbs was significantly lower in mole voles than in mice and Syrian hamsters. Although the direct measurements of airflow for animals are nearly impossible, our numerical analysis of nasal airflow in the mole vole and in the mouse provides a potential mechanism to account for this species-specific difference. The nasal cavity of the mole vole prompts higher deposition of inhaled particles on the total surface of the cavity, which results in a significant decrease in deposition of aerosols in the region of the ET and their accumulation in olfactory bulbs. Thus, in comparison to the mouse, the nasal structure of the mole vole limits more effectively the transfer of dust particles into the brain and the lungs.
Epidemiological observations suggest an ecological significance of the accumulation of certain metals, including Mn, in brain structures. For example, deterioration in motor function is proportional to the levels of Mn found in the soil of various geochemical provinces [18]. Likewise, an increase in Mn in the brains of professional welders leads to a quicker development of Parkinson's disease [19,20]. Negative effects of nano- and micro-sized aerosol inhalation are not limited to the brain but also extend to lungs [21]. In this regard, the nasal structure of the mole vole, as a representative of subterranean mammals, points to a possible adaptive mechanism to habitation in an environment with dust excess. We anticipate that this adaptation is not limited to just one trait and that a complex of morphological and functional properties serves to protect subterranean animals from the exposure to nano- and sub-micrometre-sized aerosols. Therefore, a larger comparative study will be of interest for future studies to elucidate adaptive patterns for underground life under dust load.
Supplementary Material
Acknowledgements
We wish to thank Matvey Y. Moshkin and L.I. Khlestova for extensive assistance in the preparation of this manuscript and W. Lidicker for the helpful comments.
Animals were handled in compliance with the rules of the Animal Care and Use Committee, Institute of Cytology and Genetics, Siberian Branch of Russian Academy of Science, Novosibirsk, Russian Federation (ICG SB RAS). All experimental procedures were approved by the Bioethics Review Committee, ICG SB RAS.
Funding statement
This study was supported by the Interdisciplinary integration research grants from the Siberian Branch of the Russian Academy of Sciences (grant nos 57, 60, 61, 108 and 122) and by a grant of the Russian Science Foundation (grant no. 14–14–00221).
References
- 1.Nevo E. 1999. Mosaic evolution of subterranean mammals: regression, progression and global convergence. Oxford, UK: Oxford University Press. [Google Scholar]
- 2.Stein BR. 2000. Morphology of subterranean rodents. In Life underground: the biology of subterranean rodents (eds Lacey EA, Patton JL, Cameron GN.), pp. 19–60. Chicago, IL: University of Chicago Press. [Google Scholar]
- 3.De Lorenzo AJD. 2008. The olfactory neuron and the blood-brain barrier. In Ciba foundation symposium: taste and smell in vertebrates (eds Wolstenholme GEW, Knight J.), pp. 151–176. London, UK: Churchill. [Google Scholar]
- 4.Elder A, et al. 2006. Translocation of inhaled ultrafine manganese oxide particles to the central nervous system. Environ. Health Perspect. 114, 1172–1178. ( 10.1289/ehp.9030) [DOI] [PMC free article] [PubMed] [Google Scholar]
- 5.Wang J, et al. 2008. Time-dependent translocation and potential impairment on central nervous system by intranasally instilled TiO2 nanoparticles. Toxicology 254, 82–90. ( 10.1016/j.tox.2008.09.014) [DOI] [PubMed] [Google Scholar]
- 6.Lucchini RG, Dorman DC, Elder A, Veronesi B. 2012. Neurological impacts from inhalation of pollutants and the nose–brain connection. Neurotoxicology 33, 838–841. ( 10.1016/j.neuro.2011.12.001) [DOI] [PMC free article] [PubMed] [Google Scholar]
- 7.Win-Shwe TT, Fujimaki H. 2011. Nanoparticles and neurotoxicity. Int. J. Mol. Sci. 12, 6267–6280. ( 10.3390/ijms12096267) [DOI] [PMC free article] [PubMed] [Google Scholar]
- 8.Wu J, Wang C, Sun J, Xue Y. 2011. Neurotoxicity of silica nanoparticles: brain localization and dopaminergic neurons damage pathways. ACS Nano 5, 4476–4489. ( 10.1021/nn103530b) [DOI] [PubMed] [Google Scholar]
- 9.Bench G, Carlsen TM, Grant PG, Wollett JS, Martinelli RE, Lewis JL, Divine KK. 2001. Olfactory bulb uptake and determination of biotransfer factors in the California ground squirrel Spermophilus beecheyi exposed to manganese and cadmium in environmental habitats. Environ. Sci. Tech. 270, 270–277. ( 10.1021/es0014180) [DOI] [PubMed] [Google Scholar]
- 10.Moshkin M, Novikov E, Petrovski D. 2007. Skimping as an adaptive strategy in social fossorial rodents: the mole vole (Ellobius talpinus) as an example. In Subterraneanl rodents: news from underground (eds Begall S, Burda H, Schleich CE.), pp. 49–60. Berlin, Germany: Springer. [Google Scholar]
- 11.Bab I, Gabet Y, Hajbi-Yonissi C, Müller R. 2007. Micro-tomographic atlas of the mouse skeleton. LLC, Boston, MA: Springer Science and Business Media. [Google Scholar]
- 12.Tenney SM, Bartlett D. 1967. Comparative quantitative morphology of the mammalian lung: trachea. Respir. Physiol. 3, 130–135. ( 10.1016/0034-5687(67)90002-3) [DOI] [PubMed] [Google Scholar]
- 13.Gross EA, Swenberg JA, Fields S, Popp JA. 1982. Comparative morphometry of the nasal cavity in rats and mice. J. Anat. 135, 83–88. [PMC free article] [PubMed] [Google Scholar]
- 14.Schroeter JD, Kimbell JS, Asgharian B, Tewksbury EW, Singal M. 2012. Computational fluid dynamics simulation of submicrometer and micrometer particle deposition in the nasal passages of a Sprague-Dawley rat. J. Aerosol Sci. 43, 31–44. ( 10.1016/j.jaerosci.2011.08.008) [DOI] [Google Scholar]
- 15.Ménache MG, Hanna LM, Gross EA, Lou SR, Zinreich SJ, Leopold DA, Jarabek AM, Miller FJ. 1997. Upper respiratory tract surface areas and volumes of laboratory animals and humans: considerations for dosimetry models. J. Toxicol. Environ. Health 50, 475–506. ( 10.1080/00984109708984003) [DOI] [PubMed] [Google Scholar]
- 16.Crowcroft P, Rowe FP. 1963. Social organization and territorial behaviour in the wild house mouse (Mus musculus). Proc. Zool. Soc. Lond. 140, 517–531. ( 10.1111/j.1469-7998.1963.tb01871.x) [DOI] [Google Scholar]
- 17.Zelová J, Sumbera R, Okrouhlík J, Sklíba J, Lövy M, Burda H. 2011. A seasonal difference of daily energy expenditure in a free-living fossorial rodent, the silvery mole-rat (Heliophobius argenteocinereus; Bathyergidae). Comp. Biochem. Physiol. A Mol. Integr. Physiol. 158, 17–21. ( 10.1016/j.cbpa.2010.07.026) [DOI] [PubMed] [Google Scholar]
- 18.Rentschler G, Covolob L, Haddad AA, Lucchinic RG, Zonic S, Broberg K. 2012. ATP13A2(PARK9) polymorphisms influence the neurotoxic effects of manganese. Neurotoxicology 33, 697–702. ( 10.1016/j.neuro.2012.01.007) [DOI] [PMC free article] [PubMed] [Google Scholar]
- 19.Racette BA, et al. 2012. Increased risk of Parkinsonism associated with welding exposure. Neurotoxicology 33, 1356–1361. ( 10.1016/j.neuro.2012.08.011) [DOI] [PMC free article] [PubMed] [Google Scholar]
- 20.Chang Y, et al. 2009. High signal intensity on magnetic resonance imaging is a better predictor of neurobehavioral performances than blood manganese in asymptomatic welders. Neurotoxicology 30, 555–63. ( 10.1016/j.neuro.2009.04.002) [DOI] [PubMed] [Google Scholar]
- 21.Ameille J. 2012. The different pleuro-pulmonary pathologies related to asbestos: definitions, epidemiology and evolution. Rev. Mal. Respir. 29, 1035–1046. ( 10.1016/j.rmr.2012.02.012) [DOI] [PubMed] [Google Scholar]
Associated Data
This section collects any data citations, data availability statements, or supplementary materials included in this article.