

Abstract
Purpose
To prospectively compare the diagnostic accuracy of intravesical prostatic protrusion (IPP), detrusor wall thickness (DWT), prostate volume (PV) and serum prostate specific antigen (PSA) levels for detecting bladder outlet obstruction (BOO) and predicting acute urinary retention (AUR) secondary to benign prostatic obstruction.
Patients and methods
In all, 135 men who presented with lower urinary tract symptoms due to benign prostatic enlargement were enrolled in the study; among them, 50 presented with AUR. Thirty normal men in the same age group were included and represented a control group for normative data. Their evaluation included a digital rectal examination, International Prostate Symptom Score and quality-of-life question, uroflowmetry and serum total PSA assay. Transabdominal ultrasonography was used to measure the PV, IPP DWT and post-void residual urine volume. Pressure-flow urodynamic studies were used as the reference standard test for BOO, differentiating obstructed from unobstructed bladders. DWT, IPP, PV and total PSA level served as index tests. To compare the usefulness of the various indices, the area under the curve (AUC) of receiver-operator characteristic curves was calculated for each index.
Results
According to presentation and urodynamic studies, patients were classified into three groups: Group 1 (no BOO), 50 patients with a BOO index (BOOI) of <40; group 2 (BOO), 35 with a BOOI of >40; and group 3 (AUR), 50 who presented with AUR. The IPP, DWT, PV and PSA levels differed significantly between obstructed and unobstructed patients, with a significant correlation with the BOOI. The AUC for IPP, DWT, PSA and PV were 0.885, 0.783, 0.745 and 0.678, respectively. The IPP threshold at 8 mm provided the best diagnostic accuracy (80%) for detecting BOO, followed by combined DWT and IPP (77.6%). Between patients with and without AUR, there was a highly significant difference in IPP, DWT and PSA; a combined IPP threshold of >8 mm and DWT >2 mm detected AUR in 45 of 50 patients (90%).
Conclusion
All four noninvasive indices were correlated significantly with BOOI. The IPP as a single variable and combined with DWT predicted BOO and AUR better than PSA or PV.
Abbreviations: AUC, area under the curve; BOOI, BOO index; BPE, benign prostatic enlargement; BPO, benign prostatic obstruction; DO, detrusor overactivity; DWT, detrusor wall thickness; IPP, intravesical prostatic protrusion; PFS, pressure-flow study; PV, prostate volume; PVR, postvoid residual urine; Qmax, maximum free-flow rate; ROC, receiver operator characteristics; QoL, quality of life; PPV, NPV, positive, negative predictive value; TAUS, transabdominal ultrasonography
Keywords: Bladder outlet obstruction, Intravesical prostatic protrusion, Prostate-specific antigen, Prostatic volume, Detrusor wall thickness
Introduction
BPH is a pathological process that contributes to, but is not the sole cause of, LUTS in ageing men [1]. BOO is obstruction during voiding and is characterized by increased detrusor pressure and a reduced urinary flow rate [2]. The standard for diagnosing BOO is pressure-flow studies (PFS) that offer information regarding the degree of BOO through measuring the BOO index (BOOI) [3]. However, the routine use of PFS in clinical application at most centres is limited, because they are invasive and have potential complications [4], beside being time-consuming and using personnel and financial resources. Thus, a noninvasive, quick, inexpensive and easily available diagnostic tool with a high specificity and sensitivity for determining BOO would be ideal. Recent studies suggested that assessing of detrusor wall thickness (DWT) [5–7] and intravesical prostatic protrusion (IPP) [7–10] by transabdominal ultrasonography (TAUS) might be useful for diagnosing BOO. Also it was reported that the grade of IPP can predict the success rate of a voiding trial without catheterization after an episode of acute urinary retention (AUR) and be helpful in clinical decision-making [9]. Therefore, the aim of the present study was to prospectively evaluate the clinical utility of DWT, IPP, prostate volume (PV), and PSA measurements as noninvasive predictors of BOO and AUR in patients with symptomatic BPH.
Patients and methods
From September 2008 to October 2010, 155 consecutive men aged >50 years, presenting with LUTS suggestive of benign prostatic enlargement (BPE), were recruited. Exclusion criteria included prostate cancer, previous prostate surgery, neurogenic bladder, diabetes mellitus, vesical stones, UTI, urethral strictures and chronic urinary retention. Patients on current α-blockers or on 5α-reductase inhibitors were also excluded. Twenty cases were excluded, 12 according to exclusion criteria (vesical calculi in four, chronic retention in three, neurogenic bladder in two, urethral stricture in two and cancer of the prostate in one), and eight due to an incomplete data set. Thus 135 patients fulfilled the inclusion and exclusion criteria, and had a complete data set, comprised the study population. Among them, 50 patients presented with AUR and failed at least one trial of voiding without catheterisation. Thirty normal volunteers were included as a control group in the noninvasive part of the study, to obtain normative data. The evaluation included a DRE, IPSS with the quality-of-life (QoL) question, and serum PSA measurement. The patients with AUR were asked to record their symptoms for 1 month before the onset of retention. The study was approved by the local ethical committee and all men gave written informed consent.
For TAUS, we used a Model SSA-350 A machine (Toshiba Inc., Tokyo, Japan) with a 3.5-MHz convex probe and a 7.5-MHz linear probe scan administered by one operator (H.F.) to measure the IPP, PV, postvoid residual urine volume (PVR) and DWT. At a bladder volume of 150–200 mL the PV and IPP were evaluated, with PV calculated using the ellipsoid formula, π/6 × prostate width × height × depth.
The IPP was assessed using a 3.5-MHz probe in the mid-sagittal plane, and defined as the vertical distance from the tip of the prostatic protrusion to the bladder circumference at the prostate base (Fig. 1). The IPP grade was determined as: grade I, <5 mm; grade II, 5–10 mm; and grade III, >10 mm [9].
Figure 1.
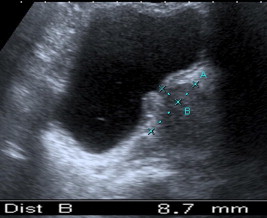
An example of IPP grade II.
DWT was measured using the 7.5-MHz linear probe in the horizontal direction at maximum magnification, when the bladder volume was ≈200 mL, by natural filling in patients without retention, or by infusion through the indwelling catheter in patients with AUR (Fig. 2). The outer and inner detrusor muscle surfaces were identified by hyperechogenic lines corresponding to subserosal tissue and to bladder mucosa plus submucosal tissue, respectively. The hypoechogenic layer in between corresponding to the detrusor wall was measured at three points of the anterior bladder wall, 1 cm apart, and a mean value was recorded for further calculation [5].
Figure 2.

Measurements made to compute the DWT.
PFS were conducted in patients presenting with LUTS suggestive of benign prostatic obstruction (BPO). According to the ICS recommendations [11] using a urodynamic unit (Ellipse 4, Andromeda Medizinische System, Germany), the extent of BOO was calculated as the BOOI, also known as the Abrams–Griffith score. A BOOI of >40 indicates definite obstruction, 20–40 is equivocal and <20 indicates no obstruction [2]. The investigator responsible for urodynamics was unaware of the TAUS results. Obstructed and unobstructed bladders were divided on the basis of the PFS analysis, which served as the reference standard test for BOO. The TAUS measured DWT, IPP, PV, and total PSA level, served as index tests.
The data distribution was not normal and nonparametric tests were used. Differences in clinical and urodynamic characteristics among the groups were evaluated by the nonparametric Kruskal–Wallis test and Mann–Whitney U-test for pair-wise comparison of continuous data, as appropriate. Obstructed and unobstructed patients were compared using the chi-square and Fisher’s exact test with risk estimates as appropriate. Correlations were quantified using the nonparametric Spearman’s rank correlation (rho) to detect correlations between BOOI and other variables. Receiver operator characteristic (ROC) curves were produced to evaluate the area under the curve (AUC) and the diagnostic performance of IPP, DWT, PV and PSA for BOO. The AUC was calculated to determine the strength of association, considering an AUC of 0.5 to be no association and an AUC of 1.0 to be the best possible association. The diagnostic accuracy for BOO was calculated for IPP, DWT, PV and PSA. Data are shown as the mean (SD) and P < 0.05 was considered to indicate statistical significance.
Results
Patients without AUR were assigned into two groups according to BOOI. Group 1 (no BOO) included 50 patients, of whom 17 had a mean (SD, range) BOOI of 12.7 (4.4, 3–17) and 33 had equivocal BOOI, with a mean (SD, range) BOOI of 28.2 (4.6, 20–36). There was no significant difference between patients with unobstructed and equivocal BOOI for the other variables of age, IPSS, QoL, PV, PSA, PVR, maximum urinary flow rate (Qmax), DWT and IPP, hence they were considered as one group. Group 2 (BOO) included 35 men with a BOOI of >40. The 50 men who presented with AUR were classified as group 3. There was a significant difference between normal men and patients with symptomatic BPE (group 1 and 2) in all variables except for IPP, where it was insignificant between the control and group 1. The difference between obstructed and unobstructed patients was significant for IPP, DWT, Qmax, PSA, PV, IPSS and QoL (Table 1).
Table 1.
The mean (SD, range) baseline characteristics of patients with and without BOO, compared to normal men.
| Variable | Control (30) | No BOO (50) | P⁎ | BOO (35) | P† | P† |
|---|---|---|---|---|---|---|
| Age, years | 57.3 (0.4, 55–66) | 58.9 (4.4, 52–71) | 0.1 | 58.4 (6.5, 50–72) | 0.8 | 0.2 |
| BOOI | 22.9 (8.7, 3–36) | 51.3 (9.3, 42–86) | <0.001 | |||
| PV, mL | 40.9 (7.5, 29–57) | 51.1 (8.9, 35–68) | <0.001 | 59.2 (11, 39–86) | <0.001 | 0.005 |
| IPP, mm | 2.7 (1.8, 0–8.7) | 3.99 (3.4, 0–11.6) | 0.08 | 10 (4.4, 0–21) | <0.001 | <0.001 |
| DWT, mm | 1.3 (0.4, 0.8–2.3) | 1.7 (0.4, 1–2.6) | <0.001 | 2.2 (0.5, 1–2.9) | <0.001 | <0.001 |
| PVR, mL | 10.5 (13.6, 0–35) | 22.8 (25.6, 0–85) | 0.04 | 39.4 (43.9, 0–120) | 0.01 | 0.1 |
| PSA, ng/mL | 2.21 (0.7, 0.3–3.24) | 2.49 (1, 0.4–5.6) | 0.2 | 3.66 (1.5, 1.26–8.6) | <0.001 | <0.001 |
| Qmax, mL/s | 20.9 (2.1, 16–24) | 13.8 (4.5, 8.5–22.3) | <0.001 | 12.8 (4.1, 6.9–19.2) | <0.001 | 0.04 |
| IPSS | 2.7 (1.6, 0–7) | 11 (2, 8–21) | <0.001 | 13.9 (4.6, 6.5–25) | <0.001 | 0.002 |
| QoL | 0.5 (0.7, 0–2) | 2.9 (1.2, 0–4) | <0.001 | 4.5 (1.1, 2–6) | <0.001 | <0.001 |
Mann–Whitney U-test.
Significant vs. control group.
No BOO vs BOO.
Spearman’s rho between the variables in group 1 and group 2 and BOOI showed significant positive correlations with IPP (correlation coefficient 0.595, P < 0.001), DWT (0.422, P < 0.001), PSA (0.341, P = 0.001) and a modest correlation with PV (0.241, P = 0.02).
A ROC curve was produced in patients confirmed to be obstructed or not, and the AUC computed for the prognostic value of IPP, DWT, PSA and PV to diagnose BOO (Fig. 3). The AUC (95% CI) for IPP was 0.885 (0.806–0.963), for DWT was 0.783 (682–0.885), for PSA was 0.745 (0.638–0.851), and for PV was 0.678 (0.562–0.794). The best threshold value for IPP was 8 mm, for DWT was 2 mm, for PSA was 2.5 ng/mL and for PV was 45 mL.
Figure 3.

The ROC curves for IPP, DWT, PSA and PV in 85 patients.
Detrusor overactivity (DO) was significantly associated with obstruction, being detected in seven of 35 (20%) obstructed patients, but in two of 50 (4%) unobstructed men (P = 0.01, odds ratio 0.474, 95% CI 0.3–0.748). An interesting finding in patients with DO was a significantly higher mean IPP of 9.9 (3.9) mm vs. 6.1 (4.8) mm (P = 0.03) in patients without DO. The mean DWT was 2.5 (0.1) mm in patients with DO and 1.9 (0.5) mm in patients without (P = 0.001; data not shown).
The performance of thresholds for different indices in detecting BOO is shown in Table 2. At a threshold of 8 mm the IPP had a positive predictive value (PPV) of 73.7%.
Table 2.
Thresholds, sensitivity, specificity, PPV and NPV of the noninvasive variables for detecting BOO.
| Variables | Threshold | Sensitivity, % | Specificity, % | PPV, % | NPV, % | Accuracy, % | LR+ | LR– |
|---|---|---|---|---|---|---|---|---|
| IPP | 8 mm | 80 | 80 | 73.7 | 85.1 | 80 | 4 | 0.25 |
| DWT | 2 mm | 65.7 | 76 | 65.7 | 76 | 71.8 | 2.74 | 1.91 |
| PSA | 2.5 ng/mL | 74.3 | 50 | 51 | 73.5 | 60 | 1.48 | 0.51 |
| PV | 45 mL | 85.7 | 26 | 48.6 | 72.2 | 50.6 | 1.16 | 0.549 |
| DWT/IPP | 8 mm | 91.4 | 68 | 66.7 | 91.9 | 77.6 | 2.85 | 0.126 |
| DWT/IPP | 8 mm/PSA | 94.2 | 36 | 50.7 | 90 | 60 | 1.47 | 0.158 |
Definitions: Sensitivity, proportion of a positive test result among diseased subjects; specificity, proportion of a negative test result among healthy subjects; PPV, proportion of diseased among subjects with a positive test result; NPV, proportion of healthy among subjects with a negative test result; accuracy, proportion of correctly identified subjects; likelihood ratio of a positive test result (LR+), ratio of a positive test result among diseased subjects to the same result in the healthy, =sensitivity/(1 – specificity); likelihood ratio of a negative test result (LR–), ratio of a negative test result among diseased subjects to the same result in the healthy, =(1 – sensitivity)/specificity).
Table 3 shows a comparison of clinical variables in patients with and without AUR. There was a highly significant difference in IPP (P < 0.001), followed by DWT (P = 0.001). A combined IPP of >8 mm and DWT of >2 mm detected AUR in 45 of the 50 patients (90%) (Table 4).
Table 3.
Values of clinical variables in all patients, stratified by the presence or absence of AUR.
| Mean (SD, range) variable | No retention (85) | AUR (50) | P (Mann–Whitney) |
|---|---|---|---|
| Age, years | 58.7 (5.4, 50–72) | 61.4 (6.9, 50–72) | 0.03 |
| PV, mL | 54.1 (10.8, 35–86) | 59.2 (14.2, 45–120) | 0.04 |
| IPP, mm | 6.5 (4.9, 0–21) | 12.7 (6.3, 0–33.5) | <0.001 |
| DWT, mm | 1.9 (0.5, 1–2.9) | 2.3 (0.4, 1.6–3.2) | 0.001 |
| PSA, ng/mL | 2.97 (1.3, 0.4–8.6) | 3.47 (1.5, 1.2–9.54) | 0.021 |
| PVR, mL | 29.6 (35.1, 0–120) | 454.8 (71.9, 300–560) | <0.001 |
| IPSS | 12.2 (3.6, 6.5–25) | 16.5 (4.2, 10–26) | <0.001 |
| QoL | 3.5 (1.4, 0–6) | 5.2 (0.8, 3–6) | <0.001 |
Table 4.
Distribution of DWT (<2/>2 mm), IPP (<8/>8 mm) and PSA (<2.5/>2.5 ng/mL) between patients with and without AUR.
| Variables | No AUR (85) | AUR (50) | P⁎ | Odds ratio (95% CI) |
|---|---|---|---|---|
| IPP, mm | ||||
| <8 | 47 (55.3) | 10 (20) | <0.001 | 0.324 (0.187–0.625) |
| >8 | 38 (44.7) | 40 (80) | ||
| DWT, mm | ||||
| <2 | 50 (58.8) | 10 (20) | <0.001 | 0.312 (0.171–0.572) |
| >2 | 35 (41.2) | 40 (80) | ||
| PSA, ng/mL | ||||
| <2.5 | 34 (40) | 8 (16) | 0.004 | 0.422 (0.217–0.818) |
| >2.5 | 51 (60) | 42 (84) | ||
| Combined IPP and DWT | ||||
| Negative | 37 (43.5) | 5 (10) | <0.001 | 0.246 (0.105–0.575) |
| Positive | 48 (56.5) | 45 (90) | ||
Fisher’s exact test.
Discussion
BPO is the most frequent pathophysiological process causing LUTS in elderly men. PFS is considered the standard method for diagnosing BOO, although its routine use is questioned and is associated with morbidity as it is an invasive procedure [4]. The urinary flow rate is recommended as a noninvasive test, but it is considered inaccurate for the precise diagnosis of BOO [12] and most patients with BPH present with a higher IPSS, lower Qmax and higher PVR [7].
The IPP, as measured by TAUS, is caused by the enlarging lateral lobes and the median lobe inside the bladder causing BOO by a ball-valve mechanism [9] disrupting the funnelling effect of the bladder neck and causing dyskinetic movement of the bladder during voiding [13]. Hence measuring the IPP gives some idea of the obstruction as a causal relationship. The mean IPP differed significantly between normal men and patients with LUTS, either unobstructed (group 1) or obstructed (group 2). The mean (range) IPP was 3.99 (0–11.6) mm in unobstructed men, 10 (0–21) mm and 12.7 (0–33.5) mm in obstructed men and those who presented with AUR, respectively. In normal men the mean (SD, range) IPP was 2.7 (1.8, 0–8.7) mm (Tables 1 and 3).
The best threshold for IPP was 8 mm, for DWT 2 mm, for PSA 2.5 ng/mL and for PV 45 mL, giving the highest sensitivity and specificity at the same time in the ROC curve.
An IPP of >8 mm was found in 28/35 (80%) of obstructed men and in 10/50 (20%) of those without BOO (P < 0.001, odds ratio 0.202, 95% CI 0.099–0.411). Using the same thresholds in patients who presented with AUR, 40 of the 50 (80%) had an IPP of >8 mm with a significant association, as shown by the odds ratio and 95% CI (Table 4). These results agree with those reported in earlier studies [8–10], where IPP grade III (>10 mm) was found in 76% of obstructed cases, with a PPV of 94% and negative predictive value (NPV) of 74% [9]. IPP grade III was found in 67% of patients who presented with AUR in the study of Tan and Foo [10], and 71% in the study of Lim et al. [8].
In the present study, the AUC of the ROC curve for IPP was 0.885 (95% CI 0.806–0.963) and at a threshold of 8 mm, the sensitivity was 80%, the specificity was 80%, the PPV 73.7%, the NPV 85.1%. The IPP had a positive correlation with the severity of obstruction as defined by the higher BOOI (correlation coefficient 0.595, P < 0.001). A significant correlation was reported by Chia et al. [9], with a PPV of 94% and NPV of 79%. The AUC for IPP was 0.772 in the study of Lim et al. [8]; the AUC for IPP was 0.835 at a threshold of 12 mm. Franco et al. [7] reported a sensitivity of 0.65 and specificity of 0.77, with an 88% PPV, but a higher threshold was used in that study than in the present study.
DWT is a new method to diagnose BOO that is based on the findings of thickened detrusor and increased bladder weight after inducing BOO in experimental animals [14], and that can be visualized and measured with ultrasonography [5,15] using high-frequency ultrasound arrays (⩾□7.5 MHz) and magnification. In the present study the mean DWT in unobstructed patients was 1.7 mm, while it was 2.2 mm in patients with obstruction, and 2.3 mm in patients with AUR. DWT was significantly correlated with BOOI (correlation coefficient 0.422, P < 0.001). These findings agree with those of Oelke et al. [5], who found a mean DWT of 2.4 mm in 33 obstructed patients, and the median DWT was 1.7 mm in a recent study of 75 obstructed patients [6]. Our results for DWT were different from those of Franco et al. [7], in which they reported a mean DWT of 7.1 mm, possibly due to a different method of measurement, as we measured only the hypoechogenic portion of the detrusor wall between the two hyperechogenic lines corresponding to the inner and outer layers of the bladder wall [5].
The AUC of the ROC curve for DWT was 0.783, and at a 2-mm threshold the sensitivity was 65.7% and the specificity 76%. Also, a DWT of >2 mm was significantly associated with 80% of patients with AUR (Table 4). These findings agree with those of Oelke et al. [5] who found an AUC of 0.882. Our results showed that DWT was significantly correlated with BOOI, with a PPV of 65.7% and NPV of 76%. In this study the DWT threshold was similar to that in the study of Oelke et al. [5,6], who were investigating the accuracy of DWT as a noninvasive method to predict BOO. The threshold in the study of Manieri et al. [15] was 5 mm for bladder wall thickness, and in a more recent study [7] it was 6 mm. The AUC for DWT was 0.845, and at a 6-mm threshold Franco et al. [7] reported a sensitivity of 0.73 and specificity 0.82, showing that patients with a DWT of ⩾5 mm had an 88% risk of obstruction on PFS [15]. These findings agree with the results of the present study, despite the different methods used to assess DWT in those studies. US measurement of the detrusor thickness identified as the middle hypoechogenic layer seems to be more appropriate than assessment of the entire bladder wall [16], as in the previously mentioned study [15]. At a threshold of 2 mm Kessler et al. [16] found a sensitivity of 92%, specificity of 68%, PPV of 81% and NPV of 85%, while a smaller threshold of 1.5 mm improved the sensitivity to 100% but reduced the specificity to 41%. Also in the recent study of Oelke et al. [7], at a threshold of 2 mm for DWT, the sensitivity was 83%, specificity 95%, PPV 94% and NPV 86%.
PSA and PV have been extensively studied as predictors of BOO [13,17]. In the present study PSA and PV had significant positive correlations with BOOI. The AUC (95% CI) for PSA was 0.745 (0.638–0.851) and at a 2.5 ng/mL threshold the sensitivity was 74.3%, specificity 50%, PPV 51% and NPV 73.5%. A PSA level of >2.5 ng/mL was significantly associated with 84% of patients with AUR.
The AUC of the ROC for PV was 0.678 (0.562–0.794) and at a threshold of 45 mL the sensitivity was 85.7% and specificity 26%, PPV 48.6% and NPV 72.2%, i.e. PV had a lower specificity for detecting obstruction. These results had some differences from those reported by Lim et al. [8]. In that study, the AUC for PV was 0.637 and the sensitivity was 51%, specificity 38%, PPV 65% and NPV 42%, possibly because of the lower threshold (40 mL) used in that study, where the AUC was 0.703 for PSA, with a sensitivity of 30%, specificity 70%, PPV 68% and NPV 38% at a threshold of 4 ng/mL. At a threshold of 25 mL for PV in another study [6], the sensitivity was 85%, specificity 27%, PPV 51% and NPV 67%, at a lower threshold than in the present study.
In the developing array of noninvasive clinical predictors of BOO and AUR, IPP and DWT compare well with serum PSA level and PV. US measurement of IPP and DWT can be easily obtained with the TAUS in the outpatient setting, with no need for a rectal probe or sophisticated urodynamic study.
In conclusion, this study shows that US measurements of IPP and DWT are accurate noninvasive alternatives to PFS for assessing the presence of BOO due to BPE. The combination of IPP and DWT had a higher sensitivity and specificity at same time, and higher accuracy than when individually measured. The significant association of higher IPP and DWT with an increased risk of AUR suggests that these measures would be promising as noninvasive variables capable of identifying patients at increased risk of AUR.
References
- 1.Roehrborn CG, McConnell JD, editors. Campbell’s Urology, 9th ed. Philadelphia: WB Saunders; 2007: 2727–65
- 2.Abrams P., Cardozo L., Fall M., Griffiths D., Rosier P., Ulmsten U. The standardization of terminology of lower urinary tract function: report from the Standardization Sub-committee of the International Continence Society. Neurourol Urodyn. 2002;21:167–178. doi: 10.1002/nau.10052. [DOI] [PubMed] [Google Scholar]
- 3.Abrams P. Bladder outlet obstruction index, bladder contractility index and bladder voiding efficiency: three simple indices to define bladder voiding function. BJU Int. 1999;84:14–15. doi: 10.1046/j.1464-410x.1999.00121.x. [DOI] [PubMed] [Google Scholar]
- 4.Klingler H.C., Madersbacher S., Djavan B., Schatzl G., Marberger M., Schmidbauer C.P. Morbidity of the evaluation of the lower urinary tract with transurethral multichannel pressure flow studies. J Urol. 1998;159:191–194. doi: 10.1016/s0022-5347(01)64054-0. [DOI] [PubMed] [Google Scholar]
- 5.Oelke M., Höfner K., Wiese B., Grünewald V., Jonas U. Increase in detrusor wall thickness indicates bladder outlet obstruction (BOO) in men. World J Urol. 2002;19:443. doi: 10.1007/s00345-001-0238-z. [DOI] [PubMed] [Google Scholar]
- 6.Oelke M., Höfner K., Jonas U., de la Rosette J.J., Ubbink D.T., Wijkstra H. Diagnostic accuracy of noninvasive tests to evaluate bladder outlet obstruction in men: detrusor wall thickness, uroflowmetry, postvoid residual urine, and prostate volume. Eur Urol. 2007;52:827–835. doi: 10.1016/j.eururo.2006.12.023. [DOI] [PubMed] [Google Scholar]
- 7.Franco G., De Nunzio C., Leonardo C., Tubaro A., Ciccariello M., De Dominicis C. Ultrasound assessment of intravesical prostatic protrusion and detrusor wall thickness-new standards for noninvasive bladder outlet obstruction diagnosis? J Urol. 2010;183:2270–2274. doi: 10.1016/j.juro.2010.02.019. [DOI] [PubMed] [Google Scholar]
- 8.Lim K.B., Ho H., Foo K.T., Wong M.Y., Fook-Chong S. Comparison of intravesical prostatic protrusion, prostate Volume and serum prostatic-specific antigen in the evaluation of bladder outlet obstruction. Int J Urol. 2006;13:1509–1513. doi: 10.1111/j.1442-2042.2006.01611.x. [DOI] [PubMed] [Google Scholar]
- 9.Chia S.J., Heng C.T., Chan S.P., Foo K.T. Correlation of intravesical prostatic protrusion with bladder outlet obstruction. BJU Int. 2003;91:371–374. doi: 10.1046/j.1464-410x.2003.04088.x. [DOI] [PubMed] [Google Scholar]
- 10.Tan Y.H., Foo K.T. Intravesical prostatic protrusion predicts the outcome of a trial without catheter following acute urine retention. J Urol. 2003;170:2339–2341. doi: 10.1097/01.ju.0000095474.86981.00. [DOI] [PubMed] [Google Scholar]
- 11.Griffths D., Hofner K., van Mastrigt R., Rollema H.J., Spangberg A., Gleason D. Standardization of terminology of lower urinary tract function: pressure-flow studies of voiding, urethral resistance and urethral obstruction. International Continence Society Subcommittee on Standardization of Terminology of Pressure-Flow Studies. Neurourol Urodyn. 1997;16:1–8. doi: 10.1002/(sici)1520-6777(1997)16:1<1::aid-nau1>3.0.co;2-i. [DOI] [PubMed] [Google Scholar]
- 12.Abrams P., Chapple C., Khoury S., Roehrborn C., de la Rosette J. International Scientific Committee. Evaluation and treatment of lower urinary tract symptoms in older men. J Urol. 2009;181:1779. doi: 10.1016/j.juro.2008.11.127. [DOI] [PubMed] [Google Scholar]
- 13.Marberger M.J., Andersen J.T., Nickel J.C., Malice M.P., Gabriel M., Pappas F. Prostate volume and serum prostate-specific antigen as predictors of acute urinary retention. Combined experience from three large multinational placebo controlled trials. Eur Urol. 2000;38:563–568. doi: 10.1159/000020356. [DOI] [PubMed] [Google Scholar]
- 14.Levin R.M., Haugaard N., O’Connor L., Buttyan R., Das A., Dixon J.S. Obstructive response of human bladder to BPH vs. rabbit bladder response to partial outlet obstruction: a direct comparison. Neurourol Urodyn. 2000;19:609–629. doi: 10.1002/1520-6777(2000)19:5<609::aid-nau7>3.0.co;2-h. [DOI] [PubMed] [Google Scholar]
- 15.Manieri C., Carter S.S., Romano G., Trucchi A., Valenti M., Tubaro A. The diagnosis of bladder outlet obstruction in men by ultrasound measurement of bladder wall thickness. J Urol. 1998;159:761–765. [PubMed] [Google Scholar]
- 16.Kessler T.M., Gerber R., Burkhard F.C., Studer U.E., Danuser H. Ultrasound assessment of detrusor thickness in men—can it predict bladder outlet obstruction and replace pressure flow study? J Urol. 2006;175:2170–2173. doi: 10.1016/S0022-5347(06)00316-8. [DOI] [PubMed] [Google Scholar]
- 17.Kuo H.C. Clinical prostate score for diagnosis of bladder outlet obstruction by prostate measurements and uroflowmetry. Urology. 1999;54:90–96. doi: 10.1016/s0090-4295(99)00092-8. [DOI] [PubMed] [Google Scholar]