



Abstract
Background
Different races have their own reference ranges of serum prostate-specific antigen (PSA) because of the influence of geographical and ethnic differences. In this study we determined the distribution of serum PSA levels in Iraqi men with no prostate cancer, to our knowledge the first such study from Iraq.
Subjects and methods
From January 2003 to May 2004, in a prospectively designed study, we included 130 Iraqi men aged 20–79 years. The criteria of an elevated PSA level, abnormal ultrasonography results and/or abnormal findings on a digital rectal examination were used to exclude patients from the study. Ethnicity was not recorded, as Iraq has a multi-ethnic status. The results were analysed using descriptive statistics, statistical tables, the arithmetic mean, standard error, standard deviation, and by two extremes.
Results
The PSA values in different age groups (20–29, 30–39, 40–49, 50–59 and 60–79) were, respectively, ⩾0.55 to ⩽1.3, ⩽1.6, ⩽2.0, ⩽4.6 and ⩽4.8 ng/mL. There was a significant increase between the third and fourth group, and all these results were significant at P < 0.001, with the last being more significant.
Conclusion
Serum PSA measurements should be standardized according to country and ethnic groups. Our result of a PSA maximum at 4.8 ng/mL is slightly more than the international standard threshold of 4.0 ng/mL.
Abbreviations: TAUS, transabdominal ultrasonography; ROC, receiver operating characteristic
Keywords: Age, Prostate-specific antigen, Prostate cancer, Iraqis
Introduction
There have been major changes in the understanding of PSA over the past two decades. PSA was first detected in prostatic tissue in 1970 by Ablin [1], but he recently expressed his forthright view, referring to the annual bill for PSA screening in the USA, which is at least $3 billion, that the test is ‘hardly more effective than a coin toss’ [2]. Wang et al. in 1979 produced a report on human PSA, suggesting that it has proved to be an important marker of prostate pathology [3].
Serum PSA estimation is a useful tool to detect prostate cancer when values are >10 ng/mL. Prostate volume, as an independent entity, is not significant for the diagnosis of prostate diseases. When PSA density is used, it has a high sensitivity (96.55%) for the diagnosis of prostate cancer [4]. Age-specific reference ranges for PSA were first presented from a community-based population of 471 healthy American white men by Oesterling et al. [5] There is increasing concern over the general applicability of those reference ranges. Different races have their own reference ranges because of the influence of geographical and ethnic differences [6]. In the present study we assessed the distribution of serum PSA levels in Iraqi men with no prostate cancer, and to our knowledge this is the first such study from Iraq.
Subjects and methods
From January 2003 to May 2004, we conducted a prospectively designed study of 130 healthy Iraqi men aged 20–79 years. They attended the urology clinic for various urinary complaints and had undergone a general physical examination, DRE, transabdominal ultrasonography (TAUS), and PSA estimation. The criteria of an elevated PSA level, abnormal TAUS and/or abnormal DRE findings, including irregularity, induration, increase in size, change in consistency and presence of nodulation, were used to exclude patients from the study. PSA was estimated by analysing samples at the Central Ministry of Health Laboratory or accredited private laboratories, and by the same method. Ethnicity was not recorded, as Iraq has a multi-ethnic status. The diagnosis of BPH or prostatitis was made in accordance with clinical and laboratory data, and not by prostate biopsy.
The results were assessed statistically using descriptive statistics, statistical tables, arithmetic mean, SEM, SD, and by the two extremes. Inferential statistics were used to accept or reject the statistical hypotheses and to evaluate the extremes of PSA among different age groups: they included; the 95% CI of the mean; homogeneity of variance for testing the assumption of equal variances among different age groups and for comparing different races, including our sample, by the Levene test; Anova for testing the coincidence of the variables among different age groups; the least significant difference, used after Anova to assess the significant levels between all multiple comparisons; maximum likelihood methods (Huber, Tukey, Hampell and Andrews) used to distinguish the variation in different age groups; leaf plots for identifying extreme values of PSA in different age groups; receiver operating characteristic (ROC) curves used to describe increases in PSA among age groups. Multiple linear regression models were used for two purposes; as a case study for identifying the nature of the progression, and for creating a predictive equation for PSA at any age in healthy men.
Results
The 130 patients were divided into five age groups (20–29, 30–39, 40–49, 50–59 and 60–79 years), containing 25, 25, 25, 30 and 25 men, respectively. This sample size was considered sufficient because of high homogeneity in the original data and the testing of goodness of fit of the assumption of a normal distribution. The sample size was dictated by the number of patients who attended during the given period. The goal was to show that the outcome was supported by various statistical methods to identify the sample’s ability to represent an individual. Being a tertiary centre we received patients referred from all over the country, with all ethnic groups representing the Iraqi population. Groups 4 and 5 were not biopsied. Table 1 shows the statistical methods for each group. The homogeneity of variance was estimated according to Levene’s test, and was 8.97 (P < 0.001), supporting that the variances are unequal. For mean values of different age groups Anova showed highly significant differences at P < 0.001 between at least two age groups for PSA values. The statistical methods for each group showed that the mean, SD, SEM, 95% CI of the mean, and minimum and maximum values were distributed according to different age groups. The PSA increased with increasing age, with the greatest interval between groups 4 and 5.
Table 1.
Descriptive statistical analysis of the sample.
| Age group | N | Mean | SD | SEM | 95% CI | Range |
|---|---|---|---|---|---|---|
| 1 | 25 | 0.962 | 0.193 | 0.004 | 0.882–1.042 | 0.55–10.5 |
| 2 | 25 | 0.984 | 0.203 | 0.004 | 0.900–1.068 | 0.55–1.60 |
| 3 | 25 | 1.193 | 0.304 | 0.006 | 1.068–1.319 | 0.79–2.00 |
| 4 | 30 | 1.570 | 0.772 | 0.141 | 1.282–1.858 | 0.55–4.60 |
| 5 | 25 | 1.795 | 0.945 | 0.189 | 1.405–2.185 | 0.49–4.80 |
| Total | 130 | 1.311 | 0.663 | 0.006 | 1.196–1.426 | 0.49–4.80 |
Table 2 shows that groups 1–3 had similar values of PSA level and could be considered as one group, as was so for groups 4 and 5; these two new groups had marked differences between them.
Table 2.
Insignificant groups, with P values.
| Group | N | Subset for alpha = 0.05 |
|
|---|---|---|---|
| 1 | 2 | ||
| Duncana,b | |||
| 1 | 25 | 0.962 | |
| 2 | 25 | 0.984 | |
| 3 | 25 | 1.193 | |
| 4 | 30 | 1.570 | |
| 5 | 25 | 1.795 | |
| Significance | 0.182 | 0.166 | |
Values are means for groups in homogeneous subsets.
Uses harmonic mean sample size = 25.862.
The group sizes are unequal; harmonic mean of the group sizes used. Type I error levels are not guaranteed.
Fig. 1 shows the effect of age on PSA values; there was a general increase in PSA level proportional to age. The increase was slight in groups 1–3 but significant between 3 and 4 then finally slight in groups 4 and 5, supporting the previous findings.
Figure 1.

Increment in PSA with age.
Table 3 shows different methods of maximum likelihood estimates, showing similar findings to those in the present study.
Table 3.
Maximum likelihood estimators.
| PSA group | Huber M estimatora | Tukey biweightb | Hampel M estimatorc | Andrewsd |
|---|---|---|---|---|
| 1 | 0.922 | 0.901 | 0.914 | 0.901 |
| 2 | 0.953 | 0.950 | 0.957 | 0.951 |
| 3 | 1.163 | 1.158 | 1.167 | 1.158 |
| 4 | 1.436 | 1.392 | 1.423 | 1.392 |
| 5 | 1.644 | 1.588 | 1.640 | 1.589 |
The weighting constant is: a1.339, b4.685, c1.700, 3.400, and 8.500 and d0.340 × π.
The extreme values for groups 1–5 were, respectively, ⩾0.55 to ⩽1.3, ⩽1.6, ⩽2.0, ⩽4.6, and ⩽4.8. Plotting by stem-and-leaf methods after removing the extreme outliers of PSA in different age groups showed the mean, upper and lower bound of the mean, and the upper and lower bounds of the extremes of PSA in each group, as shown in Fig. 2. Fig. 3 shows that the area of PSA increase is positive for all age groups. In addition to testing the hypothesis of significance, the PSA increase among different age groups is also very significant (P < 0.001).
Figure 2.

Changes in PSA related to each age group shows the mean, upper and lower bound of the mean and upper and lower bound of extremes of PSA.
Figure 3.
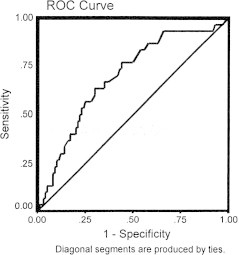
Receiver operating curve.
As an initial method for linear regression analysis we used Pearson correlation, which was highly significant (P < 0.001) for increasing age vs. increasing PSA level. These results allowed the use of linear regression analysis between age groups as an independent variable, by PSA indicator as the dependent variable, shown graphically in Fig. 4. There was a highly positive correlation between the variables. The 95% mean prediction intervals (inner and outer lines) show that most points fall inside the interval, except four PSA values in the oldest groups. The prediction linear regression equation is PSA = 0.37 + 0.02 × age (ordinary least-square method). Fig. 4 shows the correlation between age and PSA level by long-term trend.
Figure 4.
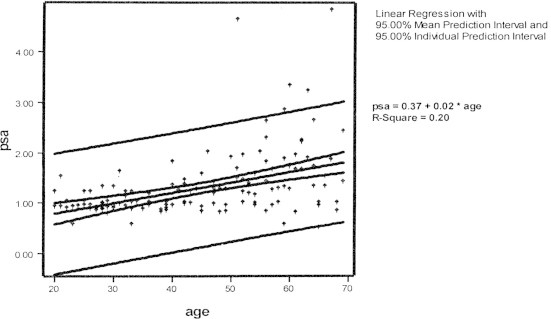
Correlation between age and PSA by long-term trend.
Comparing the homogeneity of variances of Iraqis vs all groups, all countries in general also record a0. highly significant relationship (P < 0.001), supporting the comparison of Iraqis with the countries independently. As for the homogeneity of the variance estimate of PSA by different age groups of Iraqis, it was higher than for Koreans (giving highly significant differences at P < 0.001), This was followed by Iraqis vs. Chinese, the Iraqis vs blacks; the last was not significant, P > 0.05). Comparing Iraqis and white Americans the difference was significant (P < 0.05), as was the Iraqis vs. Japanese (P < 0.05). Accordingly the Iraqi PSA values for different age groups differ significantly from those of Korean, Chinese, and Japanese men, which were higher (P < 0.05).
The results are similar when Iraqis are compared with white Americans, but Iraqis might have similar results to some extent with those of black Americans, and those reported by Oesterling et al. [5].
Discussion
To our knowledge, this is the first such study from Iraq. Different age groups had PSA levels related to age, increasing with increasing age. There was a clear increase in PSA level between the third and fourth groups, suggesting a significant change in the PSA level after the age of 50 years, depending on the size of prostate and other factors like hormones.
The assumption of a normal distribution in PSA values to construct the ROC curve indicates that PSA is related proportionally and positively with age, and confirmed the area with clear increase in PSA value.
These results can be explained by the conclusions of others [7], who suggested that continuous growth of the prostate ‘which means increment in size’ occurs until puberty, and is then maintained at this size until the fourth decade. Then the prostate starts to grow again, possible due to BPH. As the increase in prostate size with age produces more PSA, the PSA level increases with age. Our result of a PSA ‘threshold’ at 4.8 ng/mL is slightly higher than the standard threshold of 4.0 ng/mL.
Comparing PSA levels in Iraqis with Korean, Japanese, and Chinese men, they were lower in the others for all age groups. This could be due to smaller prostates and to geographical variation, leading to racial variation [8].
The prostate cancer rate in Japanese–American men in the USA is four to six times higher than in Japanese men in Japan. This again supports a role for environmental risk factors in the cause of the disease, in addition to prostate size [5].
Interestingly, PSA levels in Iraqi men differed significantly from those in white Americans [9] but not from black Americans [8]. This might be because the Iraqi population was not divided according to race. This requires further studies in Iraq taking race into consideration. Our results show no variation with those of Cupp and Oesterling [10]. This again might be due to different races in the Iraqi population.
We also estimated the normal PSA value in young men, as a baseline value for using PSA as a future screening test for other diseases, such as prostatitis or other pathologies, in the same population of patients. Depending on regression analysis, our study confirms the previous findings of increasing PSA with age. The calculated equation for PSA in any age is 0.37 + 0.02 × age.
Comparing our data with other studies, PSA values at any age were higher than in Chinese, Korean, and Japanese men; racial and geographical differences might play a role [5,8].
PSA levels in Iraqi men were higher than in white Americans, contrary to that of black Americans, which were equivocal to some extent [8,11]. Further studies of Iraqi population according to their race are needed. Finally comparing our data with those of Oesterling et al. [5], they show equivocal results.
A limitation of the present study is that it was not community-based, but patients were from a urology clinic and had diverse symptoms [11].
Because of the log-normal distribution of PSA concentrations, they were log-transformed in the analyses. Other studies [9] used the observed fifth, 25th, 50th (median), 75th, and 95th percentiles, calculated on the basis of the empirical distribution of the data in each age group. A multivariate regression model in which the log-transformed PSA concentration was plotted against age and race was used to determine whether the PSA concentrations differed significantly according to race when we controlled for age. ROC curves in which the value for sensitivity was plotted against the false positive rate (1 – specificity) were generated for the white and black cohorts. The area under the ROC curve was estimated according to the method of Hanley and McNeil [12,13].
The study was limited because it was retrospective and from one tertiary-care centre. The same factors (sociodemographic, education, healthcare practices) are at work in all populations. Our work was published not on time because of the country circumstances. It took us a long period to retrieve indispensable records.
Recent tests under development, such as urinary Engrailed-2, which is a highly specific and sensitive biomarker for prostate cancer, will require a large multicentre study to further evaluate the diagnostic potential and assess if this or other tests could substitute for PSA [14].
In conclusion, serum PSA results need to be standardized according to countries and ethnic groups. The final advantage will be increasing precision in the diagnosis of prostatic carcinoma in a given region.
Conflict of Interest
The authors have no conflict of interest to declare.
References
- 1.Ablin RJ. The great prostate mistake. The New York Times; March 9, 2010. http://www.nytimes.com/2010/03/10/opinion/10Ablin.html.
- 2.Wang T.J., Valenzuela L.A., Murphy G.P., Chu T.M. Purification of a human prostate specific antigen. Invest Urol. 1979;17:159–163. [PubMed] [Google Scholar]
- 3.McConnell JD, Barry MJ, Bruskewitz RC. Clinical Practice Guideline Number 8: Benign Prostatic Hyperplasia. Diagnosis and Treatment. Rockville, MD: US Department of Health and Human Services, Agency for Health Care Policy and Research. AHCPR Publication 94, 1994: 0582. [PubMed]
- 4.Oesterling J.E., Jacobsen S.J., Chute C.G., Guess H.A., Girman C.J., Panser L.A. Serum prostate-specific antigen in a community-based population of healthy men. Establishment of age-specific reference ranges. JAMA. 1993;270:860–864. [PubMed] [Google Scholar]
- 5.Oesterling J.E., Kumamoto Y., Tsukamoto T., Girman C.J., Guess H.A., Masumori N. Serum prostate-specific antigen in a community-based population of healthy Japanese men: lower values than for similarly aged white men. Br J Urol. 1995;75:347–353. doi: 10.1111/j.1464-410x.1995.tb07347.x. [DOI] [PubMed] [Google Scholar]
- 6.Berry S.J., Coffey D.S., Walsh P.C., Ewing L.L. The development of human benign prostatic hyperplasia with age. J Urol. 1984;132:474. doi: 10.1016/s0022-5347(17)49698-4. [DOI] [PubMed] [Google Scholar]
- 7.Ku J.H., Ahn J.O., Lee C.H., Lee N.K., Park Y.H., Byun S.S. Distribution of serum prostate-specific antigen in healthy Korean men: influence of ethnicity. Urology. 2002;60:475–479. doi: 10.1016/s0090-4295(02)01807-1. [DOI] [PubMed] [Google Scholar]
- 8.Preston D.M., Levin L.I., Jacobson D.J., Jacobsen S.J., Rubertone M., Holmes E. PSA levels in young white and black men 20–45 years old. Urology. 2000;56:812–816. doi: 10.1016/s0090-4295(00)00764-0. [DOI] [PubMed] [Google Scholar]
- 9.Morgan T.O., Jacobsen S.J., McCarthy W.F., Jacobson D.J., McLeod D.G., Moul J.W. Age-specific reference ranges for serum prostate-specific antigen in black men. N Engl J Med. 1996;335:304–310. doi: 10.1056/NEJM199608013350502. [DOI] [PubMed] [Google Scholar]
- 10.Cupp M.R., Oesterling J.E. Prostate-specific antigen, digital rectal examination, and transrectal ultrasonography: their roles in diagnosing early prostate cancer. Mayo Clin Proc. 1993;68:297–306. doi: 10.1016/s0025-6196(12)60052-4. [DOI] [PubMed] [Google Scholar]
- 11.Chalabi S.N.M., Al Jumaily T., Rifat U.N. Prostate specific antigen density and age specific prostate specific antigen reference ranges in detection of prostate cancer in patients with prostatic obstruction. Arab J Urol. 2003;1:35–39. [Google Scholar]
- 12.Lin K.J., Pang S.T., Chang Y.H., Wu C.T., Chuang K.L., Chuang H.C. Age-related reference levels of serum prostate-specific antigen among Taiwanese men without clinical evidence of prostate cancer. Chang Gung Med J. 2010;33:182–187. [PubMed] [Google Scholar]
- 13.Potts J.M., Lutz M., Walker E., Modlin C., Klein E. Trends in PSA, age and prostate cancer detection among black and white men from 1990–2006 at a tertiary care center. Cancer. 2010;116:3910–3915. doi: 10.1002/cncr.25124. [DOI] [PubMed] [Google Scholar]
- 14.Morgan R., Boxall A., Bhatt A., Bailey M., Hindley R., Langley S. Engrailed-2 (EN2). A tumor-specific urinary biomarker for the early diagnosis of prostate cancer. Clin Cancer Res. 2011;17:1090–1098. doi: 10.1158/1078-0432.CCR-10-2410. [DOI] [PubMed] [Google Scholar]