

Abstract
The potential of ethosomes for delivering ketoprofen via skin was evaluated. The ethosomes were prepared, optimized and characterized. Vesicular shape, size and entrapment efficiency were determined by transmission electron microscopy, dynamic light scattering and minicolumn centrifugation technique, respectively. Vesicle sizes varied from 120.3±6.1 to 410.2±21.8 nm depending on the concentrations of soya phosphatidyl choline (SPC) and ethanol. Entrapment efficiency increased with concentrations of SPC and ethanol. The formulations exhibited entrapment efficiencies of 42–78%. In vitro release through cellophane membrane showed sustained release of drug from ethosomal formulations in contrast to hydroalcoholic drug solution (HA), which released most of the drug within 2–3 h. In vitro drug permeation across human skin revealed improved drug permeation and higher transdermal flux with ethosomal formulations compared to hydroethanolic drug solution. Kinetics of in vitro skin permeation showed zero order drug release from formulations. Based on in vitro transdermal flux, the estimated steady state in vivo plasma concentration from ethosomes attained therapeutic drug levels whereas hydroalcoholic drug solution exhibited sub therapeutic drug concentration with a patch size of 50 cm2. Skin permeation of ethosomal formulations assessed by confocal microscopy revealed enhanced permeation of Rhodamine 123 loaded formulation in comparison to the hydroalcoholic solution.
Keywords: Ethosomes, Ketoprofen, In vitro skin permeation, Confocal microscopy, Transdermal delivery
1. Introduction
The need of transdermal drug delivery is felt on the shortcomings of other existing drug delivery systems. Transdermal drug delivery is a noninvasive technique and can be exploited to circumvent the variables, which could influence the oral absorption of drugs such as pH, food intake and gastrointestinal motility [2,22,30]. The greatest challenge with transdermal drug delivery is the barrier nature of skin that restricts the entry of most of the drugs [5,24]. Several physical and chemical techniques have been tried and tested to overcome the barrier of stratum corneum to achieve higher transdermal permeability. These techniques include iontophoresis, sonophoresis, use of microneedles, chemicals, surfactants and lipid based systems [18,20,21,23,28,31]. Lipid based systems offer excellent candidature for transdermal delivery due to their biocompatibility and ease of mixing with the skin lipids. There has been considerable interest on the use of liposomes for transdermal drug delivery [11,19,29]. However conventional liposomes do not offer much value as they cannot penetrate into deeper layers of skin, but rather confined to the upper layer stratum corneum [13]. Continuous research with lipid based system has resulted in the introduction of two novel carriers, transfersomes and ethosomes. Transfersomes are deformable lipid vesicles consisting of phospholipids and an edge activator which is often a single chain surfactant molecule [6]. Ethosomes are an interesting lipid based carrier first reported by Touitou et al. [34,35]. Basically ethosomes exhibit lipid bilayers like liposomes; however they differ with liposomes in terms of composition. Liposomes are composed of phosphatidyl choline and cholesterol whereas ethosomes contain high concentration of ethanol in place of cholesterol. Ethosomes are prepared by either conventional thin film hydration method or by addition of aqueous phase in a controlled manner to the alcoholic solution of phosphatidyl choline. The size of ethosomes varies from few nanometers to micrometers depending on method of preparation and application of techniques like sonication. The value of ethosomes lies in its capability to increase the transdermal permeability of entrapped entity in comparison to liposomes or solution of drug in mixture of ethanol and water [10,16,35]. With ethosomes, the synergistic effect of combination of phospholipid and higher concentration of alcohol is suggested to be responsible for deeper penetration of entrapped drug(s) through skin with consequent high transdermal flux in comparison to liposomes. The efficacy of ethosomes in increasing transdermal permeability of entrapped drug is comparable to that of transfersome; however, Elsayed et al. [12] have reported superiority of ethosomal formulation in increasing the transdermal permeability of entrapped ketotifen in comparison to transfersomes.
The aim of the present investigation is to assess the applicability of ethosomes in delivering ketoprofen through the skin. We hypothesize that similar to ketotifen, ethosomes may be a suitable vehicle to ketoprofen as well. Ketoprofen is a non steroidal anti-inflammatory drug and is a good candidate for transdermal delivery owing to problems in delivery by other routes. Attempts have been made to develop suitable system for improved transdermal delivery of ketoprofen despite several topical gels/patches already available in the market [6,7,32]. However transdermal delivery of ketoprofen is always challenged by its poor transdermal permeability [27]. In the present work we entrapped ketoprofen in the lipid bilayers of ethosomes and evaluated the in vitro transdermal permeation and penetration characteristics through skin. Fig. 1 shows the schematic representation of proposed entrapment of ketoprofen inside hydrophobic core of lipid bilayers of phophatidyl choline. Ketoprofen being a hydrophobic drug is expected to partition itself in the hydrophobic region of ethosomes vesicles formed from amphipathic lipid phosphatidyl choline.
Fig. 1.
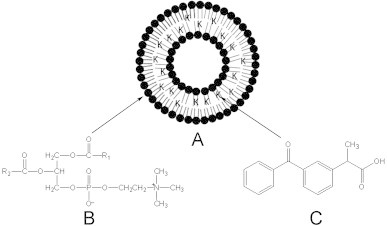
Entrapment of ketoprofen (C) in lipid bilayers of phosphatidyl choline (B). Figure represents distribution of ketoprofen molecules (denoted by K) in hydrophobic region of model lipid vesicular carrier (A).
2. Materials and methods
2.1. Materials
Skin samples of an adult female were obtained, with patient consent and ethics approval, after abdominal reduction surgery. This study was approved by the Institutional Review Board (IRB) of Singapore General Hospital, Republic of Singapore (IRB Reference Number 196/2006). This IRB operates in accordance with the International Conference on Harmonization/Singapore Guideline for Good Clinical Practices, and with the applicable regulatory requirements.
Soya phosphatidyl choline (S-75) was a gift from Lipoid (Germany). Ketoprofen, antimycotic solution and Rhodamine 123 were obtained from SIGMA-Aldrich (Germany). All other reagents used were at least of reagent grade and used as such without further purification. Water purified by Milli Q system was used for experiments.
2.2. Preparation of the vesicular system
Ethosomal vesicles were prepared by the method reported elsewhere with some modifications [9]. SPC was dissolved along with the drug in ethanol in a glass bottle. The bottle was sealed and connected to a syringe pump with Teflon tubing. The solution was stirred using a magnetic stirrer at 1500 rpm and Milli Q water was added at a constant rate of 1 ml/min at room temperature through a syringe pump. After addition of water stirring was continued for additional 30 min. The optimization of formulations was carried out by varying SPC and alcohol concentration from 1–3% and 20–40%, respectively. The composition of various formulations is reported in Table 1.
Table 1.
Composition and permeation parameters of various formulations across human skin after 24 h.
| Formulations | Composition (%) |
Transdermal flux (μg/cm2/h) | Diffusional release exponent | Enhancement ratio | Pss (μg/ml) | |
|---|---|---|---|---|---|---|
| SPC | Alcohol | |||||
| E1 | 1 | 20 | 173.6±22.7 | 1.06 | 1.83 | 1.27±0.16 |
| E2 | 1 | 30 | 190.4±24.3 | 1.06 | 1.54 | 1.4±0.17 |
| E3 | 1 | 40 | 207.1±23.3 | 1.05 | 2.18 | 1.52±0.17 |
| E4 | 2 | 20 | 165.7±19.0 | 1.03 | 1.75 | 1.21±0.13 |
| E5 | 2 | 30 | 185.8±25.8 | 1.03 | 1.96 | 1.36±0.19 |
| E6 | 2 | 40 | 194.4±20.1 | 1.01 | 2.05 | 1.43±0.14 |
| E7 | 3 | 20 | 181.7±17.1 | 1.03 | 1.92 | 1.33±0.12 |
| E8 | 3 | 30 | 184.4±21.0 | 1.01 | 1.94 | 1.35±0.15 |
| E9 | 3 | 40 | 192.5±24.8 | 1.00 | 2.03 | 1.41±0.18 |
| HA | – | – | 94.6±10.3 | – | – | 0.69±0.07 |
2.3. Characterization of formulations
2.3.1. Size analysis of vesicular systems
The mean size of ethosomal colloidal suspension was analyzed by dynamic light scattering technique with a Zetasizer 3000 HSA (Malvern Instruments, Malvern, UK). The sample was placed in quartz cuvette and size measurements were carried out at a scattering angle of 90°. All observations were recorded in triplicate for each formulation.
2.3.2. Vesicle shape
Shape and morphology of the ethosome vesicles were investigated using transmission electron microscopy. Formulation diluted with water was adsorbed onto a grid with carbon-coated formvar film that was attached to a metal specimen grid. Excess sample was blotted off and the grid was covered with a small drop of staining solution (2% w/v uranyl acetate). It was left on the grid for few minutes and excess solution was drained off. The grid was allowed to dry thoroughly in air and sample was examined in the transmission electron microscope (JEOL, JEM 2010F).
2.3.3. Measurement of entrapment efficiency
For determination of entrapment efficiency the vesicles were separated from the unentrapped or free drug by Sephadex G-25 minicolumn centrifugation method. For preparation of minicolumn, Sephadex G-25 (2 g) was suspended in 100 ml saline and was kept overnight. Subsequently supernatant was decanted and the swollen gel was poured in 1 ml syringe and centrifuged to get packed column free from saline. Formulation was placed on the top of Sephadex column, and the formulation free from unentrapped drug was collected from the bottom. Separated formulation was lysed using 10% v/v Triton X-100 and drug content was determined using HPLC method. The Sephadex column was covered to minimize the evaporation of ethanol from the hydroalcoholic ethosomal formulation. However, there is no influence of this small change in the composition of formulation on drug entrapment efficiency. Actually the total amount of drug entrapped in the vesicles would not change as the formulation elutes through the column.
2.4. In vitro drug release through cellophane membrane
For the experiment, formulation (1 ml) was placed in the cellophane membrane dialysis tubing (molecular weight cut off 12,000, Himedia Labs, India), both the ends of which were sealed and suspended in a beaker having 100 ml PBS pH 7.4 at 37±1 °C [14]. The buffer in the beaker was stirred with a glass rod at 45 min interval and samples were collected at 2, 4, 6, 8, 10, 12, 18 and 24 h time intervals, replaced with equal quantity of fresh buffer and analyzed for the amount of drug released using HPLC. Various ethosomal formulations were evaluated for drug release and for comparison, hydroalcoholic drug solution was also included.
2.5. In vitro permeation of drug through skin
In vitro permeation was determined using flow through diffusion cell system consisting of 16 channel peristaltic cassette pump (Ismatech, Switzerland), a circulating water bath (Hakke, Germany), a fraction collector (ISCO Retriever IV, US) and flow through diffusion cells, similar to the setup we reported earlier [20]. Adult Chinese female skin was used for the experiment. For the preparation of the epidermis for experiment, skin along with epidermis was immersed in water at 60 °C for 2 min and epidermis was carefully peeled off and stored at −80 °C until use. Prior to experiments, skin was thawed and hydrated with saline solution containing 1% v/v antibiotic antimycotic solution. Epidermis was mounted between the donor and receptor compartments of flow through cells and excess part of the skin was trimmed off. Phosphate buffer solution containing 1% v/v antimycotic solution was filled in the reservoir bottle. Receptor solution was thoroughly degassed to prevent the formation of bubbles beneath the epidermis. Formulation (1 ml) was placed in the donor compartment and covered with parafilm to prevent contamination and evaporation. Ambient temperature of the cells was maintained at 37 °C by circulating water bath. The receptor solution was pumped by peristaltic cassette pump continuously through the receptor compartment and drained into sample collection test tubes located in the fraction collector. Samples were collected at various time intervals and analyzed for amount of ketoprofen using HPLC. The graph was plotted between cumulative amount of drug permeated versus time and with the slope of graph transdermal flux (J) was calculated. Steady state drug plasma concentration (Pss) in vivo through the skin can be predicted using the following equation, if the drug were in a patch with area (Ta) of 50 cm2 [1]:
where Clp is the plasma clearance of drug, which is 6.8 L/h for ketoprofen.
2.6. Confocal laser scanning microscopy
In order to check the penetration of ethosomes through skin, confocal laser scanning microscopy was performed. For imaging purpose, formulations were loaded with fluorescent probe Rhodamine 123 instead of ketoprofen. Skin sample was mounted between the donor and receiver compartment of flow through cell and excess portion was trimmed off. One ml of either formulation or hydroalcoholic probe solution was placed in the donor compartment and covered with parafilm to prevent contamination and evaporation. Temperature of the cells was maintained at 37 °C. Skin was removed after four hours and excess formulation on its surface was washed with water and skin samples were optically scanned at different increments through the Z-axis of a confocal laser scanning microscope (Nikon A1R).
2.7. Analysis of ketoprofen
Quantitative analysis of ketoprofen was performed by high performance liquid chromatography system (LC 2010A, Shimadzu) consisting of a pump, an automatic injector and an ultraviolet detector. The stationary phase used in the analysis was C18 column (Agilent, 5 μm, 4.0×250 mm) and mobile phase was a mixture of phosphate buffer pH 3.5 and acetonitrile in the ratio of 50:50. Sample (10 μl) was injected at the flow rate of 1 ml/min and detected at a wavelength of 254 nm. Indomethacin was used as an internal standard. The concentration of ketoprofen plotted against ketoprofen to indomethacin peak area ratio was found to be liner.
2.8. Statistical analysis
Statistical analysis of the experimental results was performed by ANOVA. Differences were considered statistically significant at p<0.05. All the data values are represented as mean±standard deviation of 3 measurements. Moreover, the in vitro dissolution data were also compared using a model independent analysis involving determination of similarity factor f2, which is a measure of similarity in two drug release profiles. The following formulation has been used to calculate the similarity factor [17]:
where n is number of sample points, Rt and Tt are percentage drug release at time t from the reference and test products, respectively.
3. Results and discussion
3.1. Preparation of the vesicular system
Ethosomes are a vesicular system with hydrated bilayers. The preparation method involved addition of water at a controlled rate in the alcoholic solution of lipid and drug. Alcohol is an essential component of the ethosomal system which is believed to be responsible for increased transdermal permeability. To minimize evaporation of alcohol during preparation of ethosomes, the glass bottle containing alcoholic solution of lipid and drug was sealed and water was added through Teflon tubing connected to a syringe. Once prepared, formulations were stored in tightly closed containers to further reduce the chances of evaporation of ethanol. Optimization of formulations was done by varying the two process parameters i.e. amount of SPC and alcohol. Amount of SPC was varied from 1% to 3% whereas alcohol concentration was varied from 20% to 40%. Different formulations with varying concentrations of SPC and alcohol were characterized for appropriate physicochemical attributes.
3.2. Characterization of formulations
It is seen from TEM photomicrograph that ethosomal vesicles are unilamellar in nature with near spherical shape (Fig. 2 inset). In contrast to the liposome vesicles that exhibit spherical shapes, ethosomal vesicles are showing some deviation in terms of shape, which could be due to absence of cholesterol and presence of ethanol that imparts some level of fluidity to the bilayer membrane.
Fig. 2.
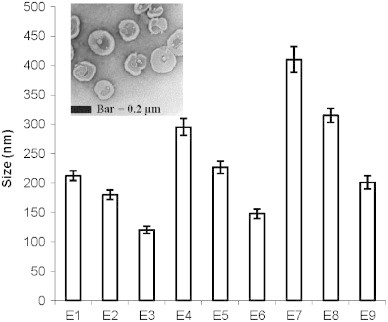
Average vesicle size of various formulations. Values represent mean±SD (n=3). Inset figure shows transmission electron photomicrograph of ethosomes. E1, E2, E3, …, E9 represent the formulations.
Vesicle size plays an important role in the overall performance of transdermal drug delivery system. Size analysis of the formulations showed that minimum vesicle size was observed to be 120.3±6.1 nm whereas maximum was 410.2±21.8 nm depending on the concentration of SPC and ethanol (Fig. 2). A surface plot was prepared to check the effect of both ethanol concentration and SPC concentration together on vesicle size. A zone of lowest vesicle size having a size range from 100–143 nm is clearly seen in Fig. 3. This particular zone is formed with formulations having 1–2% of SPC and 35–40% of alcohol. However the lowest size is obtained with 1% of SPC and 40% of alcohol. A zone with the highest size range of 362.5–406.3 nm is formed with 2.5–3% of SPC and 20–25% of alcohol. The size of the vesicles was found to be increased with increasing concentrations of SPC from 1–3% whereas concentration of alcohol affected the vesicle size in the opposite way i.e. higher concentrations of alcohol produced lower vesicle size. It has been reported that high concentration of ethanol confers a surface negative net charge to the vesicular systems by manipulating some surface characteristics, which causes the size of vesicles to decrease [13]. When the amount of SPC was kept at 1% and the concentration of ethanol was increased from 20% to 40%, the size of the vesicles decreased from 212.4±8.3 to 120.3±6.1 nm (Fig. 2). Similarly when the amount of SPC was kept at 2% and 3% and the ethanol concentration was increased in the same manner the vesicle size was decreased from 295.1±14.2 to 147.8±8.3 nm and 410.2±21.8 to 201.2±11.2 nm, respectively (Fig. 2).
Fig. 3.
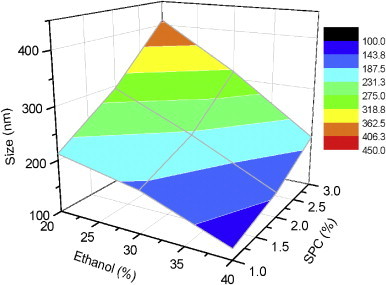
Three dimensional surface plot showing effect of ethanol and SPC on average vesicle size of various formulations.
Encapsulation efficiency is the fraction of total drug entrapped in the ethosomal system. It is an important parameter to evaluate as it determines drug holding capacity and ultimately the delivery potential of dosage form. Zones of different entrapment efficiencies with reference to the concentrations of SPC and ethanol can be identified from the three dimensional surface plot (Fig. 4). Both the amount of SPC and ethanol influenced the entrapment of ketoprofen inside lipid vesicles in a positive way. A zone with entrapment efficiency of 75–80% is formed with formulations comprising of 30–40% alcohol and 2.5–3% SPC whereas in terms of lower efficiency, it is formed with compositions of 20–25% alcohol and 1–2% SPC. Higher entrapment efficiency with increased amount of SPC is on expected line. Hydrophilic drugs are entrapped in the aqueous core inside lipid carrier while lipophilic drugs are retained in the nonpolar chain. Encapsulation of hydrophilic drug depends on captured volume i.e. volume of water encapsulated per mole lipid whereas entrapment of lipophilic drug depends on bilayers present in the system. Being a hydrophobic drug ketoprofen is expected to entrap in the nonpolar lipid bilayers and as the amount of SPC increased in formulation the number of bilayers and drug holding capacity would increase. Entrapment efficiency of the formulation composed of 1% SPC and 20% alcohol (E1) was found to be 42.9±3.7%, which increased to 63.1±5.8% when the amount of SPC was increased to 3% keeping the concentration of alcohol unchanged at 20% (E7) (Fig. 5). Entrapment efficiency of the formulations was observed to increase with increasing alcohol concentrations. Ethosomal formulation fabricated with 3% SPC and 20% alcohol (E7) exhibited 63.1±5.8% entrapment efficiency, which was increased to 73.7±2.9% and 78.7±4.9% when the concentration of alcohol was increased to 30% and 40%, respectively, keeping the amount of SPC unchanged at 3%. Higher entrapment efficiency with increased amount of ethanol is possibly due to increased solubility of drug in ethanol present in the ethosomal core (Fig. 5).
Fig. 4.
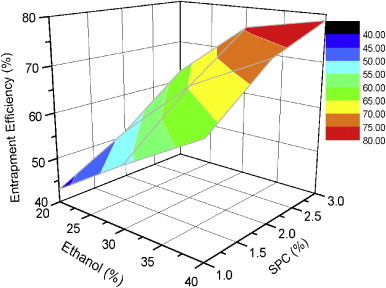
Three dimensional surface plot showing effect of ethanol and SPC on entrapment efficiency of various formulations.
Fig. 5.
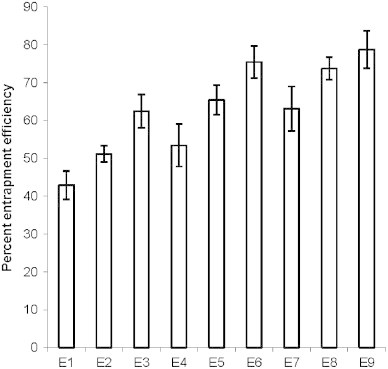
Percent entrapment efficiency of various ethosomal formulations. Values represent mean±SD (n=3). E1, E2, E3, …, E9 represent formulations.
3.3. In vitro drug release through cellophane membrane
Cellophane membrane with molecular weight cut off around 12,000 was used for the experiments that retains lipid vesicle and only permits transfer of drug in solution form. The diffusion of entrapped drug molecules form the vesicular system is governed by transfer of drug from vesicles to the surrounding aqueous medium and then diffusion through the cellophane membrane into the receptor medium. In case of hydroalcoholic drug solution most of the drug was released in 2–3 h whereas significantly less (p<0.05) amount of drug was released from ethosomal formulations indicating that the diffusion of drug from ethosomal bilayers is the rate limiting step in overall drug permeation through the cellophane membrane. The similarity factor (f2) of release profiles of different formulations for various time intervals was determined in comparison to hydroalcoholic solution. The value of the similarity factor for all the formulations was found to be less than 50 in comparison to hydroalcoholic drug solution indicating significant difference. Release of the drug was reduced with increasing amount of SPC in formulation whereas increasing the concentration of alcohol somewhat increases the drug release. The formulation composed of 1% SPC and 20% (E1) alcohol released 81.4±5% ketoprofen after 24 h whereas increasing the amount of SPC to 3% resulted in reduced drug release to 71.3±4.6%, however the difference was found to be insignificant (f2>50; Fig. 6). The observed increase of drug release with higher amount of alcohol could be due to increased fluidity of the bilayer membrane with increasing concentration of alcohol.
Fig. 6.
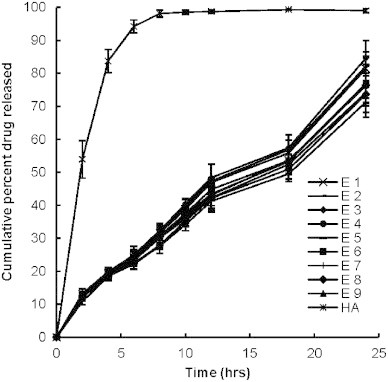
Percent cumulative drug release after 24 h from various ethosomal formulations. Values represent mean±SD (n=3).
To assess the release rate kinetic value, values of diffusional release exponent was calculated by plotting log cumulative amount of drug release versus log time (graph not shown). Formulations exhibited diffusional release exponent in the range of 0.7093–0.7414 indicating non-Fickian release of drug from the vesicular system. Overall with in vitro release through cellophane membrane it can be summed up that all the formulations showed sustained behavior compared to hydroalcoholic drug solution.
3.4. In vitro permeation of drug through skin
The permeation profile of various formulations through the skin was compared with that obtained from hydroalcoholic drug solution. The cumulative amount of drug permeated from various ethosomal formulations was found to be significantly higher (p<0.05) in comparison to permeation from hydroalcoholic drug solution. The value of f2 for all the formulations was found to be less than 50 in comparison to hydroalcoholic drug solution indicating significant difference. Values of steady state transdermal flux were calculated from the graph of cumulative drug permeated versus time and are shown in Table 1. Enhancement ratio was calculated by dividing transdermal flux of ethosomal formulations to that of control. Transdermal flux from various ethosomal formulations across skin was ranged between 165.7±19 to 207.1±23.3 μg/cm2/h whereas lower transdermal flux 94.6±10.3 μg/cm2/h was observed with hydroalcoholic drug solution (Table 1). Three dimensional surface plot was prepared to check the influence of composition of ingredients of formulation i.e. SPC and alcohol on transdermal flux (Fig. 7). It is clear from the surface plot and Fig. 8 that the highest transdermal flux is observed with a ethosomal formulation having 1% SPC and 40% ethanol (E3). The concentration of alcohol has more influence on transdermal flux compared to the amount of SPC. Two zones of higher transdermal flux (198.8–240.4 and 204.4–210 μg/cm2/h) are seen with formulations having 1–1.75% of SPC and 35–40% of alcohol. However when the concentration of alcohol is decreased to 20–25% with around the same amount of SPC (1.25–2.25%), the zone with lowest transdermal flux is reached. Formulation E1, which is composed of 1% SPC and 20% alcohol showed permeation of 3211.8±36.6 μg drug after 24 h, this was significantly increased to 3529.5±59.1 and 3840±25.2 μg when the concentration of alcohol was increased to 30% and 40% respectively (f2<50) (Fig. 8). Formulation E3, which was composed of the lowest vesicle size, outperformed all other formulations and showed the highest transdermal flux. Some other lipid based formulations are reported in the literature and comparative analysis of skin permeation can bring a real picture about the performance of ethosomal formulations. Valenta et al. [36] have prepared soya–lecithin aggregates (SLA) bearing ketoprofen as model drug and incorporated these aggregates into hydrophilic and hydrophobic vehicles and studied the permeation using excised rat skin. The permeation rates of SLA incorporated into hydrophilic vehicles like propyleneglycol, polyethyleneglycol 400 and alkyl polyglucosid were found to be approximately 2700–2900 μg through an area of 1 cm2 in 24 h. Ketoprofen released from hydrophobic creams was very low and after 24 h, around 300 μg of drug was released. Permeation from the supersaturated systems based on SLA–PEG was fairly good and released 2200–3000 μg through an area of 1 cm2 of rat skin. Comparing their results with ethosomal formulations, it is clear that skin permeation of ethosomal formulations is better than soya–lecithin aggregates. The highest skin permeation with SLA after 24 h, is approximately 2900 μg through an area of 1 cm2 of rat skin, whereas with ethosomes it is approximately 3840 μg through an area of 0.785 cm2 of human skin. Maestrelli et al. [25] prepared β–cyclodextrin (βCyd) and hydroxypropyl–βCyd (HPβCyd) complexes with ketoprofen and incorporated them into multilamellar liposomes for topical delivery. Permeability studies of drug and drug–Cyd complexes, in the form of suspensions or incorporated in liposomes were performed both across artificial membranes and rat skin. Skin permeation rates of suspension forms were surprisingly higher in comparison to liposomes. Drug suspensions having ketoprofen exhibited skin permeation of approximately 670 μg in 24 h compared to 630 μg in case of lipsosomes bearing ketoprofen. Similar trends were observed with drug–βCyd and drug–HPβCyd complexes and their liposomes. Permeation of ketoprofen through skin of all the formulations is substantially lower compared to ethosomal formulations.
Fig. 7.
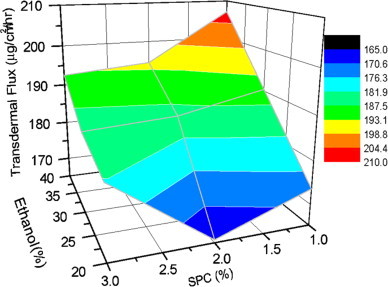
Three dimensional surface plot showing effect of ethanol and SPC on transdermal flux of various formulations.
Fig. 8.
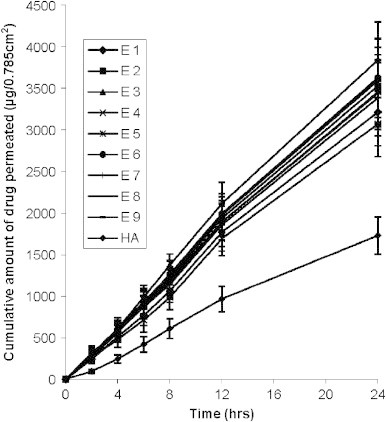
In vitro permeation of ketoprofen from various formulations through 0.785 cm2 area of human skin. Values represent mean±SD (n=3).
Predicted in vivo drug plasma concentration was estimated assuming drug in a patch of 50 cm2. Actually plasma ketoprofen concentration above 1 μg/ml is reported to elicit analgesic effect [33] and in order to achieve steady state plasma concentration above 1 μg/ml the ethosomal preparation is to be fabricated in a patch size of 50 cm2. However by increasing the amount of drug in the formulation, the patch size to achieve the same concentration can be reduced. Steady state plasma concentration from all the formulations was investigated to be in a narrow range varying from 1.21±0.13 to 1.52±0.17 μg/ml. However this is not a point of concern as the values are well above 1 μg/ml, which is sufficient to generate therapeutic response in contrast to hydroalcoholic drug solution that remained in sub therapeutic range using a patch of 50 cm2. Highest transdermal flux and consequently highest Pss (1.52±0.17 μg/ml) was observed with formulation E3 whereas lowest Pss of 1.21±0.13 μg/ml was observed with E4 (Table 1). Prediction of steady state in vivo drug plasma concentration was based on assumption that drug were in a patch of 50 cm2.
To check the kinetics of in vitro permeation, the diffusional release exponent was calculated. Diffusional release exponent was estimated as slope of the graph plotted between log cumulative amounts of drug release versus log time (graph not shown). The diffusional release exponent is a parameter that is indicative of drug release mechanism. A diffusional release exponent of 0.5 indicates normal concentration-controlled Fickian diffusion (case I). Exponent of 1 indicates zero order release (case II) while its value more than 1 indicates super case II type release. The value of diffusional release exponent for all the formulations was found to be around one which indicates that absorption of drugs through the skin follows zero order release. Systems that obey zero order release are ideal for transdermal drug delivery as they provide constant release of drug over an extended period of time and reflect improved therapeutic index. The kinetics of ketoprofen across skin (zero order) is different from that across cellophane membrane (non-Fickian). This may be due to the fact that skin has complex structure and release profile of drugs from delivery system through skin cannot be exactly matched with cellophane membrane. It may suggest that other than the ethosome itself, skin also modified the diffusion properties of ketoprofen. This can be explained in a way that some component of the skin might be interacting with the ethosomes and altering its diffusional properties.
The increased drug skin permeability with ethosomal formulations is concordant with the reports published in literature showing enhanced drug permeation with lipid vesicles having ethanol as one of components [4,8,27,37]. Alcohol is a natural enhancer, which has the property to alter the skin permeability. However transdermal permeability of ethosomal formulations was found to be higher compared to hydroalcoholic drug solution which indicates that it is not alcohol alone which is contributing for higher skin permeability. Several studies have investigated the possible mechanism for improved skin permeability with lipid vesicular system. Vesicles can act as a carrier of drug and intact vesicles penetrate the stratum corneum along with the encapsulated drug. Secondly vesicles can act as penetration enhancer and interacts with the stratum corneum lipids and alter the permeability, which facilitates penetration of drug molecule across stratum corneum. Enhanced permeation of drug with ethosomal formulations could be due to combined effect of alcohol and lipid vesicular system. Skin is a densely packed organ and lipids are arranged in a symmetric conformation. Alcohol being a penetration enhancer might interact with the skin lipid and disturbs its conformation with consequent increase in fluidity. Exploiting increased fluidity of skin lipids, ethosomes, which are flexible in nature, intermingles with the skin lipid and penetrate across disordered stratum corneum. Once it penetrates the stratum corneum the release of drug depends on further interaction of formulation with the skin lipids.
3.5. Confocal laser scanning microscopy
To visualize the permeation modes of the ethosomes through stratum corneum, they were further investigated by using confocal laser scanning microscopy. Penetration through stratum corneum is the rate limiting step in the overall transdermal delivery of drugs or other delivery vehicle. Once the drug or formulation crosses stratum corneum its further penetration or absorption is relatively easy. Fig. 9A and B shows the penetration of Rhodamine 123 from ethosomal vesicles and hydroalcoholic probe solution, respectively. Figures are divided in four parts showing penetration of Rhodamine 123 at different depth levels through the skin. It is clear from the confocal photomicrographs that intensity of fluorescent probe Rhodamine 123 is much higher from ethosomal formulation in comparison to hydroalcoholic drug solution containing the same concentration of alcohol. The greater fluorescent intensity with ethosomal system compared to hydroalcoholic drug solution further confirms that alcohol is not the only driving force promoting penetration across skin. It is clear from the confocal photomicrograph (Fig. 9A) that fluorescence of Rhodamine 123 is visible in outer region of the lipid vesicles indicating entrapment of probe in hydrophobic chain of the lipid bilayer. It is interesting to note the presence of de-shaped vesicles penetrating through the skin, which suggest that intact vesicles can penetrate stratum corneum with drug release taking place afterwards. Quantitative estimation of fluorescent intensity was performed and is represented as graph in Fig. 9C. Depth of penetration of dye across skin was divided in four parts i.e. 0–10, 10–20, 20–30 and 30–40 μm and average fluorescent intensity in each block was estimated using the software Image-J [15]. It is clear from the graphs that fluorescent intensity of ethosomal entrapped dye is substantially higher in comparison to its hydroalcoholic solution. Fluorescent intensity of Rhodamine 123 entrapped in lipid vesicles was calculated to be 15.3±3.3 at 30–40 μm inside skin whereas with hydroalcoholic solution it was 5.7±2.8. In terms of skin penetration, both qualitative and quantitative data revealed excellent performance of ethosomes entrapped Rhodamine 123 compared to hydroalcoholic solution. However, cautions should be taken when these results are compared with those of ketoprofen since the Log P of Rhodamine 123 is 1.2, while the Log P of ketoprofen is 0.97 [3].
Fig. 9.
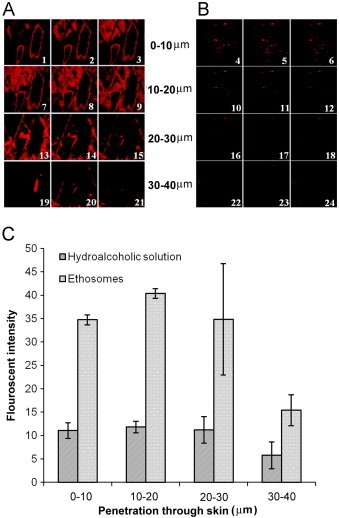
Confocal microscopy showing penetration of fluorescent probe Rhodamine 123 into human skin. (A) Penetration of Rhodamine 123 entrapped in ethosomes and (B) shows penetration of fluorescent probe from hydroalcoholic solution. (C) Fluorescent intensity of Rhodamine 123 into human skin. Thumbnails 1–6, 7–12, 13–18 and 19–24 show the depth of skin penetration of 0–10, 10–20, 20–30 and 30–40 μm, respectively.
4. Conclusions
It can be concluded from the results of the study that ethosomal formulation is a potentially useful vehicle for transdermal delivery of ketoprofen. Vesicles with appropriate size and reasonable entrapment efficiency can be prepared. Results of the in vitro release study through the skin revealed higher transdermal flux with ethosomal formulation compared to hydroalcoholic drug solution. Confocal laser scanning microscopy further confirmed the potential of ethosomal system by showing high fluorescent intensity of Rhodamine 123 loaded formulation compared to hydroalcoholic solution of probe across skin.
Acknowledgments
The authors wish to thank Lipoid (Germany) for generously supplying soya phosphatidyl choline as gift sample. SBIC-Nikon Imaging Center at Biopolis, Singapore, provided facility to acquire confocal microscopy images for this study. Help of Dr Amit Misra, CDRI, India, is duly acknowledged regarding preparation of three dimensional surface plots.
References
- 1.Almirall M., Montana J., Escribano E., Obach R., Berrozpe J.D. Effect of d-limonene, a-pinene and cineole on in vitro transdermal human skin penetration of chlorpromazine and haloperidol. Drug Research. 1996;46:676–680. [PubMed] [Google Scholar]
- 2.Barry B.W. Drug delivery routes in skin: a novel approach. Advanced Drug Delivery Reviews. 2002;54(Suppl 1):S31–S40. doi: 10.1016/s0169-409x(02)00113-8. [DOI] [PubMed] [Google Scholar]
- 3.Beetge E., du Plessis J., Muller D.G., Goosen C., van Rensburg F.J. The influence of the physicochemical characteristics and pharmacokinetic properties of selected NSAID's on their transdermal absorption. International Journal of Pharmaceutics. 2000;193:261–264. doi: 10.1016/s0378-5173(99)00340-3. [DOI] [PubMed] [Google Scholar]
- 4.Bendas E.R., Tadros M.I. Enhanced transdermal delivery of salbutamol sulfate via ethosomes. AAPS PharmwSciTech. 2007;8:E107. doi: 10.1208/pt0804107. [DOI] [PMC free article] [PubMed] [Google Scholar]
- 5.Bouwstra J.A., Honeywell-Nguyen P.L. Skin structure and mode of action of vesicles. Advanced Drug Delivery Reviews. 2002;54(Suppl 1):S41–S55. doi: 10.1016/s0169-409x(02)00114-x. [DOI] [PubMed] [Google Scholar]
- 6.Cevc G., Vierl U., Mazgareanu S. Functional characterisation of novel analgesic product based on self-regulating drug carriers. International Journal of Pharmaceutics. 2008;360:18–28. doi: 10.1016/j.ijpharm.2008.04.002. [DOI] [PubMed] [Google Scholar]
- 7.Cheng Y., Man N., Xu T., Fu R., Wang X., Wen L. Transdermal delivery of nonsteroidal anti-inflammatory drugs mediated by polyamidoamine (PAMAM) dendrimers. Journal of Pharmaceutical Sciences. 2007;96:595–602. doi: 10.1002/jps.20745. [DOI] [PubMed] [Google Scholar]
- 8.Dubey V., Mishra D., Dutta T., Nahar M., Saraf D.K., Jain N.K. Dermal and transdermal delivery of an anti-psoriatic agent via ethanolic liposomes. Journal of Controlled Release. 2007;123:148–154. doi: 10.1016/j.jconrel.2007.08.005. [DOI] [PubMed] [Google Scholar]
- 9.Dubey V., Mishra D., Jain N.K. Melatonin loaded ethanolic liposomes: physicochemical characterization and enhanced transdermal delivery. European Journal of Pharmaceutics and Biopharmaceutics. 2007;67:398–405. doi: 10.1016/j.ejpb.2007.03.007. [DOI] [PubMed] [Google Scholar]
- 10.Dubey V., Mishra D., Nahar M., Jain N.K. Vesicles as tools for the modulation of skin permeability. Expert Opinion on Drug Delivery. 2007;4:579–593. doi: 10.1517/17425247.4.6.579. [DOI] [PubMed] [Google Scholar]
- 11.El Maghraby G.M., Barry B.W., Williams A.C. Liposomes and skin: from drug delivery to model membranes. European Journal of Pharmaceutical Sciences. 2008;34:203–222. doi: 10.1016/j.ejps.2008.05.002. [DOI] [PubMed] [Google Scholar]
- 12.Elsayed M.M., Abdallah O.Y., Naggar V.F., Khalafallah N.M. Deformable liposomes and ethosomes: mechanism of enhanced skin delivery. International Journal of Pharmaceutics. 2006;322:60–66. doi: 10.1016/j.ijpharm.2006.05.027. [DOI] [PubMed] [Google Scholar]
- 13.Elsayed M.M., Abdallah O.Y., Naggar V.F., Khalafallah N.M. Lipid vesicles for skin delivery of drugs: reviewing three decades of research. International Journal of Pharmaceutics. 2007;332:1–16. doi: 10.1016/j.ijpharm.2006.12.005. [DOI] [PubMed] [Google Scholar]
- 14.Garg M., Dutta T., Jain N.K. Reduced hepatic toxicity, enhanced cellular uptake and altered pharmacokinetics of stavudine loaded galactosylated liposomes. European Journal of Pharmaceutics and Biopharmaceutics. 2007;67:76–85. doi: 10.1016/j.ejpb.2006.12.019. [DOI] [PubMed] [Google Scholar]
- 15.Girish V., Vijayalakshmi A. Affordable image analysis using NIH Image/ImageJ. Indian Journal of Cancer. 2004;41:47. [PubMed] [Google Scholar]
- 16.Godin B., Touitou E. Ethosomes: new prospects in transdermal delivery. Critical Reviews in Therapeutic Drug Carrier Systems. 2003;20:63–102. doi: 10.1615/critrevtherdrugcarriersyst.v20.i1.20. [DOI] [PubMed] [Google Scholar]
- 17.Gohel M.C., Nagori S.A. Fabrication of modified transport fluconazole transdermal spray containing ethyl cellulose and Eudragit RS100 as film formers. AAPS PharmSciTech. 2009;10:684–691. doi: 10.1208/s12249-009-9256-8. [DOI] [PMC free article] [PubMed] [Google Scholar]
- 18.Jain S.K., Chourasia M.K., Sabitha M., Jain R., Jain A.K., Ashawat M. Development and characterization of transdermal drug delivery systems for diltiazem hydrochloride. Drug Delivery. 2003;10:169–177. doi: 10.1080/713840400. [DOI] [PubMed] [Google Scholar]
- 19.Jain S.K., Jain R.K., Chourasia M.K., Jain A.K., Chalasani K.B., Soni V. Design and development of multivesicular liposomal depot delivery system for controlled systemic delivery of acyclovir sodium. AAPS PharmSciTech. 2005;6:E35–E41. doi: 10.1208/pt060108. [DOI] [PMC free article] [PubMed] [Google Scholar]
- 20.Kang L., Liu X.Y., Sawant P.D., Ho P.C., Chan Y.W., Chan S.Y. SMGA gels for the skin permeation of haloperidol. Journal of Controlled Release. 2005;106:88–98. doi: 10.1016/j.jconrel.2005.04.017. [DOI] [PubMed] [Google Scholar]
- 21.Karande P., Jain A., Ergun K., Kispersky V., Mitragotri S. Design principles of chemical penetration enhancers for transdermal drug delivery. Proceedings of the National Academy of Sciences United States of America. 2005;102:4688–4693. doi: 10.1073/pnas.0501176102. [DOI] [PMC free article] [PubMed] [Google Scholar]
- 22.Langer R. Transdermal drug delivery: past progress, current status, and future prospects. Advanced Drug Delivery Reviews. 2004;56:557–558. doi: 10.1016/j.addr.2003.10.021. [DOI] [PubMed] [Google Scholar]
- 23.Lim P.F., Liu X.Y., Kang L., Ho P.C., Chan S.Y. Physicochemical effects of terpenes on organogel for transdermal drug delivery. International Journal of Pharmaceutics. 2008;358:102–107. doi: 10.1016/j.ijpharm.2008.02.021. [DOI] [PubMed] [Google Scholar]
- 24.Lim P.F., Liu X.Y., Kang L., Ho P.C., Chan Y.W., Chan S.Y. Limonene GP1/PG organogel as a vehicle in transdermal delivery of haloperidol. International Journal of Pharmaceutics. 2006;311:157–164. doi: 10.1016/j.ijpharm.2005.12.042. [DOI] [PubMed] [Google Scholar]
- 25.Maestrelli F., Gonzalez-Rodriguez M.L., Rabasco A.M., Mura P. Preparation and characterisation of liposomes encapsulating ketoprofen-cyclodextrin complexes for transdermal drug delivery. International Journal of Pharmaceutics. 2005;298:55–67. doi: 10.1016/j.ijpharm.2005.03.033. [DOI] [PubMed] [Google Scholar]
- 27.Mishra D., Mishra P.K., Dabadghao S., Dubey V., Nahar M., Jain N.K. Comparative evaluation of hepatitis B surface antigen-loaded elastic liposomes and ethosomes for human dendritic cell uptake and immune response. Nanomedicine: Nanotechnology, Biology and Medicine. 2009;6:110–118. doi: 10.1016/j.nano.2009.04.003. [DOI] [PubMed] [Google Scholar]
- 28.Nugroho A.K., Li L., Dijkstra D., Wikstrom H., Danhof M., Bouwstra J.A. Transdermal iontophoresis of the dopamine agonist 5-OH-DPAT in human skin in vitro. Journal of Controlled Release. 2005;103:393–403. doi: 10.1016/j.jconrel.2004.12.004. [DOI] [PubMed] [Google Scholar]
- 29.Ogiso T., Yamaguchi T., Iwaki M., Tanino T., Miyake Y. Effect of positively and negatively charged liposomes on skin permeation of drugs. Journal of Drug Targeting. 2001;9:49–59. doi: 10.3109/10611860108995632. [DOI] [PubMed] [Google Scholar]
- 30.Potts R.O., Cleary G.W. Transdermal drug delivery: useful paradigms. Journal of Drug Targeting. 1995;3:247–251. doi: 10.3109/10611869509015953. [DOI] [PubMed] [Google Scholar]
- 31.Rachakonda V.K., Yerramsetty K.M., Madihally S.V., Robinson R.L., Jr., Gasem K.A. Screening of chemical penetration enhancers for transdermal drug delivery using electrical resistance of skin. Pharmaceutical Research. 2008;25:2697–2704. doi: 10.1007/s11095-008-9696-y. [DOI] [PubMed] [Google Scholar]
- 32.Rhee Y.S., Choi J.G., Park E.S., Chi S.C. Transdermal delivery of ketoprofen using microemulsions. International Journal of Pharmaceutics. 2001;228:161–170. doi: 10.1016/s0378-5173(01)00827-4. [DOI] [PubMed] [Google Scholar]
- 33.Roda A., Sabatini L., Mirasoli M., Baraldini M., Roda E. Bioavailability of a new ketoprofen formulation for once-daily oral administration. International Journal of Pharmaceutics. 2002;241:165–172. doi: 10.1016/s0378-5173(02)00230-2. [DOI] [PubMed] [Google Scholar]
- 34.Touitou E., Dayan N., Bergelson L., Godin B., Eliaz M. Ethosomes - novel vesicular carriers for enhanced delivery: characterization and skin penetration properties. Journal of Controlled Release. 2000;65:403–418. doi: 10.1016/s0168-3659(99)00222-9. [DOI] [PubMed] [Google Scholar]
- 35.Touitou E., Godin B., Dayan N., Weiss C., Piliponsky A., Levi-Schaffer F. Intracellular delivery mediated by an ethosomal carrier. Biomaterials. 2001;22:3053–3059. doi: 10.1016/s0142-9612(01)00052-7. [DOI] [PubMed] [Google Scholar]
- 36.Valenta C., Wanka M., Heidlas J. Evaluation of novel soya-lecithin formulations for dermal use containing ketoprofen as a model drug. Journal of Controlled Release. 2000;63:165–173. doi: 10.1016/s0168-3659(99)00199-6. [DOI] [PubMed] [Google Scholar]
- 37.Zhaowu Z., Xiaoli W., Yangde Z., Nianfeng L. Preparation of matrine ethosome, its percutaneous permeation in vitro and anti-inflammatory activity in vivo in rats. Journal of Liposome Research. 2009:1–8. doi: 10.1080/08982100902722381. [DOI] [PubMed] [Google Scholar]