

Abstract
Synthetic cathinones are recreational drugs that mimic the effects of illicit stimulants like cocaine, amphetamine or Ecstasy. Among the available synthetic cathinones in the United States, 3,4-methylenedioxypyrovalerone (MDPV) is commonly abused and associated with dangerous side effects. MDPV is a dopamine transporter blocker 10-fold more potent than cocaine as a locomotor stimulant in rats. Previous in vitro and in vivo studies examining MDPV metabolism reported 3,4-dihydroxypyrovalerone (3,4-catechol-PV) and 4-hydroxy-3-methoxypyrovalerone (4-OH-3-MeO-PV) as the two primary metabolites. We developed and validated a liquid chromatography-high resolution mass spectrometry method to quantify MDPV and its primary metabolites in 100 μL human and rat plasma. Plasma hydrolysis was followed by protein precipitation before analysis. Limits of detection were 0.1 μg L−1, with linear ranges from 0.25–1000 μg L−1. Process efficiency, matrix effect, total imprecision (%CV) and accuracy (%target) were 36 to 93%, −8 to 12%, 2.1 to 7.3% and 86 to 109%, respectively. MDPV and metabolites were stable at room temperature for 24h, 4°C for 72h and after 3 freeze-thaw cycles with less than 10% variability. Human-rat plasma cross validation demonstrated that rat plasma could be accurately quantified against a human plasma calibration curve. As proof of this method, rat plasma specimens were analyzed after intraperitoneal and subcutaneous dosing with MDPV (0.5 mg kg−1). MDPV, 3,4-catechol-PV and 4-OH-3-MeO-PV concentrations ranged from not detected to 107.5 μg L−1 prior to and up to 8 h after dosing. This method provides a simultaneous quantification of MDPV and two metabolites in plasma with good selectivity and sensitivity.
Keywords: MDPV, synthetic cathinones, LC-MS/MS, HRMS, metabolites
1. Introduction
Synthetic cathinones are stimulant drugs derived from cathinone, the active ingredient of the Khat plant Catha edulis. These compounds are taken as alternatives to illicit drugs such as 3,4-methylenedioxymethamphetamine (MDMA), amphetamines or cocaine. Synthetic cathinones are typically purchased online, in head shops or gas stations, and are sold as “legal highs”, “plant food”, “bath salts” or “research chemicals”. Products containing synthetic cathinones are often labeled “not for human consumption” to avoid regulations controlling the sale and consumption of psychoactive substances. Methcathinone was the first synthetic cathinone to be abused during the 1990’s, followed by mephedrone, 3,4-methylenedioxypyrovalerone (MDPV) and many others [1–4]. MDPV was first synthesized in 1969 and tested for efficacy in the treatment of chronic fatigue, but drug development stopped during clinical trials due to adverse effects [5]. Almost 30 years later, the first US seizure of MDPV was reported by the Drug Enforcement Administration [6]. Since then, MDPV is one of the most widely abused synthetic cathinones in the world [2, 5, 7–8], and the primary synthetic cathinone responsible for serious adverse effects often requiring emergency medical care. Consequently, MDPV, as well as mephedrone and methylone, were classified as Schedule I drugs in the US Controlled Substances Act in 2012.
MDPV’s chemical structure includes a propyl side-chain, a 3,4-methylenedioxy substitution at the phenyl ring (similar to MDMA) and a pyrrolidine ring positioned at the amine (Figure. 1a). MDPV is lipophilic and easily crosses the blood-brain barrier. Drug users take MDPV for its psychostimulant effects; however, adverse effects include agitation, paranoia, tachycardia and death [8–10].
Figure 1.
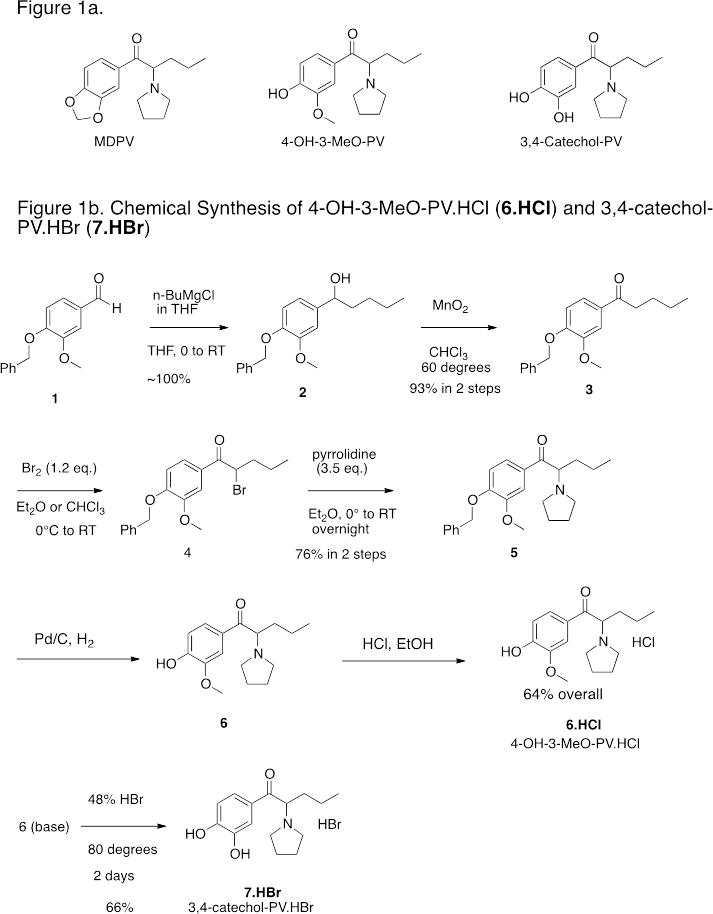
Figure 1a. Structures of 3,4-methylenedioxypyrovalerone (MDPV), 3,4-dihydroxypyrovalerone (3,4-Catechol-PV) and 4-hydroxy-3-methoxy-pyrovalerone (4-OH-3-MeO-PV).
Figure 1b. Chemical Synthesis of 4-OH-3-MeO-PV.HCl (6.HCl) and 3,4-catechol-PV.HBr (7.HBr)
Recent preclinical studies characterized MDPV pharmacology [11–13]. Utilizing in vitro transporter assays, Baumann et al. demonstrated that MDPV is a potent monoamine transporter blocker, similar to cocaine. In contrast to cocaine, MDPV was selective for norepinephrine and dopamine transporters, with little serotonin effect. In rats, MDPV was at least 10-fold more potent than cocaine as a locomotor stimulant [13]. MDPV metabolism was studied in rat and human urine, and as a substrate for human liver microsomes [14–15]. Strano-Rossi et al. reported that MDPV was partially metabolized to 3,4-dihydroxypyrovalerone (3,4-catechol-PV) by O-demethylenation of the 3,4-methylenedioxy ring and to 4-hydroxy-3-methoxy-pyrovalerone (4-OH-3-MeO-PV) by O-methylation of 3,4-catechol-PV, with further phase 2 conjugation with sulfates (50%) and/or glucuronides (40%) [14]. During metabolite identification studies, Meyer et al. identified these two metabolites and their glucuronides in rat and human urine, but no sulfates were identified [15]. In addition, these authors reported other metabolites produced by hydroxylation and oxidation of the propyl side-chain or by oxidation of the pyrrolidine ring and formation of the primary amine.
Currently, there are no quantitative methods for the analysis of MDPV and its main metabolites in plasma. It is critical to develop such an assay for verification of drug exposures in emergency medicine settings and for research purposes in animal models. Thus, we developed and fully validated a method for the simultaneous determination of MDPV and its two major metabolites 3,4-catechol-PV and 4-OH-3-MeO-PV in human and rat plasma by liquid chromatography coupled to high-resolution mass spectrometry. This method will be utilized to characterize MDPV and metabolites’ pharmacokinetics after controlled MDPV administration in rats.
2. Materials and methods
2.1. Chemicals and materials
MDPV and MDPV-d8 were obtained from Cayman Chemical Company and Cerilliant. 3,4-catechol-PV and 4-OH-3-MeO-PV were synthesized and purified by the Drug Design and Synthesis Section of the National Institute on Drug Abuse (NIDA) Intramural Research Program, Baltimore, MD, USA. Formic acid, methanol, acetonitrile, water, ethylenediaminetetraacetic acid (EDTA) and sodium metabisulfite (SMBS) were acquired from Fisher Scientific. 4-methylcatechol and sodium hydroxide were purchased from Sigma and JT Baker, respectively. β-glucuronidase from Red Abalone was obtained from Kura Biotec. Water for EDTA, 4-methylcatechol and SMBS solution preparation was purified-in-house by an ELGA Purelab Ultra Analytic purifier.
2.2 Chemical Synthesis of 3,4-Catechol-PV and 4-OH-3-MeO-PV
The detailed synthetic routes to 3,4-CPV and 4-OH-3-MeOPV shown in Figure 1b are presented as supplementary material and are parallel to methodology originally described by Heffe [16] and later utilized by Meltzer [17] for related compounds. Briefly, commercially available benzaldehyde 1 was treated with n-butylmagnesium chloride to give alcohol 2 in quantitative yield. Oxidation of 2 was easily accomplished with manganese dioxide in refluxing chloroform to give ketone 3 in 93% overall yield from aldehyde 1. This facile two-step procedure to ketone 3 proved superior in our hands to the reaction of the aromatic nitrile with n-butylMgCl utilized by Meltzer. The ketone 3 was brominated to give crude 4 that was treated with pyrrolidine to give the benzyloxy protected derivative 5. Hydrogenolysis of the benzyloxy group then gave crude 4-OH-3-MeO-PV (6) that was converted to the pure HCl salt (6.HCl). Treatment of 6 base with 48% HBr at 80 °C gave 3,4-Catechol-PV.HBr (7.HBr). This route has the advantage that both 3,4-Catechol-PV.HBr and its 3-methoxy derivative 6 are available from the common intermediate 5.
2.3. Animal experiment
As proof of method, MDPV and metabolites were quantified in rat plasma specimens after 0.5 mg kg−1 intraperitoneal or subcutaneous MDPV. Briefly, male Sprague-Dawley rats were anesthetized with 60 mg kg−1 pentobarbital and an indwelling jugular catheter was surgically implanted. One week after surgery, the rats received MDPV injection in the home cage and serial blood specimens (300 μL) were withdrawn via the catheter. Blood was collected just before and 10, 20, 30, 60, 120, 240 and 480 min after dosing. Blood was centrifuged, plasma was collected and SMBS (5 μL) was added to plasma. Specimens were stored at −80°C until analysis. Animal use procedures followed the National Institutes of Health Guide for Care and Use of Laboratory Animals and were approved by the local National Institute on Drug Abuse Animal Care and Use Committee (12-MTMD).
2.4. Instrumentation
Liquid chromatography-high resolution mass spectrometry was performed on a Thermo Scientific Dionex Ultimate 3000 RSLC system coupled to a Thermo Scientific Q Exactive Mass spectrometer. A TurboVap LV® evaporator from Zymark was utilized to evaporate extracts under nitrogen.
2.5. Preparation of standard solutions
Stock solutions (1 g L−1) of all analytes and internal standard (IStd) were prepared in MeOH. 1, 2, 10, 100, 1000 and 2000 μg L−1 calibrator working solutions, 100 μg L−1 MDPV-d8, 3 μg L−1 (low), 50 μg L−1 (medium) and 3000 μg L−1 (high) quality control working solutions were prepared by appropriate dilution of stock solution in 3% 250 mM SMBS, 3% 250 mM EDTA in 0.01M formic acid.
2.6. Sample preparation
Twenty μL 250 mM SMBS, 10 μL 250 mM EDTA and 50 μL IStd were added to 100 μL rat plasma and gently vortexed. Cleavage of 3,4-catechol-PV and 4-OH-3-MeO-PV conjugates was performed by incubating 10 μL β-glucuronidase with samples at 50°C. Samples were cooled at room temperature before addition of 20 μL 4-methylcatechol. Protein precipitation was performed with 400 μL chilled acetonitrile followed by centrifugation (15,000xg x10 min). 300 μL supernatant was evaporated to dryness under nitrogen stream at 40°C and reconstituted with 200 μL mobile phase A (0.1% formic acid in water), vortexed, and centrifuged at 4,000xg at 4ºC for 5 min. Supernatants were transferred into screw top autosampler vials containing 0.2 mL glass inserts.
2.7. Liquid Chromatography
Chromatographic separation was achieved on a Synergy Polar-RP 100x2 mm 2.5 μm column (Phenomenex, Torrance, CA) and identically packed defender guard cartridges (10x20 mm 2.5 μm). Gradient elution was performed with mobile phase A (0.1% formic acid in water) and B (0.1% formic acid in acetonitrile) at 0.4 mL/min flow rate and 40ºC. The initial composition (10% B) was maintained for 0.2 min, %B increased to 95% over 3 min and held for 1 min, then returned to initial conditions over 0.5 min. A 1 min equilibration followed, yielding a total run time of 5.5 min.
2.8. Mass Spectrometry
The Q Exactive mass spectrometer was equipped with a heated electrospray ionization source (HESI-II) and operated in the positive ionization mode. MS source parameters were selected based on the mobile phase flow (0.4 ml/min): the spray voltage 3 kV, capillary temperature 350°C, heater temperature 425°C, sheath gas flow 50, auxiliary gas flow 13 and sweep gas 3 (arbitrary units). MDPV fragmentation and other MS tune parameters were selected based on our previously published MDPV data [18]. Targeted-MS/MS scans were acquired at 35,000 resolution (full width at half maximum at m/z 200). Precursor ions were selected in the quadrupole with a 3 m/z window and subsequently fragmented in the HCD cell. Two specific product ions were utilized for data analysis with a mass tolerance of 5 ppm (Table 1). 3,4-Catechol-PV and 4-OH-3-MeO-PV were optimized by direct infusion by performing product ion scans of the synthesized materials with a HCD energy ranged from 5 to 80%. The HCD energy that produced the most abundant and specific product ions was chosen. Figure 2 shows the full product ions mass spectra of these 2 synthesized-in-house compounds.
Table 1.
LC-MS/MS parameters, retention times (RT) and internal standards
| Analyte | Precursor ion (m/z) | Product ion Quantitative (m/z) | Product ion Qualitative (m/z) | Normalized Collision Energy (%) | RT (min) |
|---|---|---|---|---|---|
| 3,4-catechol-PV 1 | 264.2 | 126.1275 | 123.0438 | 55 | 2.37 |
| 4-OH-3-MeO-PV 2 | 278.2 | 126.1277 | 175.0751 | 43 | 2.65 |
| MDPV 3 | 276.2 | 126.1278 | 135.044 | 56 | 3.03 |
| MDPV-d8 (Internal Standard) | 284.2 | 134.1779 | 175.0752 | 55 | 3.03 |
: 3,4-catechol-PV = 3,4-dihydroxypyrovalerone,
4-OH-3-MeO-PV = 4-hydroxy-3-methoxypyrovalerone,
MDPV = 3,4-methylenedioxypyrovalerone
Figure 2.


Full product ion mass spectra of 3,4-Catechol-PV (A) and 4-OH-3-MeO-PV (B) at normalized collision energy (NCE) ramp 35–65.
2.9. Identification criteria
To identify all compounds, the following identification criteria were used: retention time (RT) within ±0.2 min of average calibrator RT, presence of 2 product ions, and ion ratio quantifying ion/qualifier ion within ±20% of the average of all calibrators.
2.10. Validation
Validation parameters included linearity, limits of detection (LOD) and quantification (LOQ), imprecision, accuracy, extraction efficiency, process efficiency, matrix effect, specificity, carryover, dilution integrity, autosampler and short-term stability studies and cross validation between human and rat plasma.
2.10.1: Linearity, Limit of detection and quantification
Linearity was determined by least-squares regression with 1/x2 weighting. Acceptable linearity was achieved when all calibrators quantified within ±20% of target. LOD and LOQ were evaluated with decreasing analyte concentrations in drug-fortified plasma; LOD was the lowest concentration producing a signal-to-noise ratio of at least 3 with analytes identified according to previously described criteria (2.9). LOQ was the lowest concentration that met LOD criteria and a signal-to-noise ratio of at least 10, imprecision lower than 20%, and accuracy between 80–120%. LOQ was evaluated by 5 replicates on 3 different days with plasma samples from different sources each day.
2.10.2: Imprecision and accuracy
Imprecision and accuracy were determined at 3 concentrations (low, medium and high QCs) with 5 replicates on 4 different days (n=20). Pooled intra-day, inter-day, and total imprecision were calculated as defined by Krouwer and Rabinovitz [19] and Chesher [20]. The inter-day imprecision standard deviation is defined as the square root of the difference between mean square inter-day imprecision minus mean square intra-day imprecision divided by the number of replicates. It is possible for mean square inter-day imprecision to be lower than mean square intra-day imprecision, with the quantity under the square root sign being negative in this case. If this occurs, the imprecision inter-day is set to 0. Calculated coefficients of variation (%CV) were expected to be less than 20%. Accuracy was evaluated as the percentage of target concentration (n=20), and was required to be 80–120%.
2.10.3: Extraction and process efficiency and matrix effect
Extraction efficiency, process efficiency and matrix suppression or enhancement experiments were based on the Matuszewski method [21]. Different blank plasma samples (a rat plasma pool, 6 human plasma samples) were fortified with QCs and IStd solution before and after sample extraction. Percent extraction efficiency was expressed, for each QC concentration, as the ratio of the mean analyte area in samples fortified before sample preparation divided by mean analyte area in samples added after sample preparation. Percent process efficiency was expressed as the ratio of mean analyte area in samples fortified before sample preparation divided by mean analyte area in samples fortified into mobile phase. Percent matrix suppression or enhancement was calculated as (100 x mean peak area of fortified samples after sample preparation/mean peak area of mobile phase fortified samples) −100.
2.10.4: Specificity
Interferences from endogenous matrix components were evaluated by analyzing plasma samples from 10 healthy non-drug-consuming subjects and a blank pooled rat plasma sample. Method specificity was demonstrated by fortifying blank samples with 2000 μg L−1 of other commonly abused stimulants: ephedrine, pseudoephedrine, methamphetamine, amphetamine, 4-hydroxymethamphetamine, 4-hydroxy-amphetamine, (±)-4-hydroxy-3-methoxyamphetamine (HMA), (±)-4-hydroxy-3-methoxymethamphetamine (HMMA), (±)-3,4-methylenedioxyamphetamine (MDA), (±)-3,4-methylenedioxymethamphetamine (MDMA), (±)-3,4-methylene-dioxyethylamphetamine (MDEA), (±)-4-methoxyamphetamine (PMA), (±)-4-meth-oxymethamphetamine (PMMA), and 1000 μg L−1 of cathinone, methcathinone, 4-fluoromethcathinone, methylone, ethylcathinone, α-pyrrolidinopropiophenone (a-ppp), buphedrone ephedrine, ethylone, 4-methoxymethcathinone, buphedrone, normephedrone, diethylcathinone, pentedrone, pentylone, butylone, benzedrone, 3′,4′-methylenedioxy-α-pyrrolidinopropiophenone (MDPPP), 4-methylephedrine, mephedrone, 4-methylethcathinone (4-MEC), 4-methyl-N-ethyl-norephedrine, 3′,4′-methylenedioxy-α-pyrrolidinobutiophenone (MDPBP), pyrovalerone, naphyrone, 3,4-dimethylmethcathinone (3,4-DMMC), α-pyrrolidinovalerophenone (α-PVP) and 4-methyl-α-pyrrolidinobutiophenone (4-MPBP). Sufficient specificity was achieved if analytes of interest quantified <LOD.
2.10.5: Carryover
Carryover was evaluated by injecting internal standard-fortified blank samples immediately after a plasma sample fortified at 1000 or 2000 μg L−1. Carryover was considered negligible if the measured concentration was <LOD.
2.10.6: Dilution integrity
Dilution integrity was demonstrated by diluting samples fortified at 1,250, 2,500 and 5,000 μg L−1 with blank plasma 5, 10 and 20 fold. After IStd addition, samples were extracted as described previously and dilution integrity was maintained if samples quantified within ±20% of 250 μg L−1 after 1:5, 1:10 and 1:20 dilutions, respectively.
2.10.7: Stability
Autosampler stability was evaluated by reinjecting low, medium and high QC samples stored 48 h at 4ºC on the autosampler (n=5). In addition, stability was evaluated by comparing concentrations of freshly fortified plasma (n=5) at each QC concentration, with plasma samples fortified and stored in the dark for 24 h at room temperature (n=5), 72 h at 4ºC (n=5), and after three freeze-thaw cycles (n=5). IStd solution was added to each sample just prior to extraction. Stability was considered acceptable if QC samples quantified within ±20% of freshly prepared QC samples.
2.10.8: Human-rat plasma cross-validation
Due to limited blank rat plasma volume, blank human plasma was employed for preparation of calibrators, QC and method validation samples. To verify the validity of using human plasma to quantify MDPV, 3,4-catechol-PV and 4-OH-3-MeO-PV in rat plasma, a cross validation between these two matrices was performed. Blank rat plasma (pooled from different animals) was fortified at each QC concentration (n=5) and quantified against a human plasma calibration curve. Results were considered acceptable if rat plasma samples quantified within ±20% of target.
2.10.9: Hydrolysis
The hydrolysis procedure was based on previous publications for the hydrolysis of MDMA metabolites, 3,4-dihydroxymethamphetamine (HHMA) and 4-hydroxy-3-methoxymethamphetamine (HMMA) [22–23]. Due to the lack of conjugated reference material, hydrolysis efficiency could not be calculated. To check the hydrolysis performance, we compared MDPV, 3,4-Catechol-PV and 4-OH-3-MeO-PV concentrations in plasma with and without hydrolysis. The plasma was collected from a rat after administration of 0.5 mg kg−1 MDPV by intraperitoneal or subcutaneous route (see section 2.3).
3. Results
3.1. Linearity, Limits of detection and quantification
A large linear range from 0.25 to 1000 μg L−1 with 1/x2 weighting was achieved for all three analytes. In five unique calibration curves, mean determination coefficients were 0.9991±0.0005 for MDPV, 0.9937±0.0011 for 4-OH-3-MeO-PV, and 0.9821±0.0007 for 3,4-catechol-PV, with all residuals less than 20%. LOD and LOQ for all analytes were 0.1 μg L−1 and 0.25 μg L−1, respectively. Figures 3a and 3b show chromatograms of blank plasma and plasma fortified at the LOQ (0.25 μg L−1).
Figure 3.

LC-MS/MS chromatogram of (a) human blank plasma, (b) human plasma fortified at 0.250 μg L−1 3,4-methylenedioxypyrovalerone (MDPV), 3,4-dihydroxypyrovalerone (3,4-catechol-PV) and 4-hydroxy-3-methoxypyrovalerone (4-OH-3-MeO-PV) and (c) a rat plasma specimen collected 240 min after 0.5 mg kg−1 intraperitoneal MDPV.
3.2. Imprecision and accuracy
Imprecision and accuracy results are presented in Table 2. For all analytes total imprecision (%CV) was 2.1–7.3% with satisfactory intra-day (≤7.3%) and inter-day (≤3.2%) imprecision. Accuracy ranged from 86 to 109%.
Table 2.
Pooled intra-, inter- and total imprecision and accuracy for MDPV, 3,4-catechol-PV and 4-OH-3-MeO-PV in plasma at the three quality control concentrations (Low = 0.75 μg L−1; Medium = 25 μg L−1 and High = 750 μg L−1 )
| Intra-day (n= 20%CV) | Inter-day (n=20, %CV) | Total (n=20, %CV) | Accuracy (n=20, % Target) | |||||||||
|---|---|---|---|---|---|---|---|---|---|---|---|---|
| Low | Medium | High | Low | Medium | High | Low | Medium | High | Low | Medium | High | |
| 3,4-catechol-PV 1 | 5.6 | 3.2 | 4.5 | 0 | 2.6 | 3 | 5.6 | 4.2 | 5.4 | 106 | 109.5 | 86.1 |
| 4-OH-3-MeO-PV 2 | 7.3 | 3.4 | 4.2 | 0 | 1.2 | 0 | 7.3 | 3.6 | 4.2 | 100.1 | 109.4 | 94 |
| MDPV 3 | 4.1 | 2.1 | 2.4 | 3.2 | 0 | 3.1 | 5.2 | 2.1 | 3.9 | 102.6 | 100.2 | 102 |
3,4-catechol-PV = 3,4-dihydroxypyrovalerone,
4-OH-3-MeO-PV = 4-hydroxy-3-methoxypyrovalerone,
MDPV = 3,4-methylenedioxypyrovalerone
3.3. Extraction and process efficiency and matrix effect
Extraction efficiencies were 39–83.2%, and process efficiencies 35.6–93.4% (Table 3). Matrix effects were <12.2%, and among the 7 different sources of plasma, matrix effect variation was <14.0%.
Table 3.
Extraction efficiency, process efficiency and matrix effect for MDPV, 3,4-catechol-PV and 4-OH-3-MeO-PV in plasma at the three quality control concentrations (Low = 0.75 μg L−1; Medium = 25 μg L−1 and High = 750 μg L−1)
| Matrix effect (n=7) | Extraction efficiency (n=7) | Process efficiency (n=7) | |||||||
|---|---|---|---|---|---|---|---|---|---|
| Low | Medium | High | Low | Medium | High | Low | Medium | High | |
| 3,4-catechol-PV 1 | −8.6 | −6.2 | 1 | 39.0 | 39.6 | 44.9 | 35.6 | 37.1 | 45.3 |
| 4-OH-3-MeO-PV 2 | 4.5 | 1.6 | 2.4 | 52.2 | 52.6 | 53 | 54.6 | 53.5 | 54.2 |
| MDPV 3 | 12.2 | −0.4 | 11.2 | 83.2 | 79.4 | 70.0 | 93.4 | 79.0 | 77.9 |
| MDPV-d8 | 5.6 | −0.1 | 7.2 | 72.0 | 79.3 | 71.8 | 76.0 | 79.2 | 77.0 |
3,4-catechol-PV = 3,4-dihydroxypyrovalerone,
4-OH-3-MeO-PV = 4-hydroxy-3-methoxypyrovalerone,
MDPV = 3,4 methylenedioxypyrovalerone
3.4. Specificity
There were no endogenous interferences in 11 different plasma samples (one rat pool, 10 human plasma samples). Addition of 2,000 μg L−1 potentially interfering drugs and metabolites to blank plasma samples did not produce any interfering peaks meeting identification criteria.
3.5. Carryover
Low carryover was observed after a sample fortified at 2000 μg L−1 for 3,4-catechol-PV and MDPV with quantifies greater than the LOD. There was no carryover for 4-OH-3-MeO-PV. Carryover was evaluated at 1000 μg L−1, and was less than the LOD for all three analytes.
3.6. Dilution integrity
Dilution integrity was evaluated for 1:5; 1:10 and 1:20 dilutions. Diluted samples (250 μg L−1 targeted) quantified within 91–96% of target (n=2) for a 1:5 dilution, 91–99% (n=2) for a 1:10 dilution and 97–99% (n=2) for a 1:20 dilution.
3.7. Stability
Extracted analytes were stable in the autosampler at 4ºC for 48 h with %difference ranging from −10 to 5.1% (n=5, Table 4). After storage at room temperature for 24 h, 4ºC for 72 h, and after 3 freeze-thaw cycles, all compounds were stable. Percent differences were 1–14.2% for room temperature storage, −7.3–7.7% for 4°C storage and −3.6–3.5% after three freeze-thaw cycles.
Table 4.
Plasma stability data at room temperature for 24h, 4ºC for 72h and after 3 freeze-thaw cycles at the three quality control concentrations (Low = 0.75 μg L−1; Medium = 25 μg L−1 and High = 750 μg L−1 ). In addition, we present human-rat plasma cross validation data including the imprecision and accuracy of fortified rat plasma quantified against a human plasma calibration curve.
| 3,4-catechol-PV 1 | 4-OH-3-MeO-PV 2 | MDPV 3 | ||||||||
|---|---|---|---|---|---|---|---|---|---|---|
| Low | Medium | High | Low | Medium | High | Low | Medium | High | ||
| Stability (% difference) | 24h at room temperature (n=5) | 1 | 3.8 | 4.2 | 14.2 | 3.7 | 4.8 | 10.7 | 3.3 | 5.2 |
| 72h at 4°C (n=5) | −7.3 | 6.5 | −3 | 3.9 | 6 | −1.5 | 7.7 | 2.2 | 3.5 | |
| 3 freeze-thaw cycles (n=5) | −3.2 | −2.6 | −3.6 | 3.5 | −0.5 | −0.5 | 3.5 | −1.1 | 1.5 | |
| Human-rat plasma crossvalidation | Imprecision (n=5, % CV) | 9.8 | 3.8 | 3.3 | 5.7 | 4.1 | 4.2 | 3.8 | 2.1 | 3.8 |
| Accuracy (n=5, % target) | 99.9 | 94.1 | 86.8 | 102.9 | 102.3 | 101.1 | 111.7 | 91.3 | 108.8 | |
3,4-catechol-PV = 3,4-dihydroxypyrovalerone,
4-OH-3-MeO-PV = 4-hydroxy-3-methoxypyrovalerone,
MDPV = 3,4-methylenedioxypyrovalerone
3.8. Human-rat plasma cross-validation
Human-rat plasma cross-validation was investigated by quantifying rat plasma fortified at all QC concentrations (n=5) against a calibration curve fortified into human plasma. Imprecision (% CV) was between 2.1–9.8% and accuracy (% target) was between 87–112 % (Table 4).
3.9 Hydrolysis performance
Table 5 shows MDPV and metabolites’ concentrations in rat plasma with and without hydrolysis. MDPV concentration did not change with or without hydrolysis. However, 3,4-catechol-PV and 4-OH-3-MeO-PV concentration greatly decreased without the deconjugation step to concentrations near or below the LOQ.
Table 5.
Hydrolysis efficiency. MDPV, 3,4-catechol-PV and 4-OH-3-MeO-PV plasma concentrations obtained with and without hydrolysis. The rat was dosed with 0.5 mg kg-1 intraperitoneal (ip) and subcutaneous (sc) MDPV.
| 3,4-catechol-PV1 (μg L−1) | 4-OH-3-MeO-PV2 (μg L−1) | MDPV3 concentration (μg L−1) | |||||
|---|---|---|---|---|---|---|---|
| Dose route | Plasma collection time (min) | Hydrolysis | Without hydrolysis | Hydrolysis | Without hydrolysis | Hydrolysis | Without hydrolysis |
| ip | 0 | <LOQ | <LOQ | <LOQ | <LOQ | <LOQ | <LOQ |
| 10 | 4.3 | <LOQ | 9.3 | 0.9 | 8.0 | 9.4 | |
| 20 | 5.1 | <LOQ | 11.8 | 0.7 | 6.6 | 7.2 | |
| 30 | 4.9 | <LOQ | 12.3 | 0.7 | 7.6 | 8.4 | |
| 60 | 3.7 | <LOQ | 14.1 | <LOQ | 3.6 | 2.9 | |
| 120 | 9.6 | <LOQ | 68.9 | 0.5 | 1.8 | 2.2 | |
| 240 | 11.8 | <LOQ | 84.7 | 0.5 | 1.3 | 0.6 | |
| 480 | 5.3 | <LOQ | 23.6 | <LOQ | 0.9 | 1.2 | |
| sc | 0 | <LOQ | <LOQ | <LOQ | <LOQ | <LOQ | <LOQ |
| 10 | 1.3 | <LOQ | 3.2 | 1.1 | 107.5 | 120.1 | |
| 20 | 2.7 | <LOQ | 6.1 | 1.2 | 82.1 | 92.9 | |
| 30 | 3.1 | <LOQ | 6.7 | 1.1 | 51.7 | 56.6 | |
| 60 | 3.8 | <LOQ | 11 | 0.9 | 38.4 | 34 | |
| 120 | 9.4 | <LOQ | 44.7 | 0.7 | 9.9 | 1.5 | |
| 240 | 9.8 | <LOQ | 54.4 | 0.4 | 4.8 | 3.1 | |
| 480 | 3.6 | <LOQ | 11 | <LOQ | 1.7 | 1.4 | |
3.10. Proof of concept
As proof of method, authentic samples were analyzed for MDPV and its primary metabolites in plasma of rats dosed subcutaneously or intraperitoneally with 0.5 mg kg−1 MDPV. In the sample collected before dosing, all analytes were absent. After intraperitoneal dosing, all samples were positive for MDPV, 3,4-catechol-PV and 4-OH-3-MeO-PV with concentrations ranging from 0.9–8.0 μg L−1, 3.7–11.8 μg L−1 and 9.3–84.7 μg L−1, respectively. Figure 3c shows chromatograms of a sample collected 240 min after the intraperitoneal 0.5 mg kg−1 dose. After the subcutaneous dose, MDPV, 3,4-catechol-PV and 4-OH-3-MeO-PV concentrations ranged from 1.7–107.5 μg L−1, 1.3–9.8 μg L−1 and 3.2–54.4 μg L−1, respectively.
4. Discussion
We present a fully validated analytical method for quantification of MDPV. 3,4-catechol-PV and 4-OH-3-MeO-PV in rat and human plasma. Only one previous manuscript reported full validation results for MDPV in equine plasma [24], with a 0.005 μg L−1 LOQ from 1 mL plasma. In our method, the LOQ was 0.25 μg L−1, in only 100 μL plasma. Larger plasma volume could lower LOQs; however, plasma volume is limited for conducting pharmacokinetic studies in animal models such as rats. Moreover, our LOQ is adequate to detect MDPV concentrations reported in authentic cases [24–26]. Wang et al reported horse-doping with MDPV at a concentration of 5.8 μg L−1 in plasma [24]. Kriikku et al. reported serum MDPV concentrations of 20 to 8000 μg L−1 in Finnish drivers stopped for suspicion of driving under the influence of drugs, and Marinetti et al. reported MDPV blood concentrations ranging from 6–368 and 10–640 μg L−1 in 9 human performance and 23 postmortem cases [25–26]. Moreover, the upper limit of quantification was, in our method, much higher than that reported by Wang et al (1000 μg L−1 vs. 15 μg L−1) allowing quantification of the highest reported concentrations.
Sample preparation for this method was rapid and simple with only two steps: deconjugation of possible phase II metabolites and protein precipitation. Deconjugation was performed since 3,4-catechol-PV and 4-OH-3-MeO-PV conjugates were identified by incubation with human liver microsomes and in human and rat urine [14–15]. Due to the lack of conjugated reference material, % hydrolysis efficiency could not be calculated. The hydrolysis was performed based on previous publications on MDMA metabolites [22–23]. MDMA metabolites, HHMA and HMMA, are structurally similar to 3,4-Catechol-PV and 4-OH-3-MeO-PV, and a similar hydrolysis behavior is expected. We compared MDPV and metabolites concentrations in rat plasma with and without hydrolysis. As expected MDPV concentrations were not affected by hydrolysis. 3,4-Catechol-PV and 4-OH-3-MeO-PV concentrations clearly increased after hydrolysis (table 5). These results indicate that 3,4-Catechol-PV and 4-OH-3-MeO-PV are primarily present as the conjugated forms in rat plasma. Protein precipitation was achieved with cold acetonitrile after the addition of 4-methylcatechol. 4-methylcatechol reduced possible adsorption of 3,4-catechol-PV to precipitated proteins, as was shown for HHMA [27–28]. HHMA is a MDMA metabolite obtained by O-demethylenation of the 3,4-methylenedioxy ring present in MDMA; the same biotransformation was observed for the production of 3,4-catechol-PV from MDPV. During method development, protein precipitation also was evaluated with perchloric acid or cold methanol; however, acetonitrile gave the best sensitivity and signal-to-noise ratio. It is also important to note that similar to MDMA and metabolite quantification in plasma, SMBS and EDTA were employed to prevent analyte oxidation [28].
In this study, the Q-Exactive mass spectrometer was utilized, allowing the selection of precursor ions in the quadrupole and after fragmentation, the detection of all its product ions with high resolution and high mass accuracy in the Orbitrap™. High mass accuracy and high resolution offer better specificity and improved sensitivity, compared to conventional low-resolution triple quadrupole or Q-Trap instrument. Moreover, monitoring a full product ion mass spectrum, provides the opportunity to select other ions to confirm the identity of the analytes when an unexpected interference is observed for one of the ions chosen for data processing.
Validation results for MDPV and its metabolites were acceptable. Extraction efficiencies were approximately 40 and 50% for 3,4-catechol-PV and 4-OH-3-MeO-PV, respectively; this could be explained by loss of these polar analytes in the aqueous layer during centrifugation after the addition of acetonitrile. Despite these lower extraction efficiencies, a sensitive LOQ of 0.25 μg L−1 was achieved. The method was MDPV, 3,4-catechol-PV and 4-OH-3-MeO-PV free of carryover at 1000 μg L−1; however, at higher concentrations, low carryover was observed. To handle possible carryover above 1000 μg L−1, authentic specimens that have concentrations above the LOQ and follow a specimen with concentrations ≥1000 μg L−1 will require reanalysis. However, in most cases, MDPV concentrations in human plasma are generally below 1000 μg L−1 [25–26].
Another important parameter to consider in the analysis of synthetic cathinones is their stability. All 3 compounds showed good stability after storage at room temperature for 24 h, 4°C for 72 h and after 3 freeze-thaw cycles, also supported in previous reports [24, 29]. Johnson et al reported that MDPV was stable in fortified plasma at 1,000 μg L−1 at room temp, 4°C and −20°C for 1 to 14 days [29]. Wang et al showed stability of MDPV in plasma at different conditions: 25 days at −20°C, 18 days at −4°C, 27 h at room temperature, and after 3 freeze-thaw cycles [24]. Moreover, the same authors demonstrated instability when analytes were exposed to air for 1h to 6h after evaporation. However, this does not affect our method, as reconstitution was performed immediately after evaporation under nitrogen, avoiding loss of analytes.
The human-rat plasma cross validation highlighted that it is possible to utilize human plasma to quantify MDPV in rat plasma. More importantly, these results demonstrate that this method can be applied to both human and rat species for further pre-clinical, clinical or forensic applications. Method applicability was demonstrated with plasma from rats dosed with 0.5 mg kg−1 intraperitoneal or subcutaneous MDPV. MDPV, 3,4-catechol-PV and 4-OH-3-MeO-PV were quantified respectively as low as 0.9 (480 min after intraperitoneal dosing), 1.3 (10 min after subcutaneous dosing) and 3.2 (10 min after subcutaneous dosing) μg L−1. In contrast, the highest concentrations observed for MDPV, 3,4-catechol-PV and 4-OH-3-MeO-PV were 107.5 (10 min after subcutaneous dosing), 11.8 (240 min after intraperitoneal dosing) and 84.7 (240 minutes after intraperitoneal dosing). These preliminary results indicate that the metabolites will be present in plasma at high concentrations and for longer periods than the parent compound suggesting they are good markers to detect MDPV abuse.
5. Conclusion
We developed and validated an analytical method for the determination of MDPV and metabolites in plasma. The challenges in the development of the method were the low amount of sample available in preclinical studies, the high sensitivity required following low doses, and the specificity of the method. This method achieved high sensitivity and specificity, and is the first for MDPV and metabolites in plasma.
Supplementary Material
Highlights.
MDPV and its metabolites are quantified in human and rat plasma by LC-HRMS
The method is fully validated and all validation criteria are fulfilled
The limit of quantifications are low enough to detect analytes in authentic cases
The method is tested with MDPV dosed rat plasma
Acknowledgments
This research was supported by the Intramural Research Program of the National Institute on Drug Abuse (NIDA), and the National Institute on Alcohol Abuse and Alcoholism (NIAAA), National Institutes of Health (NIH). We also thank Dr. Klaus Gawrisch and Dr. Walter Teague (Laboratory of Membrane Biochemistry and Biophysics, NIAAA) for NMR spectral data. The authors also express their thanks to Noel Whittaker, Mass Spectrometry Facility, NIDDK, for the metabolite synthesis mass spectral data.
Footnotes
Publisher's Disclaimer: This is a PDF file of an unedited manuscript that has been accepted for publication. As a service to our customers we are providing this early version of the manuscript. The manuscript will undergo copyediting, typesetting, and review of the resulting proof before it is published in its final citable form. Please note that during the production process errors may be discovered which could affect the content, and all legal disclaimers that apply to the journal pertain.
References
- 1.Emerson TS, Cisek JE. Methcathinone: a Russian designer amphetamine infiltrates the rural midwest. Annals of Emergency Medicine. 1993;22:1897–1903. doi: 10.1016/s0196-0644(05)80419-6. [DOI] [PubMed] [Google Scholar]
- 2.German CL, Fleckenstein AE, Hanson GR. Bath salts and synthetic cathinones: An emerging designer drug phenomenon. Life Sci. 2013 doi: 10.1016/j.lfs.2013.07.023. [DOI] [PMC free article] [PubMed] [Google Scholar]
- 3.Kelly JP. Cathinone derivatives: a review of their chemistry, pharmacology and toxicology. Drug Test Anal. 2011;3(7–8):439–453. doi: 10.1002/dta.313. [DOI] [PubMed] [Google Scholar]
- 4.Prosser JM, Nelson LS. The toxicology of bath salts: a review of synthetic cathinones. J Med Toxicol. 2012;8(1):33–42. doi: 10.1007/s13181-011-0193-z. [DOI] [PMC free article] [PubMed] [Google Scholar]
- 5.Kesha K, Boggs CL, Ripple MG, Allan CH, Levine B, Jufer-Phipps R, Doyon S, Chi P, Fowler DR. Methylenedioxypyrovalerone (“Bath Salts”),Related Death: Case Report and Review of the Literature. J Forensic Sci. 2013 doi: 10.1111/1556-4029.12202. [DOI] [PubMed] [Google Scholar]
- 6.Yohannan JC, Joseph J, Bozenko S. The Characterization of 3,4-Methylenedioxypyrovalerone (MDPV) Microgram Journal. 2010;7(1):12–15. [Google Scholar]
- 7.Zawilska JB, Wojcieszak J. Designer cathinones-An emerging class of novel recreational drugs. Forensic Sci Int. 2013;231(1–3):42–53. doi: 10.1016/j.forsciint.2013.04.015. [DOI] [PubMed] [Google Scholar]
- 8.Spiller HA, Ryan ML, Weston RG, Jansen J. Clinical experience with and analytical confirmation of “bath salts” and “legal highs” (synthetic cathinones) in the United States. Clin Toxicol (Phila) 2011;49(6):499–505. doi: 10.3109/15563650.2011.590812. [DOI] [PubMed] [Google Scholar]
- 9.Borek HA, Holstege CP. Hyperthermia and multiorgan failure after abuse of “bath salts” containing 3,4-methylenedioxypyrovalerone. Ann Emerg Med. 2012;60(1):103–105. doi: 10.1016/j.annemergmed.2012.01.005. [DOI] [PubMed] [Google Scholar]
- 10.Kyle PB, Iverson RB, Gajagowni RG, Spencer L. Illicit bath salts: not for bathing. J Miss State Med Assoc. 2011;52(12):375–377. [PubMed] [Google Scholar]
- 11.Simmler LD, Buser TA, Donzelli M, Schramm Y, Dieu LH, Huwyler J, Chaboz S, Hoener MC, Liechti ME. Pharmacological characterization of designer cathinones in vitro. Br J Pharmacol. 2013;168(2):458–470. doi: 10.1111/j.1476-5381.2012.02145.x. [DOI] [PMC free article] [PubMed] [Google Scholar]
- 12.Cameron KN, Kolanos R, Solis E, Jr, Glennon RA, De Felice LJ. Bath salts components mephedrone and methylenedioxypyrovalerone (MDPV) act synergistically at the human dopamine transporter. Br J Pharmacol. 2013;168(7):1750–1757. doi: 10.1111/bph.12061. [DOI] [PMC free article] [PubMed] [Google Scholar]
- 13.Baumann MH, Partilla JS, Lehner KR, Thorndike EB, Hoffman AF, Holy M, Rothman RB, Goldberg SR, Lupica CR, Sitte HH, Brandt SD, Tella SR, Cozzi NV, Schindler CW. Powerful cocaine-like actions of 3,4-Methylenedioxypyrovalerone (MDPV), a principal constituent of psychoactive ‘bath salts’ products. Neuropsychopharmacology. 2013;38(4):552–562. doi: 10.1038/npp.2012.204. [DOI] [PMC free article] [PubMed] [Google Scholar]
- 14.Strano-Rossi S, Cadwallader AB, de la Torre X, Botre F. Toxicological determination and in vitro metabolism of the designer drug methylenedioxypyrovalerone (MDPV) by gas chromatography/mass spectrometry and liquid chromatography/quadrupole time-of-flight mass spectrometry. Rapid Commun Mass Spectrom. 2010;24(18):2706–2714. doi: 10.1002/rcm.4692. [DOI] [PubMed] [Google Scholar]
- 15.Meyer MR, Du P, Schuster F, Maurer HH. Studies on the metabolism of the α-pyrrolidinophenone designer drug methylenedioxy-pyrovalerone (MDPV) in rat and human urine and human liver microsomes using GC–MS and LC–high-resolution MS and its detectability in urine by GC–MS. Journal of Mass Spectrometry. 2010;45(12):1426–1442. doi: 10.1002/jms.1859. [DOI] [PubMed] [Google Scholar]
- 16.Heffe W. Die STEVENS-Umlagerung von Allyl-phenacyl-ammoniumsalzen. Helvetica Chimica Acta. 1964;47(5):1289–1292. [Google Scholar]
- 17.Meltzer PC, Butler D, Deschamps JR, Madras BK. 1-(4-Methylphenyl)-2-pyrrolidin-1-yl-pentan-1-one (Pyrovalerone) analogues: a promising class of monoamine uptake inhibitors. J Med Chem. 2006;49(4):1420–1432. doi: 10.1021/jm050797a. [DOI] [PMC free article] [PubMed] [Google Scholar]
- 18.Concheiro M, Anizan S, Ellefsen K, Huestis MA. Simultaneous quantification of 28 synthetic cathinones and metabolites in urine by liquid chromatography-high resolution mass spectrometry. Anal Bioanal Chem. 2013;405(29):9437–9448. doi: 10.1007/s00216-013-7386-z. [DOI] [PubMed] [Google Scholar]
- 19.Krouwer JS, Rabinowitz R. How to improve estimates of imprecision. Clinical Chemistry. 1984;30(2):290–292. [PubMed] [Google Scholar]
- 20.Chesher D. Evaluating assay precision. Clin Biochem Rev. 2008;29(Suppl 1):S23–26. [PMC free article] [PubMed] [Google Scholar]
- 21.Matuszewski BK, Constanzer ML, Chavez-Eng CM. Strategies for the assessment of matrix effect in quantitative bioanalytical methods based on HPLC-MS/MS. Anal Chem. 2003;75(13):3019–3030. doi: 10.1021/ac020361s. [DOI] [PubMed] [Google Scholar]
- 22.Scheidweiler KB, Ladenheim B, Barnes AJ, Cadet JL, Huestis MA. (±)-3,4-methylenedioxymethamphetamine and metabolite disposition in plasma and striatum of wild-type and multidrug resistance protein 1a knock-out mice. Journal of Analytical Toxicology. 2011;35(7):470–480. doi: 10.1093/anatox/35.7.470. [DOI] [PMC free article] [PubMed] [Google Scholar]
- 23.Mueller M, Kolbrich-Spargo E, Peters F, Huestis M, Ricaurte G, Maurer H. Hydrolysis of 3,4-methylenedioxymethamphetamine (MDMA) metabolite conjugates in human, squirrel monkey, and rat plasma. Analytical and bioanalytical chemistry. 2009;393(6–7):1607–1617. doi: 10.1007/s00216-009-2607-1. [DOI] [PMC free article] [PubMed] [Google Scholar]
- 24.Wang CC, Hartmann-Fischbach P, Krueger TR, Wells TL, Feineman AR, Compton JC. Rapid and sensitive analysis of 3,4-methylenedioxypyrovalerone in equine plasma using liquid chromatography-tandem mass spectrometry. J Anal Toxicol. 2012;36(5):327–333. doi: 10.1093/jat/bks033. [DOI] [PubMed] [Google Scholar]
- 25.Kriikku P, Wilhelm L, Schwarz O, Rintatalo J. New designer drug of abuse: 3,4-Methylenedioxypyrovalerone (MDPV). Findings from apprehended drivers in Finland. Forensic Science International. 2011;210(1–3):195–200. doi: 10.1016/j.forsciint.2011.03.015. [DOI] [PubMed] [Google Scholar]
- 26.Marinetti LJ, Antonides HM. Analysis of synthetic cathinones commonly found in bath salts in human performance and postmortem toxicology: method development, drug distribution and interpretation of results. J Anal Toxicol. 2013;37(3):135–146. doi: 10.1093/jat/bks136. [DOI] [PubMed] [Google Scholar]
- 27.Segura M, Ortuno J, Farre M, McLure JA, Pujadas M, Pizarro N, Llebaria A, Joglar J, Roset PN, Segura J, de la Torre R. 3,4-Dihydroxymethamphetamine (HHMA). A major in vivo 3,4-methylenedioxymethamphetamine (MDMA) metabolite in humans. Chemical Research in Toxicology. 2001;14:1203–1208. doi: 10.1021/tx010051p. [DOI] [PubMed] [Google Scholar]
- 28.Mueller M, Peters FT, Ricaurte GA, Maurer HH. Validated liquid chromatographic-electrospray ionization mass spectrometric assay for simultaneous determination of 3,4-methylenedioxymethamphetamine and its metabolites 3,4-methylenedioxyamphetamine, 3,4-dihydroxymethamphetamine, and 4-hydroxy-3-methoxymethamphetamine in squirrel monkey plasma. J Chromatogr B Analyt Technol Biomed Life Sci. 2007;855(2):262–270. doi: 10.1016/j.jchromb.2007.06.034. [DOI] [PMC free article] [PubMed] [Google Scholar]
- 29.Johnson RD, Botch-Jones SR. The stability of four designer drugs: MDPV, mephedrone, BZP and TFMPP in three biological matrices under various storage conditions. J Anal Toxicol. 2013;37(2):51–55. doi: 10.1093/jat/bks138. [DOI] [PubMed] [Google Scholar]
Associated Data
This section collects any data citations, data availability statements, or supplementary materials included in this article.