


Abstract
Kaposi's sarcoma (KS) is an AIDS-defining cancer with aberrant neovascularization caused by KS-associated herpesvirus (KSHV). Although the interaction between HIV-1 and KSHV plays a pivotal role in promoting the aggressive manifestations of KS, the pathogenesis underlying AIDS-KS remains largely unknown. Here we examined HIV-1 Nef protein promotion of KSHV oncoprotein K1-induced angiogenesis. We showed that both internalized and ectopic expression of Nef in endothelial cells synergized with K1 to facilitate vascular tube formation and cell proliferation, and enhance angiogenesis in a chicken CAM model. In vivo experiments further indicated that Nef accelerated K1-induced angiogenesis and tumorigenesis in athymic nu/nu mice. Mechanistic studies revealed that Nef and K1 synergistically activated PI3K/AKT/mTOR signaling by downregulating PTEN. Furthermore, Nef and K1 induced cellular miR-718, which inhibited PTEN expression by directly targeting a seed sequence in the 3′ UTR of its mRNA. Inhibition of miR-718 expression increased PTEN synthesis and suppressed the synergistic effect of Nef- and K1-induced angiogenesis and tumorigenesis. These results indicate that, by targeting PTEN, miR-718 mediates Nef- and K1-induced angiogenesis via activation of AKT/mTOR signaling. Our results demonstrate an essential role of miR-718/AKT/mTOR axis in AIDS-KS and thus may represent an attractive therapeutic target.
INTRODUCTION
Kaposi's sarcoma-associated herpesvirus (KSHV) was originally identified in a biopsy from an acquired immunodeficiency syndrome-related Kaposi's sarcoma (AIDS-KS) patient (1). KSHV has since been linked to Kaposi's sarcoma (KS), primary effusion lymphoma (PEL) and a subset of multicentric Castleman's disease (MCD) (2). KS lesions are characterized by proliferating spindle cells (the tumor cells), abnormal and leaky vessels, extravasated red blood cells with hemosiderin deposits, and vast inflammatory infiltration (2).
KSHV encodes over 90 genes and more than two dozens viral microRNAs (miRNAs) derived from 12 precursor miRNAs (pre-miRNAs) (2,3). A panel of KSHV gene products have been shown to possess angiogenic and oncogenic properties, including ORF74 (viral G protein-coupled receptor, vGPCR), ORF73 (latency-associated nuclear antigen, LANA), ORF72 (viral cyclin, vCyclin), ORF71 (viral FLIP, vFLIP), ORF-K12 (Kaposin), ORF-K9 (viral interferon-regulatory factor, vIRF), ORF-K2 (viral interleukin-6, vIL-6), ORF-K1 (a glycoprotein) and several viral miRNAs (4–6). Among them, the type 1 membrane glycoprotein K1, encoded by the first ORF in the KSHV genome, has multiple roles in cellular signal transduction and viral lytic reactivation. For instance, transgenic mice expressing the K1 gene not only developed tumors with features resembling the spindle-cell sarcomatoid tumor and lymphoma, but also showed constitutive activation of nuclear factor-κB and expression of basic fibroblast growth factor (7). K1 blocks Fas-mediated apoptosis in an immunoreceptor tyrosine-based activation motif (ITAM) signaling-independent manner through the association of the immunoglobulin (Ig)-like domain of K1 with Fas and prevention of FasL binding (8,9). In addition, K1 upregulates the PI3K pathway in B lymphocytes to protect cells from forkhead transcription factor- and Fas-mediated apoptosis (10).
KSHV infection is necessary but not sufficient for the development of KS. As the most important co-factor, HIV-1 promotes the pathogenesis of KS. Compared with other types of KS, including classical KS, endemic KS and iatrogenic KS, AIDS-KS is much more aggressive, disseminated and resistant against treatment (11). Previous studies have shown that KS tumor cells are not infected with HIV-1; thus, it is widely accepted that HIV-1 does not play a direct oncogenic role in AIDS-KS. However, current evidence strongly supports a role for HIV-1 in promoting the initiation and progression of KS through several mechanisms including production of HIV-1-encoded and secreted proteins and induction of inflammatory cytokine expression in addition to induction of immunosuppression (12–14). For instance, HIV-1-encoded Tat induces growth, migration, invasion and adhesion of both endothelial cells and KS tumor cells (15,16). We and others have demonstrated that Tat not only triggers KSHV reactivation from latency (17), but also accelerates tumor progression induced by KSHV-encoded oncoproteins including Kaposin A, vIL-6 and vGPCR (18–20).
Besides Tat, HIV-1 negative factor (Nef) is a 27-kDa myristoylated protein produced early during HIV infection and translated from multiple spliced viral mRNAs (21). Nef can interact with a multitude of cellular factors and induce complex changes in trafficking, signal transduction and gene expression that together converge to promote viral replication and immune evasion. Importantly, Nef can be released from infected cells and present in the plasma of HIV-infected individuals (22–27). The concentration of soluble Nef in the serum ranges from 1 to 10 ng/ml (25,28). Like Tat, circulating Nef can be taken up by several types of cells to regulate cellular function, such as B cells (29). For example, our recent studies indicated soluble Nef protein can be internalized by PEL cells, which led to the promotion of KSHV latency by inhibiting viral lytic replication (30). Although there is no evidence that HIV-1 directly infects endothelial cells, Nef is found in the pulmonary arterial endothelial cells of AIDS patients (31), indicating that Nef exists in endothelial cells in the absence of an HIV active infection. It is thus tempting to speculate that the internalization of Nef into endothelial cells may regulate angiogenesis induced by KSHV infection. Of particular interest, we have recently demonstrated that soluble Nef protein can be taken up by endothelial cells, and both soluble and ectopic expression of Nef can accelerate KSHV vIL-6-induced cell proliferation and tumorigenesis by activating AKT signaling (32). These exciting observations have prompted us to investigate the interactions of Nef with other KSHV oncoproteins in addition to vIL-6, and their roles in KSHV-induced angiogenesis.
miRNAs post-transcriptionally regulate the expression of genes by targeting their 3′ untranslated regions (UTRs). Recent studies have shown that, by regulating viral genes or diverse host cellular pathways, both cellular and KSHV miRNAs may play significant roles in the latency, immune evasion and pathogenesis of KSHV (6,30,33–55). However, whether cellular miRNAs contribute to KSHV and HIV-induced angiogenesis remains largely unknown.
In this study, we have revealed that HIV-1 Nef protein promotes KSHV K1-induced angiogenesis in both chicken chorioallantoic membrane (CAM) and nude mice models. Furthermore, we found that the phosphatase and tensin homolog deleted on chromosome 10 (PTEN)/protein kinase B (AKT)/mechanistic target of rapamycin (mTOR) signaling was involved in this process. Finally, we identified a cellular miR-718 that mediated Nef and K1 synergistic promotion of angiogenesis by directly targeting PTEN to activate the AKT/mTOR pathway. This is the first study that reports the involvement of a cellular miRNA in the angiogenesis induced by KSHV and HIV proteins.
MATERIALS AND METHODS
Cells, plasmids, transfection and reagents
HEK293T and EA.hy926 cells (catalog #CRL-2922™; ATCC, Manassas, VA, USA) were cultured as previously described (18,56). EA.hy926 was established by fusing primary human umbilical vein cells with a thioguanine-resistant clone of A549 (a human lung carcinoma cell line) in the presence of polyethylene glycol, and the hybrid clones were subsequently selected in hypoxanthine-aminopterin-thymidine (HAT) medium and screened for factor VIII-related antigen. Primary human umbilical vein endothelial cells (HUVECs) were cultured and maintained in complete EBM-2 culture media (LONZA, Allendale, NJ, USA) as described (57). HUVECs were used between passages 3 and 6. LipofectamineTM 2000 transfection reagent was used according to the manufacturer's instructions (Invitrogen). Transfections of HUVECs were performed with the Effectence transfection reagent (Qiagen, Valencia, CA, USA). The expression plasmid of human PTEN cDNA construct (pPTEN) with His tag was cloned in pcDNA3.1 vector as previously described (58). The construct pGL3-Luc-PTEN 3′UTR (WT PTEN) contained the full length of the PTEN 3′UTR sequence in pGL-3 vector plasmid (Promega, Shanghai, China). A PTEN-expressing plasmid 3×His-PTEN-3′UTR also bearing the full 3′UTR sequences from pGL3-Luc-PTEN 3′UTR was constructed in pcDNA3.1. The plasmid pEGFP-N2 was used to calibrate the efficacy of transfection. The specific inhibitor of mTOR, rapamycin, was purchased from Sigma (St. Louis, MO, USA). Recombinant full-length myristoylated wild-type HIV-1 Nef protein (myr2–210, C210S, SF2 strain) with a C-terminal His tag was obtained from Abcam (ab90462; Cambridge, MA, USA). We used 50 ng/ml of Nef for the experiments as described in our previous studies (30,32).
Production and transduction of lentivirus
The lentiviral plasmid system, the self-inactivating pHAGE-CMV-MCS-IzsGreen transferring plasmid, was used in this study (20), and a 923-bp fragment of KSHV K1 cDNA amplified from pCI-neo-K1-Flag was inserted into the above pHAGE transferring vector to generate recombinant pHAGE-K1 with a flag tag. The virus-packaging cells HEK293T were seeded 24 h before co-transfection of pHAGE-K1, packaging vector psPAX2 and envelope vector pMD2.G. The virus containing supernatant was collected 48 h after transfection. The titers of lentivirus-K1, designated as K1, were determined to be about 1 × 10⁷ to 1 × 10⁸ transducing units (TU)/ml on HEK293T cells. The lentivirus Nef and their vector control, designated as Nef and Mock, respectively, were produced as previously described (32). In this study, HUVECs were treated with soluble Nef protein, while EA.hy926 cells were transduced with Nef. Specifically, HUVECs were first transduced with K1 and then treated with soluble Nef protein, while EA.hy926 cells were transduced with both K1 and Nef.
Western blot and antibodies
Western blot was performed as previously described (17). Anti-vascular endothelial growth factor (VEGF) rabbit polyclonal antibody (pAb), anti-glyceraldehyde-3-phosphate dehydrogenase mouse monoclonal antibody (mAb), anti-α-Tubulin mouse mAb, and horseradish peroxidase (HRP)-conjugated goat anti-mouse and anti-rabbit IgG were purchased from Santa Cruz Biotechnologies (Santa Cruz, CA, USA). Anti-Flag M2 rabbit mAb, anti-phospho-PTEN (Ser380) rabbit pAb, anti-PTEN rabbit pAb, anti-phospho-phosphatidylinositol 3-kinase (PI3K) [p85(Tyr458)/p55(Tyr199)] rabbit pAb, anti-PI3K rabbit pAb, anti-phospho-AKT (Ser473) mouse mAb, anti-AKT mouse mAb, anti-phospho-mTOR (Ser2448) rabbit pAb and anti-His mouse mAb were purchased from Cell Signaling Technology (Beverly, MA, USA). Anti-smooth muscle actin (SMA) rabbit pAb was purchased from Abbiotec™ (San Diego, CA, USA). Anti-green fluorescent protein (GFP) mouse mAb was purchased from Beyotime Institute of Biotechnology (Nantong, Jiangsu, China).
Cell proliferation assay
Cell Count Kit-8 was purchased from Dojindo Molecular Technologies (Tokyo, Japan) and used to examine cell proliferation according to the manufacturer's instructions.
Plate colony formation assay
To evaluate the ability of cell proliferation, the plate colony formation assay was performed as described elsewhere (59). Briefly, endothelial cells (about 2 × 10²) were seeded in each well of 12-well plates with complete medium. Cultures were supplemented with complete medium per week. Cells were then fixed in methanol/glacial acetic acid (7:1), washed with water and stained with crystal violet (0.2 g/l). Colonies were scored 14–21 days after seeding the cells.
Microtubule formation assay
Microtubule formation assay was performed as previously described (60). Briefly, 48-well plates were coated at 4°C with 100 μl Matrigel solution (BD Bioscience, New Bedford, MA, USA) diluted at 1:1 in cell culture medium. The plate was allowed to solidify for 1 h at 37°C before cell seeding. Endothelial cells in conditioned medium were seeded at about 2 × 10⁴ per well. After incubation at 37°C for 16 h, photographs were taken from three randomly selected fields of each well. The angiogenesis index was calculated according to the formula described elsewhere (60).
Chicken CAM assay
Chicken CAM assay was performed as previously described (20). Briefly, White Leghorn fertilized chicken eggs were incubated at 37°C under constant humidity. Endothelial cells at about 1 × 10⁶ were mixed with Matrigel at 1:1 ratio and implanted onto the CAMs of chicken embryo at day 9. The blood vessel branches on the CAM were counted by three observers in a double-blinded manner. Tumor angiogenesis was measured 4–5 days after the implantation. The representative tumors were photographed.
Matrigel plug assay for angiogenesis in nude mice
Matrigel plug assay for angiogenesis in nude mice was performed as previously described (32). Briefly, 3–4-week-old male athymic BALB/c nu/nu mice were purchased from Shanghai Slac Laboratory Animal Center (Shanghai, China), and housed under specific pathogen-free conditions. The treated cells were harvested at subconfluence, washed with phosphate-buffered saline (PBS) and resuspended in serum-free medium. Cell aliquots (0.2 ml) were mixed with 0.4 ml of High Concentration Matrigel (BD Biosciences), and the mixture was immediately injected subcutaneously (s.c.) into the left flanks of nude mice. At day 10 after the injection, the mice were sacrificed, and the Matrigel plugs were removed from the mice. The hemoglobin content of the Matrigel was determined using Drabkin's reagent kit according to the manufacturer's instructions (Sigma-Aldrich). The final hemoglobin level was determined by spectrophotometric analysis at 540 nm.
Tumorigenicity assay in nude mice
Tumorigenicity assay in nude mice was performed as previously described (20). Briefly, the tumorigenic potentials of the cells were examined with 3–4-week-old male athymic BALB/c nu/nu mice maintained under pathogen-free conditions. Cells (1 × 10⁷ cells in 100 μl of PBS) were injected s.c. into one site at the left flank. The nude mice were monitored every day for the appearance of tumors. Tumor size was estimated by two-dimensional caliper measurement with the following formula: width2 × length × 0.52. Tumor-bearing mice were sacrificed, and tumor samples were collected and used for frozen sections, formalin-fixed and paraffin-embedded sections, and Western blot, respectively.
To assess the effect of rapamycin on tumor growth, the tumors induced by K1-, Nef-, or K1- and Nef-expressing cells were treated with either solvent control (dimethyl sulfoxide, DMSO) or rapamycin (2.5 mg/kg/day) when the tumor sizes reached an average volume of 100 mm3 (about 10 days post-injection). A total of six groups were included in the experiments: K1 cells treated with DMSO, K1 cells treated with rapamycin, Nef cells treated with DMSO, Nef cells treated with rapamycin, K1 and Nef cells treated with DMSO, and K1 and Nef cells treated with rapamycin. Solvent control (DMSO) or rapamycin was administered daily by intraperitoneal injections for 5 consecutive days.
Immunohistochemistry
Informative sections of frozen or formalin-fixed, paraffin-embedded tumor from CAM or nude mice were immunostained as previously described (18). Formalin-fixed paraffin-embedded tissue samples from CAMs or nude mice were immunostained with the indicated antibodies.
miRNA microarray analysis
miRNA microarray analysis was performed as previously described (30,61). Total RNA from EA.hy926 cells either Mock-infected or infected with K1 or Nef lentivirus alone, or co-infected with both K1 and Nef lentiviruses for 72 h were isolated with Trizol reagent (Invitrogen). The miRNA fraction was further purified using a mirVanaTM miRNA isolation kit (Ambion, Austin, TX, USA). The isolated miRNAs from the four parallel infected cells were then labeled with Hy3 using the miRCURYTM Array Labelling Kit (Exiqon, Vedbaek, Denmark) and hybridized individually on miRCURYTM LNA microRNA Arrays (v 8.0; Exiqon). Microarray images were acquired using a Genepix 4000B scanner (Axon Instruments, Union City, CA, USA), processed and analyzed with Genepix Pro 6.0 software (Axon Instruments). EA.hy926 cells transduced with Mock were used as the control.
Luciferase reporter assay
miRNA mimics, PTEN luciferase reporter DNA and Renilla vector pRL-TK (Promega) were co-transfected into HEK293T cells (about 1 × 10⁵) for 48 h. Relative luciferase activity was assayed using the Promega dual-luciferase reporter assay system. All data points were the averages of results from at least three independent transfections.
miRNA mimics, suppressors and sponge
Synthetic miR-718 mimic, inhibitor and corresponding miRNA negative control were obtained from Shanghai GenePharma Company (Shanghai, China). This miRNA mimic's and corresponding negative control's sequences are 5′-CUU CCG CCC CGC CGG GCG UCG-3′ and 5′-UUC UCC GAA CGU GUC ACG UTT-3′, respectively. The miRNAs sponge contains multiple and tandem-binding sites for an miRNA of interest (62). When vectors encoding the miRNA sponges are transfected into cultured cells, they can yield abundant expression of competitive inhibitor transcripts. Here, miR-718 sponge was constructed by annealing sponge primers: 5′-AAT TTC GAC GCC CGG CCG GCG GAA GCG ATC GAC GCC CGG CCG GCG GAA GAC CGG TCG ACG CCC GGC CGG CGG AAG GAA TTC CGG CGG-3′ and 5′-GAT CCC GCC GGA ATT CCT TCC GCC GGC CGG GCG TCG ACC GGT CTT CCG CCG GCC GGG CGT CGA TCG CTT CCG CCG GCC GGG CGT CGA-3′; and cloned into vector pCDH-CMV-MCS-EF1-copGFP (System Bioscience). This annealing product contained the sequence of three tandem-binding sites of miR-718 with mismatches in the middle portion to create a bulge to protect against endonucleolytic cleavage by Argonaute 2. Accordingly, the empty vector pCDH-CMV-MCS-EF1-copGFP (named pCDH) was used as the control for the miR-718 sponge.
Real-time quantitative reverse transcription polymerase chain reaction
Real-time quantification of miRNAs was performed by stem-loop real-time quantitative reverse transcription polymerase chain reaction (RT-qPCR) (34).
Statistical analysis
Numerical data were expressed as mean ± SD. Two group comparisons were analyzed by two-sided Student's t-test. P values were calculated, and P < 0.05 was considered significant. All experiments were performed at least in triplicate if not mentioned.
RESULTS
Nef synergizes with K1 to activate PI3K/AKT/mTOR signaling, and induce cell proliferation and tube formation of endothelial cells
Because K1 is a KSHV oncogene and induces angiogenesis (7,8,63), we determined the synergistic effect of Nef with K1. Both K1 and Nef have been shown to activate the PI3K/AKT pathway (10,32). Indeed, Western blotting showed that soluble Nef protein, or ectopic expression of Nef or K1 alone increased the levels of phosphorylated PI3K, AKT and mTOR in both primary HUVECs and EA.hy926 cells (Figure 1A). Significantly, the presence of both Nef and K1 synergized with each other and further increased the levels of these phosphorylated proteins. Consistent with these results, Nef and K1 decreased the level of PTEN, a dual-specificity protein and lipid phosphatase that counteracts the PI3K activity and functions as a major tumor suppressor (Figure 1A).
Figure 1.
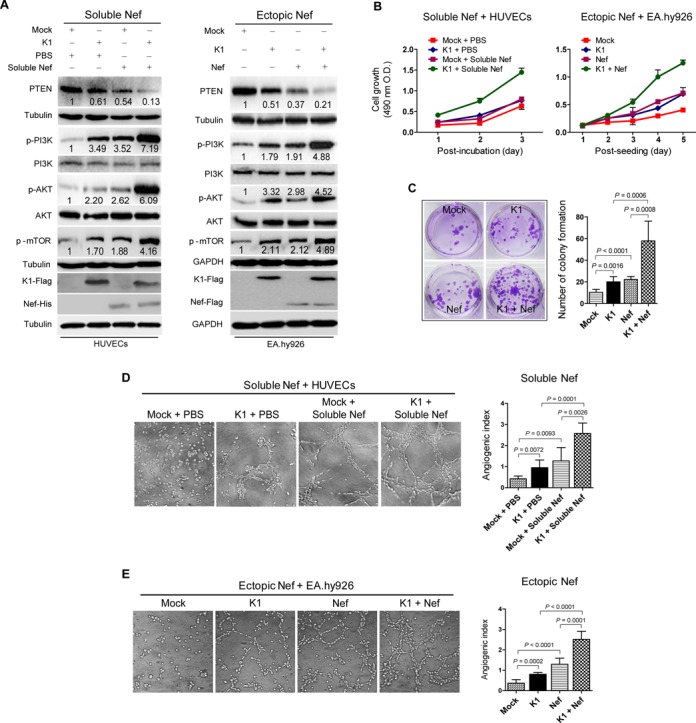
Nef synergizes with K1 to activate PI3K/AKT/mTOR signaling, and promote cell proliferation and microtubule formation. (A) Western blot analysis of total PTEN and phosphorylation levels of PI3K, AKT and mTOR in HUVECs transduced with K1, incubated with soluble Nef protein for 72 h or both (left panel), and in EA.hy926 cells transduced with K1, Nef or both (right panel), respectively. Numbers labeled under the bands were the relative intensities of the bands after calibrating for loading using house-keeping or nonphosphorylated proteins. The relative value of proteins in Mock + PBS group or Mock group was considered as ‘1’. The amounts of K1 and Nef proteins expressed by lentiviral transduction were examined with their respective antibodies while soluble Nef protein was examined with a His-tag antibody. (B) Cell proliferation examined with a Cell Counting Kit-8 assay. Cell proliferation of HUVECs and EA.hy926 cells treated as described in (A) was determined. Data represent mean ± SD determined from three independent experiments (n = 3), each experiment containing six technical replicates. (C) Plate colony formation assay. EA.hy926 cells treated as described in (A) were examined for colony formation. The photographs depict the colony formation after 2 weeks of seeding (left panel; original magnification, ×100), and the graph bars represent the mean ± SD (right panel) from three independent experiments (n = 3), each experiment containing six technical replicates. (D) Matrigel assay analysis of tube formation in HUVECs incubated with soluble Nef protein. Tube formation of HUVECs treated as described in (A) was determined. The photographs of microtubules were captured at 16 h post seeding (Soluble Nef + HUVECs; left panel; original magnification, × 100) and the graph bars represent the mean ± SD (right panel) from three independent experiments (n = 3), each experiment containing six technical replicates. (E) Matrigel assay analysis of tube formation in EA.hy926 cells expressing Nef. Tube formation of EA.hy926 cells treated as described in (A) was determined. The photographs of microtubules were taken at 16 h post incubation (Ectopic Nef + EA.hy926; left panel; original magnification, ×100). Data represent mean ± SD (right panel) from three independent experiments (n = 3), each experiment containing six technical replicates.
Since activated AKT promotes cell proliferation, we examined the effect of Nef and K1 on the proliferation of endothelial cell using Cell Counting Kit-8 assays. As shown in Figure 1B, both Nef and K1 increased the proliferation rates of HUVECs and EA.hy926 cells. The presence of both Nef and K1 synergized with each other and further increase the cell proliferation rate (Figure 1B). The plate colony formation assay can also be used to evaluate cell proliferation (59). In this assay, Nef and K1 alone increased colony formation of EA.hy926 cells and also synergized with each other and further increase the proliferation of EA.hy926 cells (Figure 1C).
Activated AKT can promote angiogenesis (64). Both K1 and Nef have angiogenic activities (7,8,32,63). Thus, we further examined the angiogenic effects of these two proteins using a tube formation assay. Compared to control cells (Mock + PBS), transduction with K1 or incubation with soluble Nef protein increased tube formation by 2.24- and 2.99-fold in HUVECs, respectively, while expression of K1 plus incubation of soluble Nef protein further increased tube formation by 6.05-fold (Figure 1D). Similar results were also observed in EA.hy926 cells transduced with K1, ectopically expressed with Nef or with combined expression of K1 and ectopic Nef (Figure 1E).
Together these results indicate that Nef synergizes with K1 to activate the PI3K/AKT/mTOR pathway, and induce cell proliferation, and vascular tube formation.
Nef synergizes with K1 to promote angiogenesis by activating PI3K/AKT/mTOR signaling in vivo
Based on the above findings in vitro, we examined the synergistic effect of Nef and K1 on angiogenesis in the CAM model. Compared to control cells (Mock + PBS), lentivirus-mediated K1 expression and addition of soluble Nef protein alone in HUVECs promoted angiogenesis by 1.61- and 1.44-fold in the CAM model (Figure 2A and B). K1 and Nef protein synergized with each other and increased the angiogenic index by 4.25-fold. Similar results were also observed with ectopically Nef-expressing EA.hy926 cells (Figure 2C).
Figure 2.
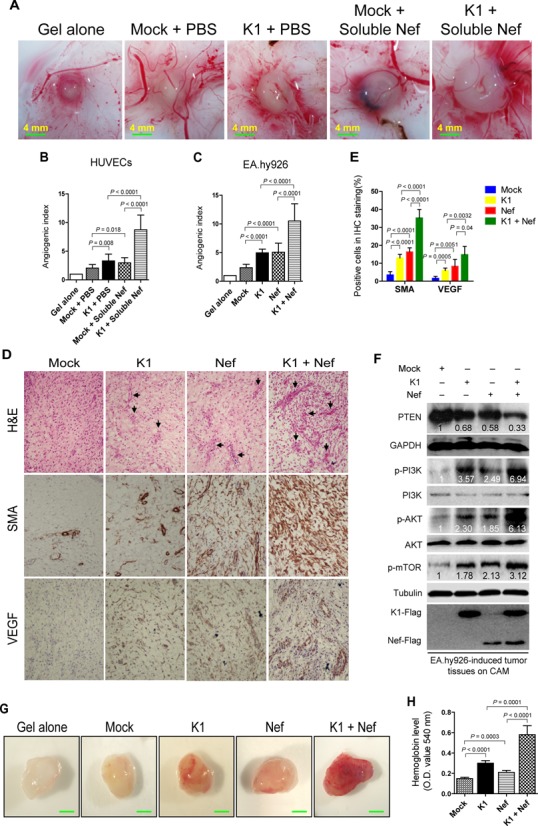
Nef promotes K1-induced angiogenesis and tumorigenesis in the CAM and nude mice models. (A) Nef promoted K1-induced angiogenesis in HUVECs. HUVECs transduced with K1, incubated with soluble Nef protein for 72 h or both were mixed with Matrigel and subsequently implanted onto the CAM. Representative photographs of angiogenesis on the CAM are shown. (B) Quantification of results in (A). The number of blood vessels was normalized to that of Matrigel alone. Data represent mean ± SD from three independent experiments (n = 3), each experiment containing 10 technical replicates. (C) Nef enhanced K1-induced angiogenesis in EA.hy926 cells. EA.hy926 cells transduced with K1, Nef or both were mixed with Matrigel and subsequently implanted onto the CAM. The number of blood vessels was normalized to that of Matrigel alone. Data represent mean ± SD from three independent experiments (n = 3), each experiment containing 10 technical replicates. (D) Hematoxylin and eosin staining analysis of histologic features (top; original magnification, ×100) and immunohistochemical staining analysis of the expression of SMA and VEGF (middle and bottom; original magnification, ×200) in tumor tissues from the CAMs induced by EA.hy926 cells transduced with K1 and Nef. Black arrows point to neovascularization and hemorrhagic foci. (E) Quantification of results in (D). (F) Western blot analysis of total PTEN and phosphorylation levels of PI3K, AKT and mTOR in tumor tissues from the CAMs treated as in (D). (G) Nef enhanced K1-induced angiogenesis in nude mice. EA.hy926 cells transduced by K1, Nef or both were examined for their proangiogenic effects in Matrigel plug assay in nude mice as described in the ‘Materials and Methods’ section. Representative photographs of angiogenesis in the nude mice are shown. (H) The hemoglobin level of the Matrigel plugs treated as in (G) was determined with O.D. value at 540 nm. Data represent mean ± SD, each group with five tumors (n = 5). Three independent experiments were performed and similar results were obtained.
Hematoxylin and eosin (H&E) staining showed that the CAM tumors derived from the K1- or Nef-expressing EA.hy926 cells were highly neovascularized and contained hemorrhagic necrotic foci with irregular sizes and shapes (Figure 2D). These features were even more apparent in tumors derived from Nef- and K1 co-expressing EA.hy926 cells (Figure 2D). The levels of both SMA and VEGF were significantly increased in tumors derived from EA.hy926 cells expressing either K1 or Nef, and were further increased when K1 and Nef were co-expressed (Figure 2D and E). Western blots performed with the above tumor tissues revealed that K1 or Nef alone increased the levels of phosphorylated PI3K, AKT and mTOR, which were further enhanced when K1 and Nef were co-expressed. Consistently, Nef or K1 alone decreased the level of total PTEN, which was further downregulated when both proteins were expressed together (Figure 2F).
To confirm the synergistic effect of Nef and K1 on angiogenesis, the Matrigel plug assays were performed in nude mice. By detecting the hemoglobin content in the plug, which represents the relative angiogenesis index, expression of either Nef or K1 in EA.hy926 cells was shown to increase the hemoglobin content, while co-expression of both K1 and Nef further significantly increased the level of hemoglobin (Figure 2G and H).
To examine the role of PTEN/AKT/mTOR signaling in mediating the synergistic effect of Nef- and K1-induced angiogenesis, HUVECs expressing K1, HUVECs incubated with soluble Nef protein or both were transfected with pPTEN and subsequently implanted onto CAMs. Overexpression of PTEN completely inhibited angiogenesis induced by K1, soluble Nef or both in the HUVEC-implanted CAM model (Figure 3A). As expected, overexpression of PTEN led to the reduction of phosphorylated forms of AKT and mTOR, both of which are downstream of PTEN (Figure 3B). Next, we confirmed the above results with rapamycin, an mTOR inhibitor, in the EA.hy926 cell-implanted CAM model. The quantifications of blood vessels showed that rapamycin effectively suppressed the synergistic effect of Nef and K1 on angiogenesis (Figure 3C).
Figure 3.
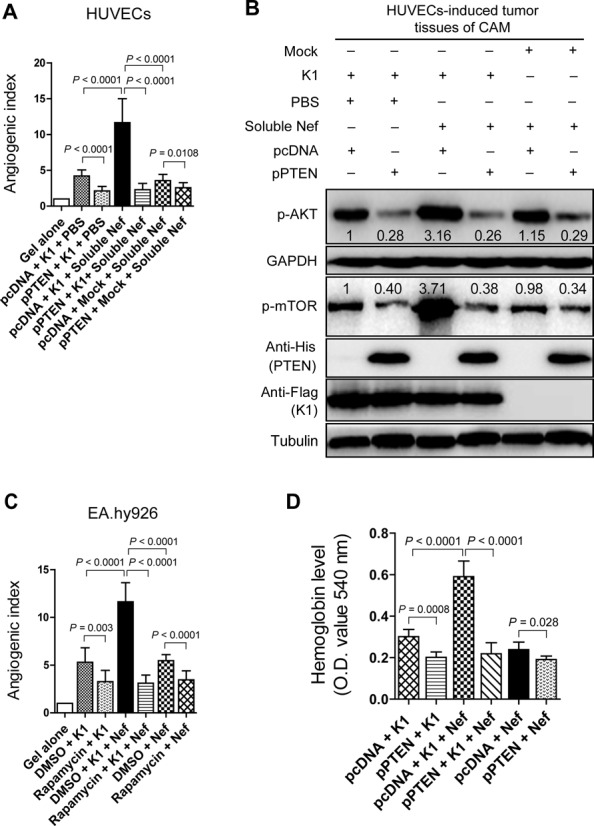
PTEN/AKT/mTOR pathway mediates K1- and Nef-induced angiogenesis in vivo. (A) Overexpression of PTEN suppressed the synergetic effect of soluble Nef protein on K1-induced angiogenesis in the CAM model. HUVECs transduced with K1 and incubated with soluble Nef protein for 72 h were transfected with pPTEN and a control plasmid (pcDNA) for 24 h. The treated cells were implanted onto the CAMs. The quantification of blood vessels is expressed as the mean ± SD from three independent experiments (n = 3), each experiment containing 10 technical replicates. (B) Western blot analysis of the phosphorylation levels of AKT and mTOR in tumor tissues from the CAMs treated as in (A). (C) Inhibition of mTOR activity suppressed the synergetic effect of ectopic Nef on K1-induced angiogenesis in the CAM model. EA.hy926 cells transduced with K1 and Nef were treated with rapamycin (100 nM) or the control reagent, DMSO. The collected cells were implanted onto the CAMs. The quantification of blood vessels is expressed as the mean ± SD from three independent experiments (n = 3), each experiment containing 10 technical replicates. (D) Overexpression of PTEN suppressed the synergetic effect of ectopic Nef on K1-induced angiogenesis in nude mice. EA.hy926 cells transduced with K1 and Nef were transfected with pPTEN and pcDNA for 72 h. The collected cells were examined for their proangiogenic effects in Matrigel plug assay in nude mice as described in the ‘Materials and Methods’ section. The hemoglobin content of the Matrigel plugs was determined with O.D. value at 540 nm. Data represent mean ± SD. n = 5 tumors per group. Three independent experiments were performed and gave similar results.
Consistent with the above angiogenic phenotype, in the Matrigel plug assays, overexpression of PTEN significantly reduced the hemoglobin content induced by Nef, K1 or both in nude mice (Figure 3D).
Collectively, these data indicate that Nef synergizes with K1 to promote angiogenesis by activating PI3K/AKT/mTOR and inactivating PTEN signals in the endothelial cell-implanted CAM and nude mice models.
PTEN/AKT/mTOR pathway mediates Nef- and K1-induced tumorigenesis
We next investigated the effect of Nef and K1 on the growth of tumors in nude mice. Tumors of EA.hy926 cells expressing either Nef or K1 alone grew faster and had a shorter latency than the control group (Mock) had (Figure 4A–C). Co-expression of Nef and K1 further promoted tumor growth with the fastest growth rate and the shortest tumor latency (Figure 4A–C). H&E staining of the tumors showed extensive dense neovascularization and hemorrhagic necrotic foci in K1- or Nef-induced tumors, which became even more prominent in the tumors induced by both K1 and Nef (Figure 4D). Immunohistochemical staining of tumors indicated that there were more SMA- and VEGF-positive cells in tumors induced by K1 or Nef, which were further increased in tumors induced by both K1 and Nef (Figure 4D and E).
Figure 4.
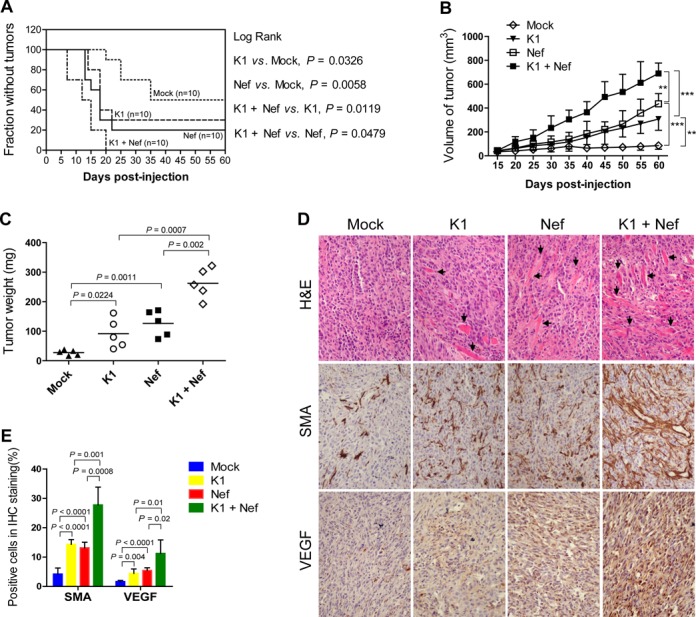
Nef promotes K1 induction of tumors in nude mice. (A) A Kaplan–Meier plot for the time until the appearance of palpable tumors. EA.hy926 cells transduced by K1, Nef or both were s.c. injected into the left flanks of nude mice. The palpable tumor appearances of mice were daily monitored for 60 days. (B) Nef enhanced K1-induced tumorigenesis indicated by tumor size. The sizes of tumors from nude mice that treated as in (A) were determined by two-dimensional caliper measurements. Data represent mean ± SD. n = 5 tumors per group. Two independent experiments were performed and gave similar results. ** and *** indicate P < 0.01 and P < 0.001 for Student's t-test, respectively. (C) Nef enhanced K1-induced tumorigenesis indicated by tumor weight. The tumors from nude mice that treated as in (A) were removed and weighed. Scatter plots represent the weight of independent tumors from different groups. Data represent mean ± SD, each group with five tumors (n = 5). Two independent experiments were performed and similar results were obtained. (D) H&E staining analysis of histological features (top; original magnification, ×100) and immunohistochemical staining analysis of the expression of SMA and VEGF (middle and bottom; original magnification, ×200) in tumor tissues from nude mice treated as in (A). Black arrows point to neovascularization and hemorrhagic foci. (E) Quantification of results in (D).
The tumors were further used to determine whether PTEN/AKT/mTOR pathway was involved in the synergistic effect of Nef and K1 on tumorigenesis in vivo. As shown in Figure 5A, the phosphorylated forms of PI3K, AKT and mTOR were increased in tumors induced by K1 or Nef, which were even more striking in tumors induced by both K1 and Nef, whereas the levels of total PTEN were reduced accordingly. We transfected the K1- and Nef-expressing EA.hy926 cells with pPTEN and subsequently injected them into nude mice. As shown in Figure 5B and C, expression of pPTEN inhibited the growth of tumors induced by K1, Nef or both. Similarly, treatment with rapamycin effectively suppressed the growth of tumors induced by K1, Nef or both (Figure 5D and E).
Figure 5.
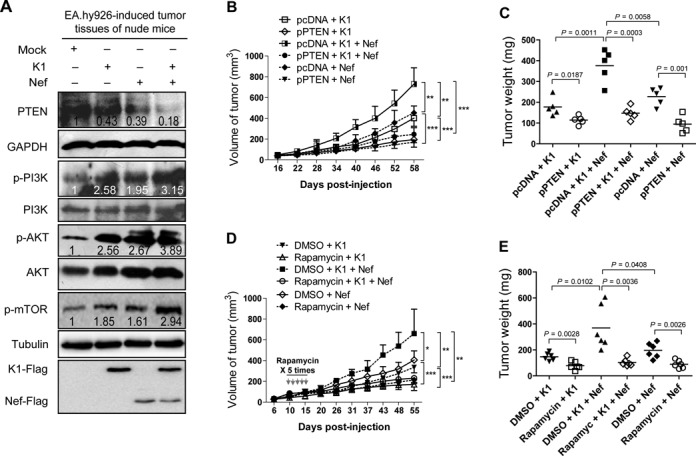
PTEN/AKT/mTOR pathway mediates K1- and Nef-induced tumorigenesis in nude mice. (A) Western blot analysis of total PTEN and phosphorylation levels of PI3K, AKT and mTOR in tumor tissues from nude mice induced by EA.hy926 cells transduced with K1, Nef or both. Numbers labeled under the bands were the relative intensities of the bands after calibrating for loading with the house-keeping protein or their nonphosphorylated proteins. The relative value of proteins in the Mock group was considered as ‘1’. (B) PTEN inhibits Nef promotion of K1-induced tumorigenesis. EA.hy926 cells transduced with K1, Nef or both were transfected with pPTEN or the control plasmid and inoculated into nude mice to induce tumors. The mice were daily monitored for the appearance of tumors until 58 days. Tumor size was estimated by two-dimensional caliper measurement. Data represent mean ± SD, each group with five tumors (n = 5). Two independent experiments were performed and similar results were obtained. (C) PTEN inhibits Nef promotion of K1-induced tumorigenesis indicated by tumor's weight. The tumors from nude mice treated as in (B) were removed and weighed. Scatter plots represent the weight of independent tumors from different groups. Data represent mean ± SD, each group with five tumors (n = 5). Two independent experiments were performed and similar results were obtained. (D) Activation of mTOR signals is required for Nef promotion of K1-induced tumorigenesis indicated by tumor size. EA.hy926 cells transduced with K1 and Nef were injected (s.c.) into the left flanks of mice for xenograft formation. The mice received the treatments by intraperitoneal injection of rapamycin. The results are expressed as the mean ± SD, each group with five tumors (n = 5). Two independent experiments were performed and similar results were obtained. (E) Activation of mTOR signals is required for Nef promotion of K1-induced tumorigenesis indicated by tumor weight. The tumors from nude mice treated as in (D) were removed and weighed. Scatter plots represent the weight of independent tumors from different groups. Data reflect the mean ± SD. Data represent mean ± SD, each group with five tumors (n = 5). Two independent experiments were performed and similar results were obtained.
Taken together, these results indicate that PTEN/AKT/mTOR signaling contributes to the synergistic effect of Nef and K1 on tumor growth in vivo.
miR-718 directly targets PTEN
Because PTEN plays a pivotal role in Nef- and K1-induced angiogenesis, we further investigated the mechanism regulating PTEN expression. We performed a microarray screening to identify miRNAs that were regulated by Nef and K1, and identified a number of cellular miRNAs that were consistently upregulated by K1, Nef or both in HUVECs (Figure 6A). We thus hypothesized that some of these miRNAs might regulate PTEN expression. Bioinformatics prediction for miRNA targets combined with the results of miRNA microarray identified nine miRNAs that had putative targeting sites in PTEN 3′UTR (Figure 6A). Luciferase reporter assay using PTEN 3′UTR luciferase reporter confirmed that, of the nine miRNAs, only cellular hsa-miR-718 (miR-718) significantly inhibited the PTEN 3′UTR reporter activity (Figure 6B). RT-qPCR confirmed that both K1 and Nef indeed increased the expression of miR-718 in both HUVECs and EA.hy926 cells (Figure 6C). In a luciferase reporter assay, miR-718 inhibited the reporter activity of PTEN 3′UTR in a dose-dependent fashion (Figure 6D).
Figure 6.
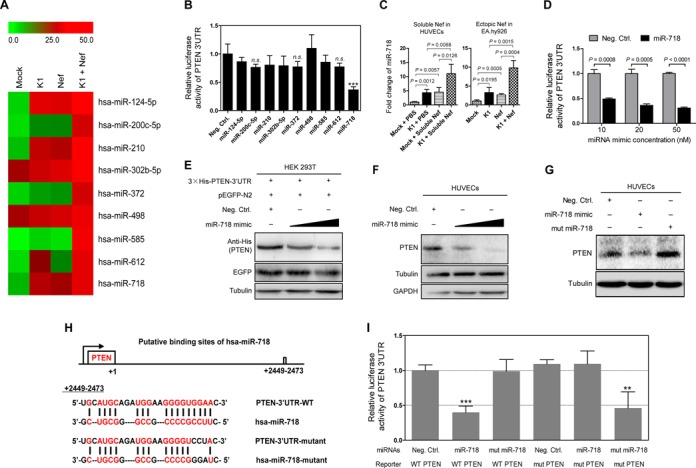
miR-718 mediates K1 and Nef regulation of PTEN-AKT pathway by directly targeting PTEN 3′UTR. (A) Heatmap of top miRNAs with differential expression in EA.hy926 cells transduced with K1, Nef or both. miRNA array analysis was performed and pseudo-color represents intensity scale of K1, Nef and K1 + Nef infection groups versus Mock infection group. Green and red denote low and high expression, respectively. (B) Examination of the inhibition of a PTEN 3′UTR luciferase report by miRNAs selected from miRNA microarray analysis. 293T cells were co-transfected with negative control nucleotide of miRNA (Neg. Ctrl.) or mimics of selected miRNAs together with the pGL3-Luc-PTEN 3′UTR luciferase reporter and assayed for luciferase activity. The data represent the mean ± SD from three independent experiments (n = 3), each experiment containing four technical replicates. *** indicates P < 0.001 for Student's t-test versus Neg. Ctrl. Group. n.s. denotes ‘not significant’. (C) miR-718 expression in HUVECs transduced with K1, incubated with soluble Nef protein for 72 h or both (Soluble Nef in HUVECs; left panel) and in EA.hy926 cells transduced with K1, Nef or both (Ectopic Nef in EA.hy926; right panel), were quantitated by RT-qPCR. Relative quantities of miRNAs expression are represented on the y-axis. The data represent the mean ± SD from three independent experiments (n = 3), each experiment containing four technical replicates. (D) Luciferase assay of pGL3-Luc-PTEN 3′UTR reporter co-transfected with increasing amounts (10, 20 and 50 nM) of miRNA negative control nucleotide (Neg. Ctrl.) or miR-718 mimic (miR-718) for 48 h in 293T cells. The data represent the mean ± SD from three independent experiments (n = 3), each experiment containing four technical replicates. (E) miR-718 targets exogenous PTEN under the control of its native 3′UTR in HEK 293T cells. A genomic PTEN expression vector, 3×His-PTEN-3′UTR, bearing the full 3′UTR sequences was co-transfected with pEGFP and increasing amounts (10 and 50 nM) mimic of miR-718 into HEK 293T cells for 48 h. The transfected cells were collected and Western blot was performed with the indicated antibodies. (F) miR-718 targets endogenous PTEN in HUVECs transfected with increasing amounts (10 and 50 nM) mimic of miR-718 for 48 h. The transfected cells were collected and Western blot was performed with the indicated antibodies. (G) Mutant miR-718 fails to target endogenous PTEN in HUVECs transfected with miRNA negative control nucleotide, miR-718 mimic or mutant mimic of miR-718 lacking the seed sequences for 48 h in 293T cells. The transfected cells were collected and Western blot was performed with the indicated antibodies. (H) Schematic illustration of the putative seed sequence of miR-718 within PTEN 3′UTR and mutagenesis of binding site in the 3′UTR of PTEN or miR-718 mimic. (I) Effect of seed mutagenesis or mutation of the putative binding site on the PTEN 3′UTR reporter. PTEN wild type (WT PTEN) were co-transfected with miRNA negative control nucleotide (Neg. Ctrl.), natural (miR-718) or mutant miR-718 (mut miR-718) into 293T cells, while mutant 3’UTR construct (mut PTEN) were also co-transfected with miRNA negative control nucleotide (Neg. Ctrl.), natural (miR-718) or mutant miR-718 (mut miR-718). After co-transfection for 48 h, 293T cells were assayed for luciferase activity. The data represent the mean ± SD from three independent experiments (n = 3), each experiment containing four technical replicates. **P < 0.01 and ***P < 0.001 by Student's t-test versus.
To determine the direct effect of miR-718 on PTEN expression, the mimic of miR-718 was transiently co-transfected with a PTEN expression plasmid under the control of the PTEN 3′UTR, 3×His-PTEN-3′UTR into HEK293T cells. A GFP expression plasmid pEGFP-N2 was included to calibrate the transfection efficacy. Western blot showed that miR-718 strongly inhibited the PTEN expression in a dose-dependent manner (Figure 6E). Importantly, mimic of miR-718 suppressed the expression of endogenous PTEN in HUVECs, while a mutant mimic of miR-718 lacking the seed sequence did not (Figure 6F and G).
To confirm the specificity of miR-718 targeting of PTEN, we further performed 3′UTR mutagenesis analysis. We mutated the putative miR-718-binding site in the PTEN 3′UTR (Figure 6H). In the luciferase reporter assay, mutation of the putative binding site abolished the inhibitory effect of miR-718 on PTEN 3′UTR reporter activity, and a mutant mimic lacking the seed sequences also failed to inhibit the reporter activity of PTEN 3′UTR (Figure 6I). However, because the mutant mimic was designed to match the 3′UTR mutation, it exhibited a strong inhibitory effect on the mutant reporter (Figure 6I). These results indicated that miR-718 directly target PTEN 3′UTR.
miR-718 targets PTEN to mediate Nef- and K1-induced angiogenesis
We further determined whether miR-718 mediated Nef- and K1-induced angiogenesis. Tube formation assay was performed with HUVECs transduced with K1, incubated with soluble Nef protein or subjected to both treatments, and co-transfected with an inhibitor of miR-718 or a scrambled control. As shown in Figure 7A and B, miRNA suppressor of miR-718 blocked tube formation of HUVECs induced by K1, Nef or both.
Figure 7.
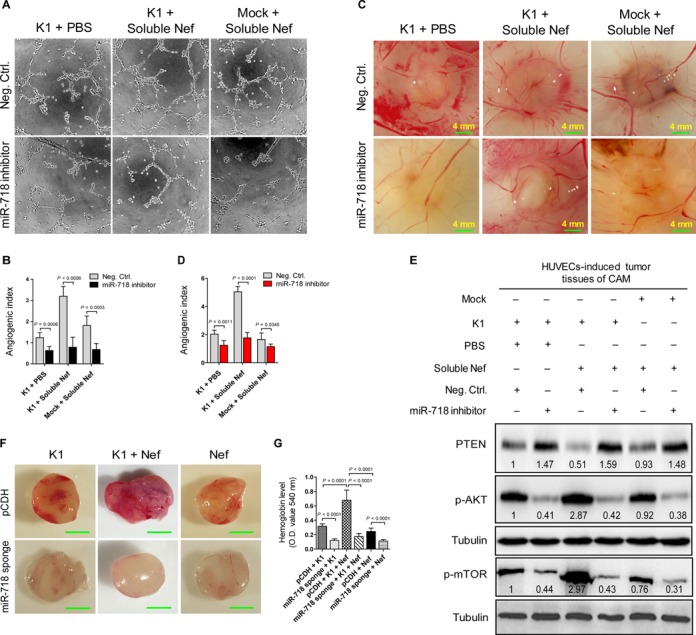
miR-718 mediates K1- and Nef-induced angiogenesis both in vitro and in vivo. (A) Matrigel assay analysis of microtubule formation. Tube formation assay was performed with HUVECs transduced with K1, incubated with soluble Nef protein for 72 h or both and further transfected with negative control nucleotide of miRNA (Neg. Ctrl.; top) or inhibitor of miR-718 (miR-718 inhibitor; bottom) for 48 h, respectively. The photographs of microtubules were captured at 16 h post seeding (original magnification, ×100). (B) Quantification of results in (A). The results represent the mean ± SD from three independent experiments (n = 3), each experiment containing six technical replicates. (C) Inhibition of miR-718 suppressed the enhanced effect of Nef on K1-induced angiogenesis. HUVECs transduced with K1, incubated with soluble Nef protein for 72 h or both were transfected with negative control nucleotide of miRNA (Neg. Ctrl.; top) or inhibitor of miR-718 (miR-718 inhibitor; bottom) for 48 h. The collected cells were mixed with Matrigel and subsequently implanted onto the CAM. Representative photographs of angiogenesis on the CAM are shown. (D) Quantification of results in (C). The number of blood vessels is expressed as the mean ± SD from three independent experiments (n = 3), each experiment containing six technical replicates. (E) Western blot analysis of total PTEN and phosphorylation levels of AKT and mTOR. The tumor tissues from CAM that treated as in (C) were collected and the total proteins of the tissues were extracted for Western blot. Numbers labeled under the bands were the relative intensities of the bands following calibration for loading with house-keeping protein tubulin. The relative value of proteins in K1 + PBS + Neg. Ctrl. group was considered as ‘1’. (F) Inhibition of miR-718 abolished the enhanced effect of Nef on K1-induced angiogenesis in nude mice. EA.hy926 cells transduced with K1, Nef or both were infected with control virus (pCDH; top) or miR-718 sponge (miR-718 sponge; bottom) for 72 h and further re-suspended in serum-free medium. As detailed in the ‘Materials and Methods’ section, the treated cells were injected (s.c.) into nude mice for 10 days and the Matrigel plugs were removed and analyzed. Representative photographs of angiogenesis in the nude mice are shown. (G) The hemoglobin level of the Matrigel plugs treated as in (F) was determined with O.D. value at 540 nm. Data represent mean ± SD, each group with six tumors (n = 6). Three independent experiments were performed and similar results were obtained.
Next, we examined the role of miR-718 in Nef- and K1-induced angiogenesis in the CAM model. HUVECs transduced with K1, incubated with soluble Nef alone or both were transfected with the miR-718 suppressor and subsequently implanted onto CAMs. Consistent with the in vitro results, repression of miR-718 function inhibited angiogenesis induced by K1, Nef or both (Figure 7C and D). Consistent with these observations, Western blotting showed that suppression of miR-718 with its inhibitor increased the expression of PTEN in CAM tumor tissues induced by HUVECs transduced with K1, incubated with soluble Nef or both. Consistent with these results, the levels of phosphorylated AKT and mTOR were markedly decreased (Figure 7E). Similar results were also observed in the Matrigel plug assays (Figure 7F and G). These results indicated that miR-718 mediated Nef- and K1-induced angiogenesis by targeting PTEN to activate AKT/mTOR pathway.
miR-718 mediates Nef- and K1-induced tumorigenesis
To examine the role of miR-718 in Nef- and K1-induced tumorigenesis in nude mice, K1- or Nef-expressing, or K1 and Nef co-expressing EA.hy926 cells were infected with the lentiviral miR-718 sponge and then s.c. injected into nude mice. As shown in Figure 8A–C, miR-718 sponge effectively repressed the growth of tumors induced by Nef, K1 or both. Western blot analysis showed that the expression of miR-718 sponge not only led to elevation of PTEN, but also decreased phosphorylated forms of AKT and mTOR in all tumors (Figure 8D).
Figure 8.
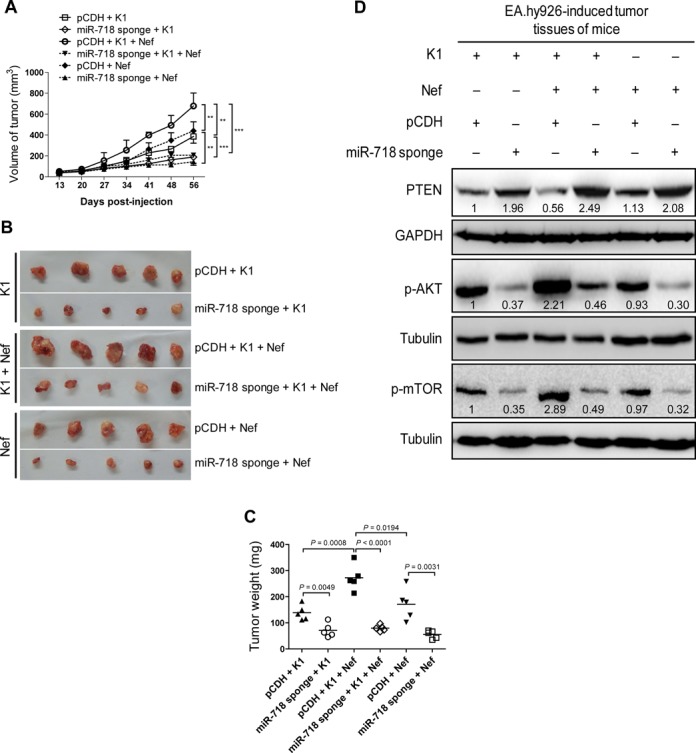
miR-718 mediates K1- and Nef-induced tumorigenesis in nude mice. (A) Inhibition of miR-718 abrogates the enhanced effect of Nef on K1-induced tumorigenesis. EA.hy926 cells transduced with K1, Nef or both were infected with control virus (pCDH) or miR-718 sponge for 72 h and further re-suspended in serum-free medium. As detailed in the ‘Materials and Methods’ section, the treated cells were injected (s.c.) into nude mice. The sizes of tumors from nude mice were determined by two-dimensional caliper measurements. Data represent mean ± SD, each group with five tumors (n = 5). Two independent experiments were performed and similar results were obtained. ** and *** indicate P < 0.01 and P < 0.001 by Student's t-test, respectively. (B) Tumor-bearing mice were killed at day 56 after injections, and tumors were removed and pictures were taken. (C) Inhibition of miR-718 abrogates the enhanced effect of Nef on K1-induced tumorigenesis. The tumors from nude mice treated as in (A) were removed and weighed. Scatter plots represent the weights of independent tumors from different groups. Data represent mean ± SD, each group with five tumors (n = 5). Two independent experiments were performed and similar results were obtained. (D) Inhibition of miR-718 increased total PTEN level and suppressed the enhanced phosphorylation of AKT and mTOR by K1 and Nef. The tumor tissues from nude mice treated as in (A) were removed, and the expression of total PTEN, phosphorylation levels of AKT and mTOR in tumor tissues were analyzed by Western blot. Numbers labeled under the bands were the relative intensities of the bands after calibration for loading with the house-keeping protein tubulin. The relative value of proteins in K1 + pCDH group was considered as ‘1’.
Together these data indicated that, by targeting PTEN, miR-718 mediates Nef- and K1-induced tumorigenesis via activation of AKT/mTOR signaling.
DISCUSSION
Like vIL-6 of KSHV, K1 demonstrates early lytic kinetics and its expression has been detected in KS, PEL and MCD (63,65–67). Besides blocking of apoptosis and induction of lymphoma in transgenic mice (7–10), K1 can also immortalize HUVECs in culture by activating the PI3K/Akt/mTOR pathway (63). K1 ITAM domain also activates both the VEGF/VEGFR-2 and the PI3K/AKT signaling pathways in HUVECs (63). Thus, K1 appears to be important in KSHV-associated angiogenesis and tumorigenesis (68). In the current study, we demonstrated that K1 exhibits a strong angiogenesis both in CAM and nude mice models. These results are consistent with the previous studies (10,63), and highlight the angiogenic properties of K1 and its important role in KS pathogenesis.
Nef is one of the earliest, most abundantly expressed and secreted HIV-1 proteins. Since circulating Nef is internalized by endothelial cells (31,32), here we investigated its role in synergistic effect on angiogenesis and tumorigenesis in endothelial cells using soluble and ectopic Nef. We found that Nef not only synergistically promoted K1-induced angiogenesis both in CAM and nude mice models, but also enhanced the expression of several pro-angiogenic factors, such as VEGF and SMA. These findings suggest that Nef likely promoted K1-induced angiogenesis and tumorigenesis through an autocrine and paracrine mechanism. Although our works have been performed with cells and animal models so far, the results remain to be validated in patients. In KS patients, disease is correlated with viral replication when HIV is also actively replicating (69–71). Thus, Nef, which has been shown to inhibit KSHV lytic replication (30), and K1, which is upregulated during the lytic phase, are likely to simultaneously present in the KS tumors. Furthermore, it has been shown that once initiated, KSHV lytic replication is irreversible (72). Therefore, while Nef might contribute to the maintenance of KSHV latency, it is unlikely that Nef would prevent KSHV lytic replication once it is initiated. In this case, we expect that Nef would synergize with K1 to promote KSHV-induced angiogenesis.
The PTEN/AKT/mTOR signaling is a critical pathway in cellular proliferation, cell survival, neovascularization and tumor growth. Several components of the PTEN/AKT/mTOR pathway are dysregulated in cancers, including KS (73–76). PTEN inhibits PI3K-dependent activation of AKT, while activated AKT triggers downstream mTOR/p70 S6K1 signaling resulting in the induction of pro-angiogenic factors, thereby inducing neovascularization to promote tumor growth (77,78). In this study, we found that PI3K/AKT/mTOR was activated in synergistic induction of angiogenesis by Nef and K1 in vitro and in vivo as a result of inhibition of PTEN expression. Overexpression of PTEN or inhibition of mTOR significantly abolished K1 and Nef-induced angiogenesis and tumorigenesis in the CAM and nude mice xenograft models. These results indicated that K1 and Nef might exert their biological functions both via PTEN/PI3K/AKT/mTOR signaling.
Previous studies have shown that the ability of Nef to activate the AKT/mTOR signaling pathway depends on the cell type. For instance, overexpression of Nef in 293T cells activated PI3K without activating AKT (79). Recombinant soluble Nef protein was shown to dampen the activation of AKT following insulin stimulation in adipocytes (80). However, in a different study, recombinant soluble Nef was shown to robustly activate AKT in human macrophage U937 cells (81). A more recent study also showed that AKT was involved in Nef-mediated induction of CCL5 expression in SVGA astrocytes, a clone of the human fetal astrocytic cell line (SVG), following transient expression of Nef protein (82). Finally, our group has recently shown that addition of soluble Nef or overexpression of Nef in human endothelial cells activates AKT (32). Consistent with our previous study, we have shown that Nef activates the PI3K/AKT pathway to regulate angiogenesis in human endothelial cells in the current study. Therefore, activation of AKT by Nef is context-dependent.
As the crucial players in various biological processes, miRNAs are involved in different stages of tumorigenesis, such as apoptosis, proliferation, limited replicative potential of tumor cells, angiogenesis, migration, invasion and the major signaling pathways related to tumor development (83). To date, miR-214 is found to regulate PTEN by directly binding the PTEN 3′UTR, leading to inhibition of PTEN translation and the subsequent activation of the PI3K/AKT pathway in human ovarian cancer (78,84). Two other miRNAs with oncogenic potential, miR-21 and the miR-17–92 cluster, can also inhibit PTEN expression in human hepatocellular cancer and mouse lymphoproliferative disorders, resulting in increased tumor cell proliferation, migration and invasion (85–88). In addition, miR-29, miR-26a and b, miR-217, miR-486, miR-193a and miR-519d have been shown to specifically modulate PTEN mRNA expression (89–95). As for the effect of miRNAs on KSHV-associated pathogenesis, KSHV infection modulates a number of host and/or viral miRNAs to regulate host and/or viral genes, and to participate in KSHV life cycle control, immune evasion and tumorigenesis (33,34). For example, cellular miR-132 negatively regulates interferon pathways by targeting the p300 transcriptional co-activator to facilitate viral replication (96). Whether cellular miRNAs regulate the PTEN/AKT/mTOR signaling in the development of AIDS-KS is still a mystery. In the current study, our results provide the first line of evidence that Nef and K1 upregulated the expression of cellular miR-718, which directly targets PTEN resulting in the activation of AKT/mTOR signaling and induction of angiogenesis and tumorigenesis. As for miR-718, its precise function in disease is still unknown (97). By using Bulge-Loop™ miRNA RT-qPCR, we detected the basal levels of miR-718 in KSHV latently infected endothelial cells and normal primary HUVECs. Interestingly, we found that the basal expression level of miR-718 in KSHV-infected HUVECs was increased by more than five-fold when compared to that of uninfected primary HUVECs (Chun Lu, unpublished data). These data imply that KSHV virion or K1 protein upregulates the level of miR-718 in HUVECs.
In conclusion, our work revealed that miR-718 mediates the synergistic induction of angiogenesis and tumorigenesis of K1 and Nef by targeting PTEN to activate the AKT/mTOR pathway. These results not only demonstrate the interactions of HIV-1 Nef with KSHV oncoproteins in AIDS-KS development, but also suggest that miR-718/AKT/mTOR axis may represent the attractive therapeutic target for AIDS-KS patients. Further studies will be needed to better understand how K1 and Nef upregulate miR-718 expression and whether other K1 and Nef-regulated miRNAs, particularly those downregulated miRNAs, are also involved in the regulation of AIDS-KS pathogenesis.
Supplementary Material
Acknowledgments
We are grateful to Dr Cong Wang from Department of Pathology, the First Affiliated Hospital of Nanjing Medical University for HE and IHC staining. Q.Y. and C.L. conceived and designed the experiments. M.X., S.Y., M.H., W.L. and T.H. performed the experiments. H.L. provided the reagents. F.Z., X.Z., D.Q., Q.Y., J.Z., S.J.G. and C.L. analyzed the data. Q.Y., S.J.G. and C.L. wrote the paper.
Footnotes
The authors wish it to be known that, in their opinion, the first four authors should be regarded as Joint First Authors.
FUNDING
National Basic Research Program of China (973 Program) [2011CB504803 (to C.L.)]; National Natural Science Foundation of China [81361120387, 81371824, 81171552, 31270199 (to C.L.)]; National Institutes of Health [R01CA177377 (to S.J.G.)]; the Ph.D. Programs Foundation of Ministry of Education of China [20123234110006 (to C.L.)]; Natural Science Foundation of Ministry of Education of Jiangsu Province [great project 10KJA310032 (to C.L.)]; China Postdoctoral Science Foundation [2012M511304, 2013T60551 (to D.Q.)]; the Natural Science Youth Foundation of Jiangsu Province [BK20130215 (to M.X.)].
Conflict of interest statement. None declared.
REFERENCE
- 1.Chang Y., Cesarman E., Pessin M.S., Lee F., Culpepper J., Knowles D.M., Moore P.S. Identification of herpesvirus-like DNA sequences in AIDS-associated Kaposi's sarcoma. Science. 1994;266:1865–1869. doi: 10.1126/science.7997879. [DOI] [PubMed] [Google Scholar]
- 2.Mesri E.A., Cesarman E., Boshoff C. Kaposi's sarcoma and its associated herpesvirus. Nat. Rev. Cancer. 2010;10:707–719. doi: 10.1038/nrc2888. [DOI] [PMC free article] [PubMed] [Google Scholar]
- 3.Cullen B.R. Viruses and microRNAs: RISCy interactions with serious consequences. Genes Dev. 2011;25:1881–1894. doi: 10.1101/gad.17352611. [DOI] [PMC free article] [PubMed] [Google Scholar]
- 4.Wen K.W., Damania B. Kaposi sarcoma-associated herpesvirus (KSHV): molecular biology and oncogenesis. Cancer Lett. 2010;289:140–150. doi: 10.1016/j.canlet.2009.07.004. [DOI] [PMC free article] [PubMed] [Google Scholar]
- 5.Jones T., Ramos da Silva S., Bedolla R., Ye F., Zhou F., Gao S.J. Viral cyclin promotes KSHV-induced cellular transformation and tumorigenesis by overriding contact inhibition. Cell Cycle. 2014;13 doi: 10.4161/cc.27758. [DOI] [PMC free article] [PubMed] [Google Scholar]
- 6.Moody R., Zhu Y., Huang Y., Cui X., Jones T., Bedolla R., Lei X., Bai Z., Gao S.J. KSHV microRNAs mediate cellular transformation and tumorigenesis by redundantly targeting cell growth and survival pathways. PLoS Pathog. 2013;9:e1003857. doi: 10.1371/journal.ppat.1003857. [DOI] [PMC free article] [PubMed] [Google Scholar]
- 7.Prakash O., Tang Z.Y., Peng X., Coleman R., Gill J., Farr G., Samaniego F. Tumorigenesis and aberrant signaling in transgenic mice expressing the human herpesvirus-8 K1 gene. J. Natl Cancer Inst. 2002;94:926–935. doi: 10.1093/jnci/94.12.926. [DOI] [PubMed] [Google Scholar]
- 8.Berkova Z., Wang S., Wise J.F., Maeng H., Ji Y., Samaniego F. Mechanism of Fas signaling regulation by human herpesvirus 8 K1 oncoprotein. J. Natl Cancer Inst. 2009;101:399–411. doi: 10.1093/jnci/djn516. [DOI] [PMC free article] [PubMed] [Google Scholar]
- 9.Wang S., Maeng H., Young D.P., Prakash O., Fayad L.E., Younes A., Samaniego F. K1 protein of human herpesvirus 8 suppresses lymphoma cell Fas-mediated apoptosis. Blood. 2007;109:2174–2182. doi: 10.1182/blood-2006-02-003178. [DOI] [PMC free article] [PubMed] [Google Scholar]
- 10.Tomlinson C.C., Damania B. The K1 protein of Kaposi's sarcoma-associated herpesvirus activates the Akt signaling pathway. J. Virol. 2004;78:1918–1927. doi: 10.1128/JVI.78.4.1918-1927.2004. [DOI] [PMC free article] [PubMed] [Google Scholar]
- 11.Strathdee S.A., Veugelers P.J., Moore P.S. The epidemiology of HIV-associated Kaposi's sarcoma: the unraveling mystery. AIDS. 1996;10((Suppl. A)):S51–S57. [PubMed] [Google Scholar]
- 12.Delli Bovi P., Donti E., Knowles D.M., 2nd, Friedman-Kien A., Luciw P.A., Dina D., Dalla-Favera R., Basilico C. Presence of chromosomal abnormalities and lack of AIDS retrovirus DNA sequences in AIDS-associated Kaposi's sarcoma. Cancer Res. 1986;46:6333–6338. [PubMed] [Google Scholar]
- 13.Ensoli B., Barillari G., Gallo R.C. Cytokines and growth factors in the pathogenesis of AIDS-associated Kaposi's sarcoma. Immunol. Rev. 1992;127:147–155. doi: 10.1111/j.1600-065x.1992.tb01412.x. [DOI] [PubMed] [Google Scholar]
- 14.Fiorelli V., Gendelman R., Samaniego F., Markham P.D., Ensoli B. Cytokines from activated T cells induce normal endothelial cells to acquire the phenotypic and functional features of AIDS-Kaposi's sarcoma spindle cells. J. Clin. Invest. 1995;95:1723–1734. doi: 10.1172/JCI117849. [DOI] [PMC free article] [PubMed] [Google Scholar]
- 15.Barillari G., Gendelman R., Gallo R.C., Ensoli B. The Tat protein of human immunodeficiency virus type 1, a growth factor for AIDS Kaposi sarcoma and cytokine-activated vascular cells, induces adhesion of the same cell types by using integrin receptors recognizing the RGD amino acid sequence; Proc.Natl Acad. Sci. U.S.A.; 1993. pp. 7941–7945. [DOI] [PMC free article] [PubMed] [Google Scholar]
- 16.Ensoli B., Cafaro A. HIV-1 and Kaposi's sarcoma. Eur. J. Cancer Prev. 1996;5:410–412. [PubMed] [Google Scholar]
- 17.Zeng Y., Zhang X., Huang Z., Cheng L., Yao S., Qin D., Chen X., Tang Q., Lv Z., Zhang L., et al. Intracellular Tat of human immunodeficiency virus type 1 activates lytic cycle replication of Kaposi's sarcoma-associated herpesvirus: role of JAK/STAT signaling. J. Virol. 2007;81:2401–2417. doi: 10.1128/JVI.02024-06. [DOI] [PMC free article] [PubMed] [Google Scholar]
- 18.Chen X., Cheng L., Jia X., Zeng Y., Yao S., Lv Z., Qin D., Fang X., Lei Y., Lu C. Human immunodeficiency virus type 1 Tat accelerates Kaposi sarcoma-associated herpesvirus Kaposin A-mediated tumorigenesis of transformed fibroblasts in vitro as well as in nude and immunocompetent mice. Neoplasia. 2009;11:1272–1284. doi: 10.1593/neo.09494. [DOI] [PMC free article] [PubMed] [Google Scholar]
- 19.Guo H.G., Pati S., Sadowska M., Charurat M., Reitz M. Tumorigenesis by human herpesvirus 8 vGPCR is accelerated by human immunodeficiency virus type 1 Tat. J. Virol. 2004;78:9336–9342. doi: 10.1128/JVI.78.17.9336-9342.2004. [DOI] [PMC free article] [PubMed] [Google Scholar]
- 20.Zhou F., Xue M., Qin D., Zhu X., Wang C., Zhu J., Hao T., Cheng L., Chen X., Bai Z., et al. HIV-1 Tat promotes Kaposi's sarcoma-associated herpesvirus (KSHV) vIL-6-induced angiogenesis and tumorigenesis by regulating PI3K/PTEN/AKT/GSK-3beta signaling pathway. PLoS One. 2013;8:e53145. doi: 10.1371/journal.pone.0053145. [DOI] [PMC free article] [PubMed] [Google Scholar]
- 21.Kestler H.W., 3rd, Ringler D.J., Mori K., Panicali D.L., Sehgal P.K., Daniel M.D., Desrosiers R.C. Importance of the nef gene for maintenance of high virus loads and for development of AIDS. Cell. 1991;65:651–662. doi: 10.1016/0092-8674(91)90097-i. [DOI] [PubMed] [Google Scholar]
- 22.Raymond A.D., Campbell-Sims T.C., Khan M., Lang M., Huang M.B., Bond V.C., Powell M.D. HIV Type 1 Nef is released from infected cells in CD45(+) microvesicles and is present in the plasma of HIV-infected individuals. AIDS Res. Hum. Retroviruses. 2011;27:167–178. doi: 10.1089/aid.2009.0170. [DOI] [PMC free article] [PubMed] [Google Scholar]
- 23.Caby M.P., Lankar D., Vincendeau-Scherrer C., Raposo G., Bonnerot C. Exosomal-like vesicles are present in human blood plasma. Int. Immunol. 2005;17:879–887. doi: 10.1093/intimm/dxh267. [DOI] [PubMed] [Google Scholar]
- 24.Guy B., Kieny M.P., Riviere Y., Le Peuch C., Dott K., Girard M., Montagnier L., Lecocq J.P. HIV F/3′ orf encodes a phosphorylated GTP-binding protein resembling an oncogene product. Nature. 1987;330:266–269. doi: 10.1038/330266a0. [DOI] [PubMed] [Google Scholar]
- 25.Fujii Y., Otake K., Tashiro M., Adachi A. Soluble Nef antigen of HIV-1 is cytotoxic for human CD4+ T cells. FEBS Lett. 1996;393:93–96. doi: 10.1016/0014-5793(96)00859-9. [DOI] [PubMed] [Google Scholar]
- 26.Guy B., Riviere Y., Dott K., Regnault A., Kieny M.P. Mutational analysis of the HIV nef protein. Virology. 1990;176:413–425. doi: 10.1016/0042-6822(90)90011-f. [DOI] [PubMed] [Google Scholar]
- 27.Macreadie I.G., Fernley R., Castelli L.A., Lucantoni A., White J., Azad A. Expression of HIV-1 nef in yeast causes membrane perturbation and release of the myristylated Nef protein. J. Biomed. Sci. 1998;5:203–210. doi: 10.1007/BF02253470. [DOI] [PubMed] [Google Scholar]
- 28.Cullen B.R. HIV-1 auxiliary proteins: making connections in a dying cell. Cell. 1998;93:685–692. doi: 10.1016/s0092-8674(00)81431-2. [DOI] [PubMed] [Google Scholar]
- 29.Qiao X., He B., Chiu A., Knowles D.M., Chadburn A., Cerutti A. Human immunodeficiency virus 1 Nef suppresses CD40-dependent immunoglobulin class switching in bystander B cells. Nat. Immunol. 2006;7:302–310. doi: 10.1038/ni1302. [DOI] [PubMed] [Google Scholar]
- 30.Yan Q., Ma X., Shen C., Cao X., Feng N., Qin D., Zeng Y., Zhu J., Gao S.J., Lu C. Inhibition of Kaposi's sarcoma-associated herpesvirus lytic replication by HIV-1 Nef and cellular MicroRNA hsa-miR-1258. J. Virol. 2014;88:4987–5000. doi: 10.1128/JVI.00025-14. [DOI] [PMC free article] [PubMed] [Google Scholar]
- 31.Marecki J.C., Cool C.D., Parr J.E., Beckey V.E., Luciw P.A., Tarantal A.F., Carville A., Shannon R.P., Cota-Gomez A., Tuder R.M., et al. HIV-1 Nef is associated with complex pulmonary vascular lesions in SHIV-nef-infected macaques. Am. J. Respir. Crit. Care Med. 2006;174:437–445. doi: 10.1164/rccm.200601-005OC. [DOI] [PMC free article] [PubMed] [Google Scholar]
- 32.Zhu X., Guo Y., Yao S., Yan Q., Xue M., Hao T., Zhou F., Zhu J., Qin D., Lu C. Synergy between Kaposi's sarcoma-associated herpesvirus (KSHV) vIL-6 and HIV-1 Nef protein in promotion of angiogenesis and oncogenesis: role of the AKT signaling pathway. Oncogene. 2014;33:1986–1996. doi: 10.1038/onc.2013.136. [DOI] [PubMed] [Google Scholar]
- 33.Bellare P., Ganem D. Regulation of KSHV lytic switch protein expression by a virus-encoded microRNA: an evolutionary adaptation that fine-tunes lytic reactivation. Cell Host Microbe. 2009;6:570–575. doi: 10.1016/j.chom.2009.11.008. [DOI] [PMC free article] [PubMed] [Google Scholar]
- 34.Lei X., Bai Z., Ye F., Xie J., Kim C.G., Huang Y., Gao S.J. Regulation of NF-kappaB inhibitor IkappaBalpha and viral replication by a KSHV microRNA. Nat. Cell Biol. 2010;12:193–199. doi: 10.1038/ncb2019. [DOI] [PMC free article] [PubMed] [Google Scholar]
- 35.Lu F., Stedman W., Yousef M., Renne R., Lieberman P.M. Epigenetic regulation of Kaposi's sarcoma-associated herpesvirus latency by virus-encoded microRNAs that target Rta and the cellular Rbl2-DNMT pathway. J. Virol. 2010;84:2697–2706. doi: 10.1128/JVI.01997-09. [DOI] [PMC free article] [PubMed] [Google Scholar]
- 36.Liang D., Gao Y., Lin X., He Z., Zhao Q., Deng Q., Lan K. A human herpesvirus miRNA attenuates interferon signaling and contributes to maintenance of viral latency by targeting IKKepsilon. Cell Res. 2011;21:793–806. doi: 10.1038/cr.2011.5. [DOI] [PMC free article] [PubMed] [Google Scholar]
- 37.Lin X., Liang D., He Z., Deng Q., Robertson E.S., Lan K. miR-K12–7-5p encoded by Kaposi's sarcoma-associated herpesvirus stabilizes the latent state by targeting viral ORF50/RTA. PLoS One. 2011;6:e16224. doi: 10.1371/journal.pone.0016224. [DOI] [PMC free article] [PubMed] [Google Scholar]
- 38.Lu C.C., Li Z., Chu C.Y., Feng J., Feng J., Sun R., Rana T.M. MicroRNAs encoded by Kaposi's sarcoma-associated herpesvirus regulate viral life cycle. EMBO Rep. 2010;11:784–790. doi: 10.1038/embor.2010.132. [DOI] [PMC free article] [PubMed] [Google Scholar]
- 39.Bai Z., Huang Y., Li W., Zhu Y., Jung J.U., Lu C., Gao S.J. Genomewide mapping and screening of Kaposi's sarcoma-associated herpesvirus (KSHV) 3′ untranslated regions identify bicistronic and polycistronic viral transcripts as frequent targets of KSHV microRNAs. J. Virol. 2014;88:377–392. doi: 10.1128/JVI.02689-13. [DOI] [PMC free article] [PubMed] [Google Scholar]
- 40.Abend J.R., Uldrick T., Ziegelbauer J.M. Regulation of tumor necrosis factor-like weak inducer of apoptosis receptor protein (TWEAKR) expression by Kaposi's sarcoma-associated herpesvirus microRNA prevents TWEAK-induced apoptosis and inflammatory cytokine expression. J. Virol. 2010;84:12 139–12 151. doi: 10.1128/JVI.00884-10. [DOI] [PMC free article] [PubMed] [Google Scholar]
- 41.Abend J.R., Ramalingam D., Kieffer-Kwon P., Uldrick T.S., Yarchoan R., Ziegelbauer J.M. Kaposi's sarcoma-associated herpesvirus microRNAs target IRAK1 and MYD88, two components of the toll-like receptor/interleukin-1R signaling cascade, to reduce inflammatory-cytokine expression. J. Virol. 2012;86:11 663–11 674. doi: 10.1128/JVI.01147-12. [DOI] [PMC free article] [PubMed] [Google Scholar]
- 42.Boss I.W., Nadeau P.E., Abbott J.R., Yang Y., Mergia A., Renne R. A Kaposi's sarcoma-associated herpesvirus-encoded ortholog of microRNA miR-155 induces human splenic B-cell expansion in NOD/LtSz-scid IL2Rgammanull mice. J. Virol. 2011;85:9877–9886. doi: 10.1128/JVI.05558-11. [DOI] [PMC free article] [PubMed] [Google Scholar]
- 43.Dahlke C., Maul K., Christalla T., Walz N., Schult P., Stocking C., Grundhoff A. A microRNA encoded by Kaposi sarcoma-associated herpesvirus promotes B-cell expansion in vivo. PLoS One. 2012;7:e49435. doi: 10.1371/journal.pone.0049435. [DOI] [PMC free article] [PubMed] [Google Scholar]
- 44.Gottwein E., Mukherjee N., Sachse C., Frenzel C., Majoros W.H., Chi J.T., Braich R., Manoharan M., Soutschek J., Ohler U., et al. A viral microRNA functions as an orthologue of cellular miR-155. Nature. 2007;450:1096–1099. doi: 10.1038/nature05992. [DOI] [PMC free article] [PubMed] [Google Scholar]
- 45.Hansen A., Henderson S., Lagos D., Nikitenko L., Coulter E., Roberts S., Gratrix F., Plaisance K., Renne R., Bower M., et al. KSHV-encoded miRNAs target MAF to induce endothelial cell reprogramming. Genes Dev. 2010;24:195–205. doi: 10.1101/gad.553410. [DOI] [PMC free article] [PubMed] [Google Scholar]
- 46.Lei X., Zhu Y., Jones T., Bai Z., Huang Y., Gao S.J. A Kaposi's sarcoma-associated herpesvirus microRNA and its variants target the transforming growth factor beta pathway to promote cell survival. J. Virol. 2012;86:11 698–11 711. doi: 10.1128/JVI.06855-11. [DOI] [PMC free article] [PubMed] [Google Scholar]
- 47.Liu Y., Sun R., Lin X., Liang D., Deng Q., Lan K. Kaposi's sarcoma-associated herpesvirus-encoded microRNA miR-K12–11 attenuates transforming growth factor beta signaling through suppression of SMAD5. J. Virol. 2012;86:1372–1381. doi: 10.1128/JVI.06245-11. [DOI] [PMC free article] [PubMed] [Google Scholar]
- 48.Nachmani D., Stern-Ginossar N., Sarid R., Mandelboim O. Diverse herpesvirus microRNAs target the stress-induced immune ligand MICB to escape recognition by natural killer cells. Cell Host Microbe. 2009;5:376–385. doi: 10.1016/j.chom.2009.03.003. [DOI] [PubMed] [Google Scholar]
- 49.Qin Z., Freitas E., Sullivan R., Mohan S., Bacelieri R., Branch D., Romano M., Kearney P., Oates J., Plaisance K., et al. Upregulation of xCT by KSHV-encoded microRNAs facilitates KSHV dissemination and persistence in an environment of oxidative stress. PLoS Pathog. 2010;6:e1000742. doi: 10.1371/journal.ppat.1000742. [DOI] [PMC free article] [PubMed] [Google Scholar]
- 50.Qin Z., Kearney P., Plaisance K., Parsons C.H. Pivotal advance: Kaposi's sarcoma-associated herpesvirus (KSHV)-encoded microRNA specifically induce IL-6 and IL-10 secretion by macrophages and monocytes. J. Leukoc. Biol. 2010;87:25–34. doi: 10.1189/jlb.0409251. [DOI] [PMC free article] [PubMed] [Google Scholar]
- 51.Samols M.A., Skalsky R.L., Maldonado A.M., Riva A., Lopez M.C., Baker H.V., Renne R. Identification of cellular genes targeted by KSHV-encoded microRNAs. PLoS Pathog. 2007;3:e65. doi: 10.1371/journal.ppat.0030065. [DOI] [PMC free article] [PubMed] [Google Scholar]
- 52.Skalsky R.L., Samols M.A., Plaisance K.B., Boss I.W., Riva A., Lopez M.C., Baker H.V., Renne R. Kaposi's sarcoma-associated herpesvirus encodes an ortholog of miR-155. J. Virol. 2007;81:12 836–12 845. doi: 10.1128/JVI.01804-07. [DOI] [PMC free article] [PubMed] [Google Scholar]
- 53.Suffert G., Malterer G., Hausser J., Viiliainen J., Fender A., Contrant M., Ivacevic T., Benes V., Gros F., Voinnet O., et al. Kaposi's sarcoma herpesvirus microRNAs target caspase 3 and regulate apoptosis. PLoS Pathog. 2011;7:e1002405. doi: 10.1371/journal.ppat.1002405. [DOI] [PMC free article] [PubMed] [Google Scholar]
- 54.Ziegelbauer J.M., Sullivan C.S., Ganem D. Tandem array-based expression screens identify host mRNA targets of virus-encoded microRNAs. Nat. Genet. 2009;41:130–134. doi: 10.1038/ng.266. [DOI] [PMC free article] [PubMed] [Google Scholar]
- 55.Kang J.G., Majerciak V., Uldrick T.S., Wang X., Kruhlak M., Yarchoan R., Zheng Z.M. Kaposi's sarcoma-associated herpesviral IL-6 and human IL-6 open reading frames contain miRNA binding sites and are subject to cellular miRNA regulation. J. Pathol. 2011;225:378–389. doi: 10.1002/path.2962. [DOI] [PMC free article] [PubMed] [Google Scholar]
- 56.Sgarbanti M., Arguello M., tenOever B.R., Battistini A., Lin R., Hiscott J. A requirement for NF-kappaB induction in the production of replication-competent HHV-8 virions. Oncogene. 2004;23:5770–5780. doi: 10.1038/sj.onc.1207707. [DOI] [PubMed] [Google Scholar]
- 57.Poon M., Zhang X., Dunsky K.G., Taubman M.B., Harpel P.C. Apolipoprotein(a) induces monocyte chemotactic activity in human vascular endothelial cells. Circulation. 1997;96:2514–2519. doi: 10.1161/01.cir.96.8.2514. [DOI] [PubMed] [Google Scholar]
- 58.Zhu X., Zhou F., Qin D., Zeng Y., Lv Z., Yao S., Lu C. Human immunodeficiency virus type 1 induces lytic cycle replication of Kaposi's-sarcoma-associated herpesvirus: role of Ras/c-Raf/MEK1/2, PI3K/AKT, and NF-kappaB signaling pathways. J. Mol. Biol. 2011;410:1035–1051. doi: 10.1016/j.jmb.2011.03.055. [DOI] [PubMed] [Google Scholar]
- 59.Du L., Wang H., He L., Zhang J., Ni B., Wang X., Jin H., Cahuzac N., Mehrpour M., Lu Y., et al. CD44 is of functional importance for colorectal cancer stem cells. Clin. Cancer Res. 2008;14:6751–6760. doi: 10.1158/1078-0432.CCR-08-1034. [DOI] [PubMed] [Google Scholar]
- 60.Aranda E., Owen G.I. A semi-quantitative assay to screen for angiogenic compounds and compounds with angiogenic potential using the EA.hy926 endothelial cell line. Biol. Res. 2009;42:377–389. [PubMed] [Google Scholar]
- 61.Yan Q., Li W., Tang Q., Yao S., Lv Z., Feng N., Ma X., Bai Z., Zeng Y., Qin D., et al. Cellular microRNAs 498 and 320d regulate herpes simplex virus 1 induction of Kaposi's sarcoma-associated herpesvirus lytic replication by targeting RTA. PLoS One. 2013;8:e55832. doi: 10.1371/journal.pone.0055832. [DOI] [PMC free article] [PubMed] [Google Scholar]
- 62.Ebert M.S., Neilson J.R., Sharp P.A. MicroRNA sponges: competitive inhibitors of small RNAs in mammalian cells. Nat. Methods. 2007;4:721–726. doi: 10.1038/nmeth1079. [DOI] [PMC free article] [PubMed] [Google Scholar]
- 63.Wang L., Dittmer D.P., Tomlinson C.C., Fakhari F.D., Damania B. Immortalization of primary endothelial cells by the K1 protein of Kaposi's sarcoma-associated herpesvirus. Cancer Res. 2006;66:3658–3666. doi: 10.1158/0008-5472.CAN-05-3680. [DOI] [PubMed] [Google Scholar]
- 64.Vivanco I., Sawyers C.L. The phosphatidylinositol 3-kinase AKT pathway in human cancer. Nat. Rev. Cancer. 2002;2:489–501. doi: 10.1038/nrc839. [DOI] [PubMed] [Google Scholar]
- 65.Jenner R.G., Alba M.M., Boshoff C., Kellam P. Kaposi's sarcoma-associated herpesvirus latent and lytic gene expression as revealed by DNA arrays. J. Virol. 2001;75:891–902. doi: 10.1128/JVI.75.2.891-902.2001. [DOI] [PMC free article] [PubMed] [Google Scholar]
- 66.Lagunoff M., Ganem D. The structure and coding organization of the genomic termini of Kaposi's sarcoma-associated herpesvirus. Virology. 1997;236:147–154. doi: 10.1006/viro.1997.8713. [DOI] [PubMed] [Google Scholar]
- 67.Lee B.S., Connole M., Tang Z., Harris N.L., Jung J.U. Structural analysis of the Kaposi's sarcoma-associated herpesvirus K1 protein. J. Virol. 2003;77:8072–8086. doi: 10.1128/JVI.77.14.8072-8086.2003. [DOI] [PMC free article] [PubMed] [Google Scholar]
- 68.Wang L., Wakisaka N., Tomlinson C.C., DeWire S.M., Krall S., Pagano J.S., Damania B. The Kaposi's sarcoma-associated herpesvirus (KSHV/HHV-8) K1 protein induces expression of angiogenic and invasion factors. Cancer Res. 2004;64:2774–2781. doi: 10.1158/0008-5472.can-03-3653. [DOI] [PubMed] [Google Scholar]
- 69.Cattelan A.M., Calabro M.L., Gasperini P., Aversa S.M., Zanchetta M., Meneghetti F., De Rossi A., Chieco-Bianchi L. Acquired immunodeficiency syndrome-related Kaposi's sarcoma regression after highly active antiretroviral therapy: biologic correlates of clinical outcome. J. Natl Cancer Inst. Monogr. 2001. pp. 44–49. [DOI] [PubMed]
- 70.Engels E.A., Biggar R.J., Marshall V.A., Walters M.A., Gamache C.J., Whitby D., Goedert J.J. Detection and quantification of Kaposi's sarcoma-associated herpesvirus to predict AIDS-associated Kaposi's sarcoma. AIDS. 2003;17:1847–1851. doi: 10.1097/00002030-200308150-00015. [DOI] [PubMed] [Google Scholar]
- 71.Guadalupe M., Pollock B.H., Westbrook S., Redding S., Bullock D., Anstead G., Agan B.K., Marconi V.C., Barbieri S., Sankar V., et al. Risk factors influencing antibody responses to Kaposi's sarcoma-associated herpesvirus latent and lytic antigens in patients under antiretroviral therapy. J. Acquir. Immune Defic. Syndr. 2011;56:83–90. doi: 10.1097/QAI.0b013e3181fdc928. [DOI] [PMC free article] [PubMed] [Google Scholar]
- 72.Ye F., Lei X., Gao S.J. Mechanisms of Kaposi's sarcoma-associated herpesvirus latency and reactivation. Adv. Virol. 2011;2011:193860. doi: 10.1155/2011/193860. [DOI] [PMC free article] [PubMed] [Google Scholar]
- 73.Lempiainen H., Halazonetis T.D. Emerging common themes in regulation of PIKKs and PI3Ks. EMBO J. 2009;28:3067–3073. doi: 10.1038/emboj.2009.281. [DOI] [PMC free article] [PubMed] [Google Scholar]
- 74.Montaner S. Akt/TSC/mTOR activation by the KSHV G protein-coupled receptor: emerging insights into the molecular oncogenesis and treatment of Kaposi's sarcoma. Cell Cycle. 2007;6:438–443. doi: 10.4161/cc.6.4.3843. [DOI] [PubMed] [Google Scholar]
- 75.Morris V.A., Punjabi A.S., Lagunoff M. Activation of Akt through gp130 receptor signaling is required for Kaposi's sarcoma-associated herpesvirus-induced lymphatic reprogramming of endothelial cells. J. Virol. 2008;82:8771–8779. doi: 10.1128/JVI.00766-08. [DOI] [PMC free article] [PubMed] [Google Scholar]
- 76.Engelman J.A. Targeting PI3K signalling in cancer: opportunities, challenges and limitations. Nat. Rev. Cancer. 2009;9:550–562. doi: 10.1038/nrc2664. [DOI] [PubMed] [Google Scholar]
- 77.Jiang B.H., Liu L.Z. PI3K/PTEN signaling in angiogenesis and tumorigenesis. Adv. Cancer Res. 2009;102:19–65. doi: 10.1016/S0065-230X(09)02002-8. [DOI] [PMC free article] [PubMed] [Google Scholar]
- 78.Bueno M.J., Perez de Castro I., Malumbres M. Control of cell proliferation pathways by microRNAs. Cell Cycle. 2008;7:3143–3148. doi: 10.4161/cc.7.20.6833. [DOI] [PubMed] [Google Scholar]
- 79.Wolf D., Witte V., Laffert B., Blume K., Stromer E., Trapp S., d'Aloja P., Schurmann A., Baur A.S. HIV-1 Nef associated PAK and PI3-kinases stimulate Akt-independent Bad-phosphorylation to induce anti-apoptotic signals. Nat. Med. 2001;7:1217–1224. doi: 10.1038/nm1101-1217. [DOI] [PubMed] [Google Scholar]
- 80.Cheney L., Hou J.C., Morrison S., Pessin J., Steigbigel R.T. Nef inhibits glucose uptake in adipocytes and contributes to insulin resistance in human immunodeficiency virus type I infection. J. Infect. Dis. 2011;203:1824–1831. doi: 10.1093/infdis/jir170. [DOI] [PMC free article] [PubMed] [Google Scholar]
- 81.Tachado S.D., Li X., Swan K., Patel N., Koziel H. Constitutive activation of phosphatidylinositol 3-kinase signaling pathway down-regulates TLR4-mediated tumor necrosis factor-alpha release in alveolar macrophages from asymptomatic HIV-positive persons in vitro. J. Biol. Chem. 2008;283:33 191–33 198. doi: 10.1074/jbc.M805067200. [DOI] [PMC free article] [PubMed] [Google Scholar]
- 82.Liu X., Shah A., Gangwani M.R., Silverstein P.S., Fu M., Kumar A. HIV-1 Nef induces CCL5 production in astrocytes through p38-MAPK and PI3K/Akt pathway and utilizes NF-kB, CEBP and AP-1 transcription factors. Sci. Rep. 2014;4:4450. doi: 10.1038/srep04450. [DOI] [PMC free article] [PubMed] [Google Scholar]
- 83.Raisch J., Darfeuille-Michaud A., Nguyen H.T. Role of microRNAs in the immune system, inflammation and cancer. World J. Gastroenterol. 2013;19:2985–2996. doi: 10.3748/wjg.v19.i20.2985. [DOI] [PMC free article] [PubMed] [Google Scholar]
- 84.Yang H., Kong W., He L., Zhao J.J., O'Donnell J.D., Wang J., Wenham R.M., Coppola D., Kruk P.A., Nicosia S.V., et al. MicroRNA expression profiling in human ovarian cancer: miR-214 induces cell survival and cisplatin resistance by targeting PTEN. Cancer Res. 2008;68:425–433. doi: 10.1158/0008-5472.CAN-07-2488. [DOI] [PubMed] [Google Scholar]
- 85.Meng F., Henson R., Wehbe-Janek H., Ghoshal K., Jacob S.T., Patel T. MicroRNA-21 regulates expression of the PTEN tumor suppressor gene in human hepatocellular cancer. Gastroenterology. 2007;133:647–658. doi: 10.1053/j.gastro.2007.05.022. [DOI] [PMC free article] [PubMed] [Google Scholar]
- 86.Xiao C., Srinivasan L., Calado D.P., Patterson H.C., Zhang B., Wang J., Henderson J.M., Kutok J.L., Rajewsky K. Lymphoproliferative disease and autoimmunity in mice with increased miR-17–92 expression in lymphocytes. Nat. Immunol. 2008;9:405–414. doi: 10.1038/ni1575. [DOI] [PMC free article] [PubMed] [Google Scholar]
- 87.Pezzolesi M.G., Platzer P., Waite K.A., Eng C. Differential expression of PTEN-targeting microRNAs miR-19a and miR-21 in Cowden syndrome. Am. J. Hum. Genet. 2008;82:1141–1149. doi: 10.1016/j.ajhg.2008.04.005. [DOI] [PMC free article] [PubMed] [Google Scholar]
- 88.Iliopoulos D., Jaeger S.A., Hirsch H.A., Bulyk M.L., Struhl K. STAT3 activation of miR-21 and miR-181b-1 via PTEN and CYLD are part of the epigenetic switch linking inflammation to cancer. Mol. Cell. 2010;39:493–506. doi: 10.1016/j.molcel.2010.07.023. [DOI] [PMC free article] [PubMed] [Google Scholar]
- 89.Tumaneng K., Schlegelmilch K., Russell R.C., Yimlamai D., Basnet H., Mahadevan N., Fitamant J., Bardeesy N., Camargo F.D., Guan K.L. YAP mediates crosstalk between the Hippo and PI(3)K-TOR pathways by suppressing PTEN via miR-29. Nat. Cell Biol. 2012;14:1322–1329. doi: 10.1038/ncb2615. [DOI] [PMC free article] [PubMed] [Google Scholar]
- 90.Huse J.T., Brennan C., Hambardzumyan D., Wee B., Pena J., Rouhanifard S.H., Sohn-Lee C., le Sage C., Agami R., Tuschl T., et al. The PTEN-regulating microRNA miR-26a is amplified in high-grade glioma and facilitates gliomagenesis in vivo. Genes Dev. 2009;23:1327–1337. doi: 10.1101/gad.1777409. [DOI] [PMC free article] [PubMed] [Google Scholar]
- 91.Kato M., Putta S., Wang M., Yuan H., Lanting L., Nair I., Gunn A., Nakagawa Y., Shimano H., Todorov I., et al. TGF-beta activates Akt kinase through a microRNA-dependent amplifying circuit targeting PTEN. Nat. Cell Biol. 2009;11:881–889. doi: 10.1038/ncb1897. [DOI] [PMC free article] [PubMed] [Google Scholar]
- 92.Small E.M., O'Rourke J.R., Moresi V., Sutherland L.B., McAnally J., Gerard R.D., Richardson J.A., Olson E.N. Regulation of PI3-kinase/Akt signaling by muscle-enriched microRNA-486; Proc. Natl Acad. Sci. U.S.A.; 2010. pp. 4218–4223. [DOI] [PMC free article] [PubMed] [Google Scholar]
- 93.Li Y., Gao L., Luo X., Wang L., Gao X., Wang W., Sun J., Dou L., Li J., Xu C., et al. Epigenetic silencing of microRNA-193a contributes to leukemogenesis in t(8;21) acute myeloid leukemia by activating the PTEN/PI3K signal pathway. Blood. 2013;121:499–509. doi: 10.1182/blood-2012-07-444729. [DOI] [PubMed] [Google Scholar]
- 94.Palumbo T., Faucz F.R., Azevedo M., Xekouki P., Iliopoulos D., Stratakis C.A. Functional screen analysis reveals miR-26b and miR-128 as central regulators of pituitary somatomammotrophic tumor growth through activation of the PTEN-AKT pathway. Oncogene. 2013;32:1651–1659. doi: 10.1038/onc.2012.190. [DOI] [PMC free article] [PubMed] [Google Scholar]
- 95.Fornari F., Milazzo M., Chieco P., Negrini M., Marasco E., Capranico G., Mantovani V., Marinello J., Sabbioni S., Callegari E., et al. In hepatocellular carcinoma miR-519d is up-regulated by p53 and DNA hypomethylation and targets CDKN1A/p21, PTEN, AKT3 and TIMP2. J. Pathol. 2012;227:275–285. doi: 10.1002/path.3995. [DOI] [PubMed] [Google Scholar]
- 96.Lagos D., Pollara G., Henderson S., Gratrix F., Fabani M., Milne R.S., Gotch F., Boshoff C. miR-132 regulates antiviral innate immunity through suppression of the p300 transcriptional co-activator. Nat. Cell Biol. 2010;12:513–519. doi: 10.1038/ncb2054. [DOI] [PubMed] [Google Scholar]
- 97.Schrauder M.G., Strick R., Schulz-Wendtland R., Strissel P.L., Kahmann L., Loehberg C.R., Lux M.P., Jud S.M., Hartmann A., Hein A., et al. Circulating micro-RNAs as potential blood-based markers for early stage breast cancer detection. PLoS One. 2012;7:e29770. doi: 10.1371/journal.pone.0029770. [DOI] [PMC free article] [PubMed] [Google Scholar]
Associated Data
This section collects any data citations, data availability statements, or supplementary materials included in this article.