Abstract
Efficacy of PA21 (sucroferric oxyhydroxide), a novel calcium-free polynuclear iron(III)-oxyhydroxide phosphate binder, was compared with that of sevelamer carbonate in an open-label, randomized, active-controlled phase III study. Seven hundred and seven hemo- and peritoneal dialysis patients with hyperphosphatemia received PA21 1.0–3.0 g per day and 348 received sevelamer 4.8–14.4 g per day for an 8-week dose titration, followed by 4 weeks without dose change, and then 12 weeks maintenance. Serum phosphorus reductions at week 12 were −0.71 mmol/l (PA21) and −0.79 mmol/l (sevelamer), demonstrating non-inferiority of, on average, three tablets of PA21 vs. eight of sevelamer. Efficacy was maintained to week 24. Non-adherence was 15.1% (PA21) vs. 21.3% (sevelamer). The percentage of patients that reported at least one treatment-emergent adverse event was 83.2% with PA21 and 76.1% with sevelamer. A higher proportion of patients withdrew owing to treatment-emergent adverse events with PA21 (15.7%) vs. sevelamer (6.6%). Mild, transient diarrhea, discolored feces, and hyperphosphatemia were more frequent with PA21; nausea and constipation were more frequent with sevelamer. After 24 weeks, 99 hemodialysis patients on PA21 were re-randomized into a 3-week superiority analysis of PA21 maintenance dose in 50 patients vs. low dose (250 mg per day (ineffective control)) in 49 patients. The PA21 maintenance dose was superior to the low dose in maintaining serum phosphorus control. Thus, PA21 was effective in lowering serum phosphorus in dialysis patients, with similar efficacy to sevelamer carbonate, a lower pill burden, and better adherence.
Keywords: adherence, dialysis, hyperphosphatemia, phosphate binder, PA21, sevelamer
Hyperphosphatemia is an almost inevitable consequence of chronic kidney disease, particularly in its advanced stages. In chronic kidney disease patients, the inability to maintain phosphorus balance is central to the development of chronic kidney disease-mineral and bone disorder1 and is associated with increased cardiovascular events2 and increased mortality.3, 4, 5, 6 Most patients on dialysis require phosphate binders to control hyperphosphatemia. Treatment with phosphate binders has been associated with a survival benefit.7, 8 However, most phosphate binders are associated with a high pill burden, posing a major obstacle to adherence for patients attempting to maintain optimal control of serum phosphorus concentrations.9, 10
A phosphate binder with a low pill burden and good tolerability may improve adherence and could thereby help optimize serum phosphorus control in patients on dialysis.11 PA21 (sucroferric oxyhydroxide) is a new calcium-free polynuclear iron(III)-oxyhydroxide phosphate binder with a high phosphate binding capacity over a wide pH range.12 It is formulated as flavored, chewable tablets that disintegrate easily in the gastrointestinal (GI) tract, bind phosphate across the whole physiologically relevant pH range, each contain 500 mg of iron, and may be taken without water.
Phase I studies demonstrated that PA21 was well tolerated and that GI iron absorption was minimal.12, 13 A phase II dose-finding study demonstrated that PA21 doses of 1.0−2.5 g per day (based on iron content) were well tolerated and significantly lowered serum phosphorus concentrations from baseline, with maximal effects observed at 2.0–2.5 g per day (P<0.001). A low dose (LD) of PA21 (250 mg per day) was found to be ineffective.14
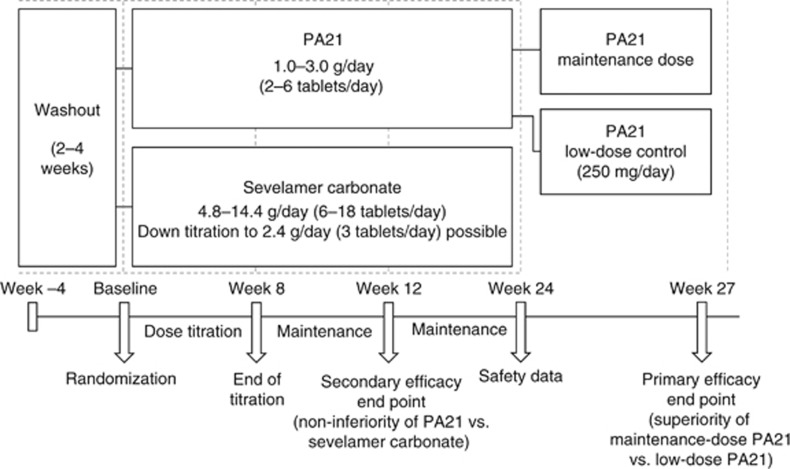
In this phase III study, the efficacy and safety of PA21 was compared with that of sevelamer carbonate (SEV) in treating hyperphosphatemia in patients undergoing dialysis (Figure 1).
Figure 1.
Study design.
RESULTS
Analysis sets and patient disposition
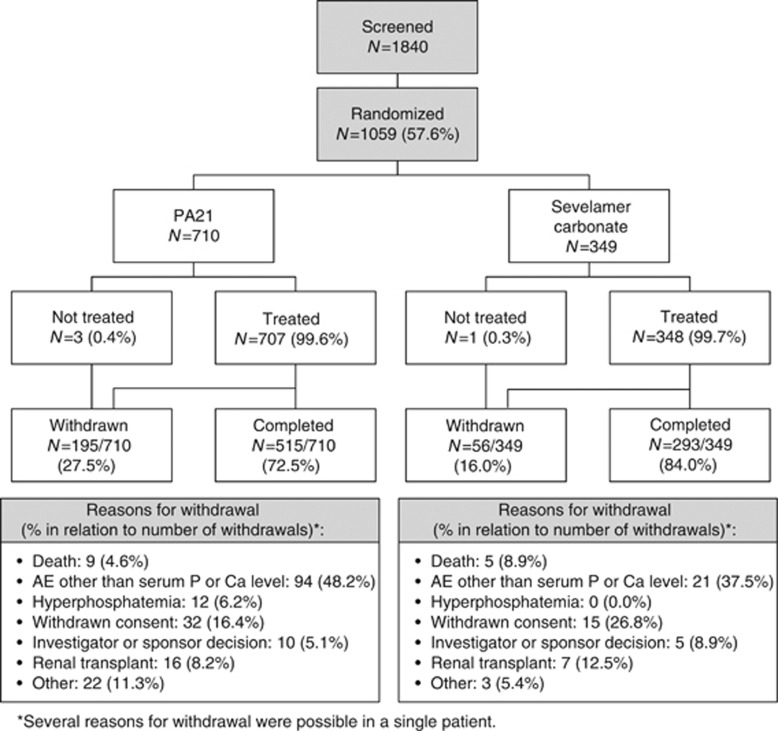
Overall, 1059 patients were randomized in this study. Of these, four did not receive treatment (Figure 2). Hence, 1055 patients were included in the safety set (SS). Of those 1055, 1041 patients were included in the full analysis set (FAS), defined as patients randomized to treatment who received at least one dose of study medication and had at least one postbaseline evaluable efficacy assessment. The per-protocol set (PPS; n=685) consisted of patients who, in addition to the FAS criteria, had completed the treatment from baseline to week 12 and had at least one evaluable serum phosphorus result at or after week 12, with no major protocol deviations.
Figure 2.
Patient disposition, stage 1.
Patient disposition (stage 1) is shown in Figure 2. Reasons for patients failing screening were: entry criteria not met (other than serum phosphorus concentration; 39.1%), serum phosphorus concentration <1.94 mmol/l (34.3%), withdrawal of consent (6.4%), investigator decision (1.8%), death during screening/washout (0.3%), and other (18.4%).
Patient baseline demographics (stage 1) are given in Table 1. Treatment groups were largely similar with regard to baseline characteristics, with no major differences between demographic subgroups. Across both treatment groups, 92% of patients were undergoing HD.
Table 1. Baseline demographics, Stage 1 (FAS; N=1041).
| Parameter | PA21 | Sevelamer | Total |
|---|---|---|---|
| N (%) | 694 (100%) | 347 (100%) | 1041 (100%) |
| Mean (s.d.) age (years) | 56 (13) | 56 (15) | 56 (14) |
| Male (%) | 55.2 | 63.1 | 57.8 |
| Race | |||
| White (%) | 77.2 | 75.8 | 76.8 |
| Black/African American (%) | 18.3 | 21.6 | 19.4 |
| Other (%) | 4.5 | 2.6 | 3.8 |
| Ethnicity | |||
| Hispanic/Latino (%) | 12.7 | 11.0 | 12.1 |
| Non-Hispanic/Latino (%) | 87.3 | 89.0 | 87.9 |
| Mean (s.d.) weight (kg) | 83 (21) | 84 (21) | 83 (21) |
| Reason for end-stage renal disease | |||
| Hypertension (%) | 22.8 | 25.4 | 23.6 |
| Glomerulonephritis (%) | 22.3 | 25.1 | 23.2 |
| Diabetic nephropathy (%) | 28.2 | 27.1 | 27.9 |
| Other (%) | 26.7 | 22.5 | 25.3 |
| Dialysis modality | |||
| Hemodialysis (%) | 91.9 | 91.6 | 91.8 |
| Peritoneal (%) | 8.1 | 8.4 | 8.2 |
| Mean (s.d.) time from first dialysis (months) | 51 (49) | 54 (55) | 52 (51) |
| Prior phosphate binders | |||
| Calcium-based (%) | 65.6 | 64.8 | 65.3 |
| Aluminum-based (%) | 3.0 | 4.0 | 3.4 |
| Lanthanum (%) | 6.5 | 4.0 | 5.7 |
| Sevelamer (%) | 34.3 | 35.7 | 34.8 |
| Any time in previous 12 months (%) | 37.3 | 39.5 | 38.0 |
| Other (%) | 1.3 | 0.9 | 1.2 |
Abbreviations: FAS, full analysis set; PA21, sucroferric oxyhydroxide.
The most common major protocol deviations were non-adherence to study treatment (19.5%), treatment duration ⩽11 weeks (13.2%), and use of any phosphate binders during washout or use of non-study phosphate binders between baseline and week 12 (5.6%).
Adherence from baseline to week 24 was 82.6% in the PA21 treatment group and 77.2% in the SEV treatment group. Furthermore, data suggest that non-adherence to study treatment (defined as taking <70% of the expected number of tablets) was more common in patients receiving SEV compared with PA21 (21.3% vs. 15.1%, respectively). No differences in diet between the PA21 and SEV treatment groups were observed.
Overall, 27.5% of patients receiving PA21 and 16.0% of those receiving SEV were withdrawn prematurely from the study. The most common reasons for study withdrawal (all patients) were adverse events (AEs) other than phosphorus or calcium concentrations (45.8%), and withdrawn consent (18.7%) (Figure 2). Mean (s.d.) prewashout serum phosphorus concentrations in the FAS were 1.99 mmol/l (0.558) in the PA21 group (N=694) and 1.96 mmol/l (0.521) in the SEV group (N=347).
Efficacy
Non-inferiority of PA21 versus SEV was demonstrated: the upper bound of the 97.5% one-sided confidence interval of the least-squares mean difference in change from baseline to week 12 in serum phosphorus was 0.15 mmol/l, which was below the predefined non-inferiority margin of 0.19 mmol/l (Supplementary Data and Table S2 online). Mean changes in serum phosphorus concentrations from baseline to week 12 were −0.71 mmol/l in the PA21 group and −0.79 mmol/l in the SEV group. Results of the non-inferiority analysis in the FAS were consistent with PPS results: the upper bound of the 97.5% one-sided confidence interval of the least-squares mean difference in change from baseline to week 12 in serum phosphorus was 0.16 mmol/l, which was also below the predefined non-inferiority margin. There were no significant interactions of demographic and disease covariates (including the type of dialysis) with treatment effects.
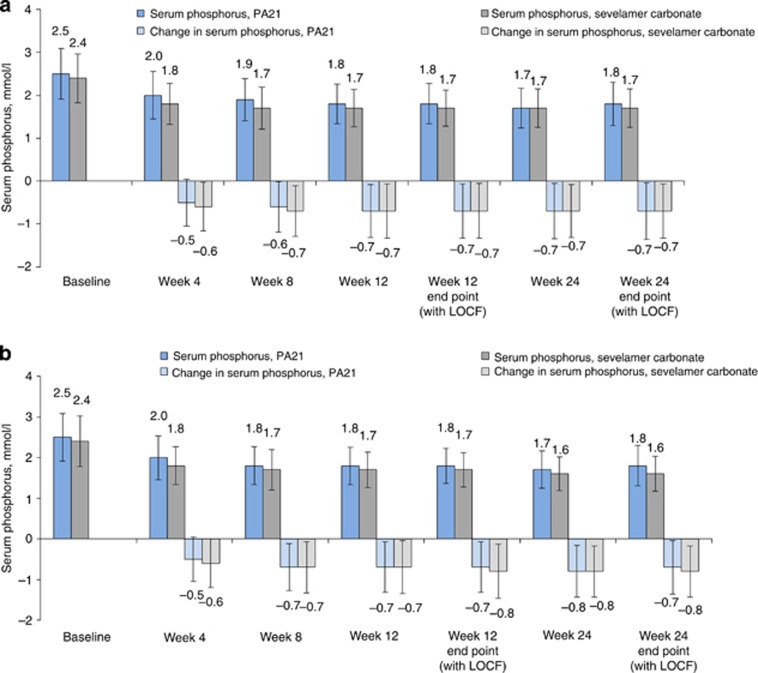
Patients taking PA21 and SEV initiated treatment on two and six tablets per day, respectively; in the FAS, mean baseline phosphorus values were 2.5 and 2.4 mmol/l, respectively (Figure 3). Rapid reductions in mean serum phosphorus were seen in both treatment groups and were maintained to the week 24 end point (Figure 3).
Figure 3.
Serum phosphorus concentrations and changes versus baseline during the study period. (a) Mean (±s.d.) serum phosphorus concentrations and mean (±s.d.) serum phosphorus changes from baseline (full analysis set (FAS); N=1041). (b) Mean (±s.d.) serum phosphorus concentrations and mean (±s.d.) serum phosphorus changes from baseline (per-protocol set (PPS); N=685). LOCF, last observation carried forward.
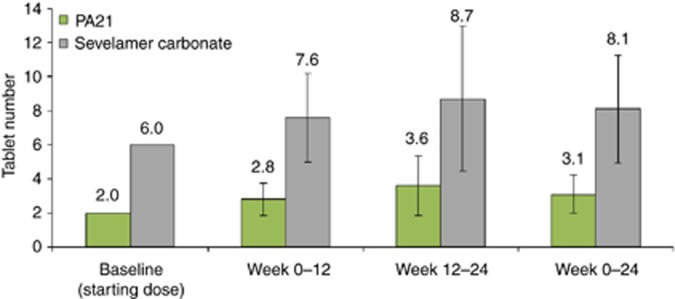
For the first 12 weeks, mean pill burden in the PA21 and SEV treatment groups was 2.8 and 7.6 tablets per day, respectively. The mean pill burden in the maintenance phase was 3.6 tablets per day for PA21 and 8.7 tablets per day for SEV (Figure 4). The pill burden remained greater with SEV than with PA21 over the whole course of the study, and the overall mean number of tablets taken per day from baseline to week 24 being 3.1 for PA21 and 8.1 for SEV.
Figure 4.
Mean (±s.d.) daily number of tablets taken (full analysis set (FAS); N=1041).
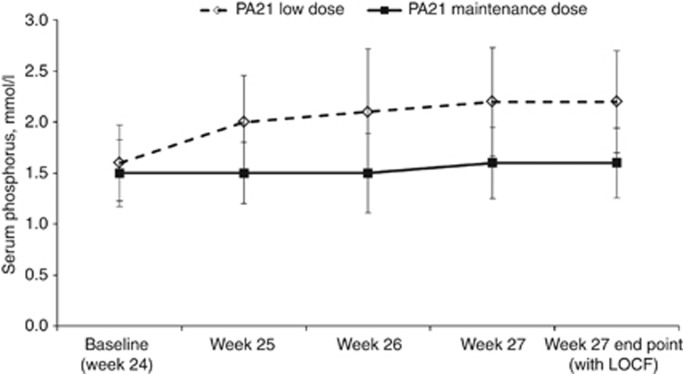
At week 24, mean serum phosphorus concentrations in the primary efficacy set were similar in both treatment groups: 1.5 mmol/l in the maintenance dose (MD) group (n=50) and 1.6 mmol/l in the LD group (n=49; Figure 5). In the MD group, mean serum phosphorus concentrations did not change significantly from weeks 24 to 27. However, in the LD group mean values increased by 0.6 mmol/l, which was significantly higher than that in the MD group (P<0.001), thereby demonstrating superiority of the MD group. There were no significant interactions of demographic and disease covariates with treatment effects. Similar results were obtained for the primary efficacy per-protocol set.
Figure 5.
Mean (±s.d.) serum phosphorus concentrations in stage 2 (primary efficacy set (PES); N=93). LOCF, last observation carried forward.
Median serum intact parathyroid hormone concentrations decreased significantly from baseline to week 24 in both treatment groups; the decrease was more pronounced in the PA21 group (P=0.0400 for the comparison of changes between groups; Supplementary Data Table S1 online). Median serum concentrations of 25(OH)D decreased from baseline to week 24 in both treatment groups (Supplementary Data and Table S1 online). This change from baseline to week 24 was statistically significant in both treatment groups, with the decrease being more pronounced with SEV (P=0.0190 for the comparison of changes between groups). Median serum concentrations of 1,25(OH)2D remained unchanged from baseline to week 24 in the PA21 group, but decreased significantly from baseline to week 24 in the SEV group (P=0.0316 for the comparison of changes between groups).
Safety
The percentage of patients that reported at least one treatment-emergent AE (TEAE) was higher with PA21 (83.2%) than with SEV (76.1%). TEAEs reported more frequently with PA21 were diarrhea (PA21, 20.1% SEV, 7.5%), discolored stools (PA21, 15.4% SEV, 0.3%), and hyperphosphatemia (PA21, 11.2% SEV, 7.8%), whereas constipation (PA21, 3.8% SEV, 7.2%) and nausea (PA21, 7.2% SEV, 11.2%) were reported more frequently with SEV, over 24 weeks in stage 1 (Table 2). Incidences of severe and serious TEAEs and deaths were similar between PA21 and SEV treatment groups.
Table 2. Overall TEAEs and TEAEs occurring in ⩾5% of patients in either treatment group, stage 1 (SS; N=1055).
| PA21 (N=707) (%) | Sevelamer (N=348) (%) | |
|---|---|---|
| Any TEAE | 83.2 | 76.1 |
| Any severe TEAE | 11.5 | 10.9 |
| Any serious TEAE | 18.2 | 19.8 |
| Withdrawals due to TEAEs | 15.7 | 6.6 |
| Death | 1.8 | 2.0 |
| Any GI TEAE | 45.1 | 33.6 |
| Any GI TEAE, excluding isolated discolored feces | 39.0 | 33.3 |
| Diarrhea | 20.1 | 7.5 |
| Feces discolored | 15.4 | 0.3 |
| Hyperphosphatemia | 11.2 | 7.8 |
| Nausea | 7.2 | 11.2 |
| Hypertension | 6.4 | 7.5 |
| Vomiting | 4.4 | 5.5 |
| Constipation | 3.8 | 7.2 |
Abbreviations: GI, gastrointestinal; PA21, sucroferric oxyhydroxide; SS, safety set; TEAE, treatment-emergent adverse event.
Few severe (PA21, 1.0% SEV, 1.1%) or serious TEAEs (PA21, 0.3% SEV, 0.0%) were considered related to study treatment by the investigator (data not shown). One patient treated with PA21 was hospitalized for evaluation of discolored feces, which was therefore classified as serious per definition. PA21 was not discontinued and the condition was reported as recovered without sequelae. One patient in the PA21 treatment group developed a duodenal ulcer with GI bleeding, classified as serious and treatment-related, which was later resolved. No fatal TEAEs were related to study treatment. Reported deaths were mostly related to cardiac disorders.
A higher incidence of TEAEs leading to withdrawal was observed with PA21 (15.7% and 6.6% for PA21 and SEV, respectively). In both treatment groups, GI events accounted for large proportions of the TEAEs leading to withdrawal (54.0% and 43.5%, respectively). The most frequent AEs leading to withdrawal are shown in Table 3. Of note, 1.4% of patients in the PA21 group withdrew because of hyperphosphatemia, compared with none in the SEV group. Although not requiring withdrawal, over the course of the study, 9.9% of patients received PA21, and 12.9% of patients taking SEV required ⩾1 dose adjustment for tolerability.
Table 3. TEAEs that led to study withdrawal in ⩾1.0% of patients in either treatment group, stage 1 (SS; N=1055).
| PA21 (N=707) (%) | Sevelamer (N=348) (%) | |
|---|---|---|
| Any TEAE | 15.7 | 6.6 |
| Diarrhea | 2.8 | 0.6 |
| Nausea | 1.6 | 0.6 |
| Abnormal product taste | 1.6 | 0.3 |
| Hyperphosphatemia | 1.4 | 0.0 |
| Constipation | 1.0 | 1.4 |
| Vomiting | 1.0 | 0.6 |
Abbreviations: AE, adverse event; PA21, sucroferric oxyhydroxide; SS, safety set; TEAE, treatment-emergent AE.
The most frequent TEAEs were GI in nature. The overall incidence of GI TEAEs was higher with PA21 (45.1% vs. 33.6% with SEV; Table 2). Excluding isolated cases of discolored feces, the incidence of GI TEAEs was 39.0% in the PA21 group and 33.3% in the SEV group. A higher proportion of treatment-related TEAEs was reported in the PA21 group (39.6% vs. 19.8% in the SEV group). These differences between treatment groups were largely driven by higher incidences of discolored feces and diarrhea. All cases of discolored feces associated with PA21 were reported during the titration phase and rarely led to withdrawal (0.7%).
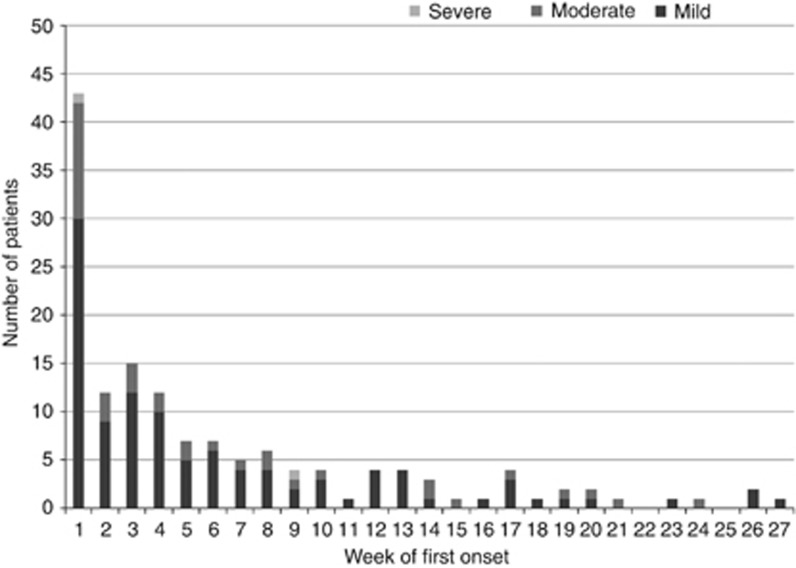
Diarrhea generally presented early in treatment (Figure 6), and resolved without the need for specific therapies or treatment changes. The proportions of patients experiencing diarrhea were higher during the titration phase compared with the maintenance phase for both PA21 (17.3% vs. 5.5%) and SEV (6.0% vs. 2.3%). Most cases of diarrhea were mild in both the PA21 (69%) and SEV (58%) groups. Diarrhea led to withdrawal in 2.8% of patients receiving PA21 (mainly in the titration phase) and in 0.6% of those receiving SEV.
Figure 6.
Time to first-onset of diarrhea in patients treated with PA21 (sucroferric oxyhydroxide), by severity (safety set (SS); N=707).
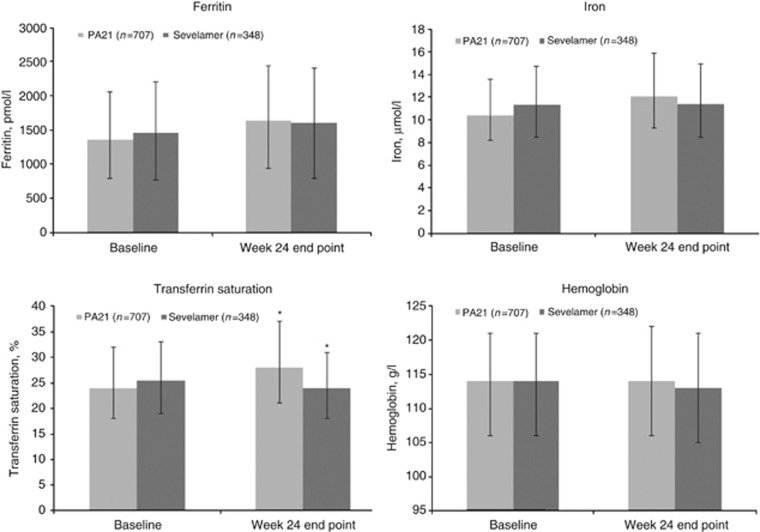
Iron parameters are shown in Figure 7. There were no significant changes in hemoglobin parameters. Median serum ferritin concentrations increased in both treatment groups. Increases in transferrin saturation were only seen with PA21. Iron parameters are also shown by region (Supplementary Data and Figure S1 online). In the overall population, >70 and >80% of patients received concomitant intravenous iron products and erythropoiesis-stimulating agents, respectively, during the study. Specifically, 70.6% of patients in the PA21 group and 74.1% of patients in the SEV group received concomitant iron products during stage 1. Use of intravenous iron products varied by region: it was 72.5% in the United States, 53.4% in Europe, and 33.3% in all remaining countries in the study.
Figure 7.
Median iron parameters (±interquartile range) at baseline and at week 24 end point (safety set (SS); N=1055). Interquartile ranges are shown as error bars. *Indicates a statistically significant difference between PA21 and sevelamer carbonate groups (Iron: P=0.0296; Transferrin saturation: P<0.0001), based on the Wilcoxon Mann–Whitney test.
Median serum concentrations of C-reactive protein did not change from baseline to week 24 in the PA21 group and decreased by 0.10 mg/l in the SEV group (P=0.0270 for the comparison of changes between groups; Supplementary Data and Table S1 online).
DISCUSSION
PA21 was found to be non-inferior to SEV, as reductions in serum phosphorus concentrations were similar (0.71 and 0.79 mmol/l over the first 12 weeks of treatment, respectively), and maintained its phosphorus-lowering effect over 24 weeks with a considerably lower pill burden than SEV. In addition, treatment for 3 weeks with PA21 MD was superior to PA21 LD in maintaining serum phosphorus control after 24 weeks of treatment. Both primary and secondary efficacy objectives were met, demonstrating that PA21 is effective for the control of hyperphosphatemia in dialysis patients.
Patients undergoing dialysis often have multiple comorbid conditions and subsequently face a high pill burden, with one study showing a median of 19 tablets per day and some dialysis patients taking >30 tablets per day.10 Phosphate binders accounted for 49% of this total daily tablet count, with a median daily pill burden of nine.10 Increased pill burden has been associated with reduced adherence to phosphate binders and lower quality of life.10 Non-adherence to phosphate binders, as high as 62% in patients with end-stage renal disease,10 has been associated with hyperphosphatemia,15 thus increasing the risk of secondary hyperparathyroidism, renal osteodystrophy, cardiovascular disease, and mortality.9, 16, 17 Recently published data from the pharmacy management program of a large dialysis provider indicate that phosphate binder pill burden is negatively associated with medication adherence (defined by the medication possession ratio), which, in turn, is negatively associated with mean phosphorus concentrations.18 Reducing pill burden, while maintaining efficacy, may increase adherence of dialysis patients to phosphate binders and to other medications.
In the current study, patients treated with SEV required on average 2.6 times more tablets per day than those receiving PA21 (8.1 vs. 3.1, respectively) to achieve comparable control of serum phosphorus concentrations over 24 weeks.
Patient-reported side effects have been cited as another major reason for poor adherence to, or discontinuation of, phosphate binders.19 As expected in this patient population, the overall incidence of TEAEs was high in both treatment groups, although it was higher with PA21 (83.2%) than with SEV (76.1%). Incidence of severe or serious TEAEs and deaths was similar between groups. The higher incidence of TEAEs with PA21 was largely due to higher incidences of GI TEAEs, particularly diarrhea (PA21, 20.1% SEV, 7.5%) and discolored stools (PA21, 15.4% SEV, 0.3%). Diarrhea, which included descriptions such as ‘loose' or ‘soft' stools, was generally mild, transient, early in onset, led to few withdrawals, and did not require specific treatment in the PA21 treatment group. Such TEAEs should be considered in context: more than one in two patients with end-stage renal disease on dialysis experience constipation.20 Of the reported GI TEAEs, constipation, nausea, and upper abdominal pain/discomfort were more common in patients treated with SEV compared with those receiving PA21. SEV has previously been reported to be associated with nausea, vomiting, constipation, and diarrhea.21 Discolored stools have been commonly reported with PA21, other iron-based phosphate binders,14, 22 and with iron-based products in general.
An increase in ferritin concentrations was observed in both treatment groups, and an increase in transferrin saturation was observed in the PA21 group. These increases occurred early and plateaued on continuing treatment with PA21, indicating no accumulation of iron. One potential explanation for the increase in these iron parameters is the use of intravenous iron in the majority of the study participants, particularly in patients from the United States, who accounted for nearly half of all randomized patients: the implementation of the prospective payment system by the United States Centers for Medicare and Medicaid Services led to an increase in intravenous iron use during the time in which this study was conducted.23 Analysis of iron parameters by region (USA, Europe, and Rest of World) (Supplementary Data and Figure S1 online) is supportive of this explanation. The higher use of intravenous iron in the United States (72.5% compared with 53.4% in Europe and 33.3% across all other countries in the study) is associated with a higher baseline serum ferritin and larger increases in serum ferritin from baseline to week 24 compared with the other two regions. However, the larger increases in ferritin and transferrin saturation in the PA21 treatment group indicate that it cannot be ruled out that a small amount of iron can be absorbed from PA21. This would be in line with data from a phase I study of PA21, in which administration of a single dose of 2.0 g of radiolabeled PA21 was associated with minimal iron absorption in chronic kidney disease patients on dialysis (median 0.02%, range 0–0.04%).12 A more pronounced effect on iron parameters has been reported with another iron-based phosphate binder, ferric citrate;24, 25 the discrepancy in the effects on iron parameters between the two agents may be attributable to the difference between the two compounds, with PA21 being designed to minimize iron release and absorption.12
Low-dose PA21 was chosen as the control in stage 2 because it was proven to be ineffective in a previous phase II study14 and, therefore, provides a way of comparing a placebo-like dose with therapeutic dosing (i.e., PA21 MD). A limitation of the current study is its open-label design. However, use of a double-blind study design was not feasible owing to the differences in formulation and type of administration between PA21 and SEV. Black stools, as a result of the PA21 iron content, would also be difficult to mask properly. Treatment adherence was calculated on the basis of the number of tablets returned by patients; it is widely acknowledged that this method of assessment has limited accuracy, and should be interpreted with caution. The starting dose of PA21 involved two times daily dosing, whereas SEV was taken three times daily. As such, patients who were having more than two meals per day and were receiving PA21 two times daily had at least one meal without a phosphate binder. In retrospect, the use of two times daily dosing as a starting dose was not ideal and may have accounted for the 1.4% of withdrawals due to hyperphosphatemia in the PA21 treatment group that occurred in stage 1 of the study. However, by weeks 12–24, the mean daily number of tablets in the PA21 group was 3.6 (Figure 4), indicating that most patients in the PA21 group were receiving a three times daily dosing. Given this observation, the study sponsor will seek approval for a three times daily dosing schedule. Finally, it should be noted that 38% of patients in this study had received treatment with SEV during the 12 months before study entry. As such, a large proportion of patients may already have been familiar with and acclimated to the side effects associated with SEV, which may have affected the perception and reporting of AEs in this treatment group.
In conclusion, PA21 had similar efficacy and tolerability to SEV in dialysis patients, although having a lower pill burden. Therefore, PA21 may represent a new treatment option for hemo- (HD) and peritoneal dialysis (PD) patients, with the potential for improved adherence.
MATERIALS AND METHODS
Study design
This was a multicenter, open-label, two-stage, prospective, randomized, parallel-group, active-controlled study of PA21 compared with SEV conducted in 174 sites across Europe, the United States, Russia, Ukraine, and South Africa (Figure 1).
There were two major efficacy objectives: to investigate non-inferiority of PA21 versus SEV, and superiority of the PA21 MD versus LD. Stage 1 (baseline to week 24) evaluated changes in serum phosphorus from baseline in the PA21 and SEV treatment groups: the efficacy objective was to demonstrate non-inferiority of PA21 versus SEV at week 12. Stage 2 (weeks 24–27) was an open-label, 3-week comparison of PA21 MD versus LD control (fixed dose of 250 mg per day) performed only in HD patients previously treated with PA21. The efficacy objective in stage 2 was to demonstrate superiority of PA21 MD versus LD.
The protocol was reviewed by Independent Ethics Committees or Institutional Review Boards, and the study was conducted in accordance with the Declaration of Helsinki Principles, the International Conference on Harmonisation E6 Guideline for Good Clinical Practice, Committee for Proprietary Medicinal Products guideline (CPMP/ICH/135/95), and was compliant with the European Union Clinical Trial Directive (Directive 2001/20/EC) and the Code of Federal Regulations for informed consent and protection of patient rights. The study is registered as NCT01324128 on the ClinicalTrials.gov website. Informed consent was obtained before any study-specific procedures were performed. The first screening visit took place in March 2011.
Following screening, eligible patients completed a 2–4 week washout from their previous phosphate binders. Patients with serum phosphorus concentrations ⩾1.94 mmol/l were then randomized to treatment via an interactive voice response system (Perceptive Informatics, Billerica, MA). Patients were randomized in a 2:1 ratio to receive PA21 1.0–3.0 g per day (2–6 chewable tablets per day) or SEV 4.8–14.4 g per day (6–18 tablets per day). Doses of PA21 are based on iron content. PA21 chewable tablets are 2 cm (diameter) × 6 mm (depth). SEV tablets are oval and 19 mm in diameter.
Patients receiving PA21 began stage 1 with a dose of 1.0 g per day (2 chewable tablets per day), and those receiving SEV began with a dose of 4.8 g per day (6 tablets per day). The daily dose distribution at the start of the study differed across the two treatment groups: the starting dose of PA21 was taken two times daily, whereas SEV was taken three times daily. At the start of the study, patients in the PA21 group were advised to take one PA21 tablet with each of the two largest meals of the day. ‘Largest meals' were defined as the meals with the highest phosphorus content. The study comprised an 8-week dose titration, during which doses of each drug could be titrated for efficacy or tolerability, followed by 4 weeks during which dose changes were only permitted for tolerability. A 12-week maintenance period followed, during which dose titration was permitted for efficacy and tolerability. The permitted dose titration for PA21 was 500 mg per day (1 tablet) every 2 weeks (minimum dose, 1.0 g per day (2 tablets); maximum dose, 3.0 g per day (6 tablets)). For SEV, the permitted dose titration was 2.4 g per day (3 tablets) every 2 weeks (minimum dose, 2.4 g per day (3 tablets); maximum dose, 14.4 g per day (18 tablets)). Patients participating in stage 2 were randomized to receive either the same dose of PA21 that they had been receiving at the end of stage 1 (week 24) or low-dose PA21 (250 mg per day) for 3 weeks, with no dose adjustments permitted.
Concomitant medications that have a direct influence on serum phosphorus concentrations (e.g., vitamin D, vitamin D analogs, and calcimimetics) remained unchanged as far as possible, in accordance with local clinical practice. Laboratory testing was performed at central laboratories, although local laboratories could be used for the measurement of serum phosphorus concentrations for dose titration purposes.
Participants
Eligible patients (aged ⩾18 years) had a history of hyperphosphatemia and were treated with stable doses of phosphate binders for ⩾1 month before screening. Eligible patients also received maintenance HD three times per week (Kt/V ⩾1.2) or PD (Kt/V ⩾1.7) for at least 3 months before screening. Patients were also required to have serum phosphorus concentrations ⩾1.94 mmol/l during the washout period.
Patients were ineligible for the study if they presented with intact parathyroid hormone concentrations >800 ng/l (88 pmol/l) at screening, or if parathyroidectomy was planned or expected. Patients were also excluded if they had significant GI or hepatic disorders, or major GI surgery or serum ferritin >4494 pmol/l (>2000 μg/l) at screening. Patients on PD with a history of peritonitis in the past 3 months or ⩾3 episodes in the past 12 months were ineligible. Patients receiving non-calcium-based phosphate binders with hypercalcemia (total serum calcium >2.60 mmol/l), or patients with hypocalcemia (total serum calcium <1.9 mmol/l) at screening were also excluded. Antacids containing aluminum, calcium, or magnesium, and oral iron therapies/supplements were not permitted.
Patients were withdrawn if, despite appropriate interventions, their serum phosphorus concentrations exceeded the upper safety limit of 2.75 mmol/l or decreased below the lower safety limit of 0.81 mmol/l, or total serum calcium concentrations exceeded 2.75 mmol/l.
Assessments
Patients on HD had weekly study visits for the first 8 weeks of treatment, and then every 4 weeks until week 24. Study visits were planned to coincide with the first dialysis session of the week. Collection of laboratory samples was completed before dialysis, that is, serum phosphorus was measured predialysis. Patients on PD had study visits every second week for the first 8 weeks of treatment, and then every 4 weeks until week 24. All subsequent study visits were scheduled on the same day thereafter (±1 day).
In both HD and PD patients, AEs and concomitant medications were recorded from screening (informed consent signature) to the end of study participation.
Per-protocol, hyperphosphatemia was defined as serum phosphorus >2.75 mmol/l, hypophosphatemia as serum phosphorus <0.81 mmol/l, and hypercalcemia as total serum calcium >2.75 mmol/l, despite appropriate dose adjustments or interventions. Patients had to be withdrawn when these limits were exceeded.
Treatment adherence was calculated on the basis of the number of tablets returned by patients:
 |
Sample size calculations and statistics
The primary efficacy end point was an analysis of the superiority of PA21 MD versus LD in maintaining the phosphorus lowering effect in patients undergoing HD, by assessing serum phosphorus from weeks 24 to 27 (stage 2; Figure 1). The key secondary efficacy end point was an analysis of the non-inferiority of PA21 compared with SEV in lowering serum phosphorus in patients on dialysis, by assessing change in serum phosphorus from baseline to week 12 (stage 1). The safety end points were AEs and routine biochemical and hematologic laboratory parameter changes from baseline.
The study sample size was determined by the non-inferiority comparison between PA21 and SEV, with the following assumptions: a mean decrease in serum phosphorus concentrations of 0.65 mmol/l in both treatment groups, with a standard deviation of 0.63 mmol/l, a power of 90%, a non-inferiority margin of 0.19 mmol/l, and a randomization ratio of 2:1 (PA21:SEV). A total of 507 per-protocol patients was required. To account for a 20% rate of patients being excluded from the per-protocol group, a minimum of 636 patients was required. Sample size was then increased to 940 patients to ensure sufficient numbers to meet regulatory requirements for long-term safety. The sample size for stage 2 of the study was based on the primary efficacy end point. The number of patients needed for this analysis was 50 per group, assuming a difference in serum phosphorus concentrations of 0.42 mmol/l between groups, a standard deviation of 0.63 mmol/l, a power of 90%, and a two-sided significance value of 0.05.
The study analyses involved various patient populations. The FAS comprised patients randomized to treatment who received ⩾1 dose of study medication and had at least one post-baseline evaluable efficacy assessment. The PPS consisted of patients who, in addition to the FAS criteria, had completed the treatment course from baseline to week 12, had at least one evaluable serum phosphorus result at or after week 12, and had no major protocol deviations. The SS comprised all randomized patients who took at least one dose of study medication. The primary efficacy set comprised patients who were randomized to stage 2, received ⩾1 dose of study medication during stage 2 and had ⩾1 evaluable postbaseline efficacy assessment during stage 2. The primary efficacy per-protocol set comprised patients who were randomized to stage 2 and had no major protocol deviations.
The secondary non-inferiority efficacy analysis was conducted on the PPS and the FAS using an analysis of covariance, and the last observation carried forward approach of missing data imputation, with the baseline serum phosphorus concentration, dialysis modality (HD or PD), and geographical regions (USA, Europe, and other countries) as covariates. The primary efficacy analysis was also assessed using an analysis of covariance, with week 24 serum phosphorus concentration and region as covariates for the primary efficacy set and primary efficacy per-protocol set. Analysis of covariance for the primary efficacy end point used the last observation carried forward approach. In addition, other covariates such as sex, age, race, ethnicity, time from first dialysis, reason for end-stage renal disease, number of prior phosphate binders, prior use of SEV (for the non-inferiority analysis only), and the interactions between these covariates and treatment were investigated in separate models. The interactions were tested at a level of 0.10. Summary statistics were used to analyze safety data from the SS.
Overall adherence, based on the number of tablets taken relative to the number expected to be taken, was summarized using descriptive statistics. Patients were recorded as being adherent if their adherence was within 70–120% of the expected tablet intake.
Unless otherwise stated, all statistical tests on efficacy data were performed using two-sided tests at the 5% significance level. The analyses were conducted using SAS® version 9.2 or later (SAS Institute, Cary, NC). Differences in demographic and adherence data and AE reporting described in the text were not tested for statistical significance and are descriptive only.
Acknowledgments
We thank all of the PA-CL-05A study investigators. The authors acknowledge editorial assistance from AXON Communications.
JF has received lecture and consulting fees from Amgen, Abbott, Fresenius, Sanofi, and Vifor. ACC has received lecture and consulting fees from Amgen, Abbott, Fresenius, and Vifor. MK has received speaker and consultant honoraria from AbbVie, Amgen, Fresenius Medical Care, Medice, Mitsubishi, Sanofi, Shire, and Vifor. AR has taken part in speaker bureaus for ViiV Healthcare Systems, Sanofi/Genzyme, Questcor, and Cubist and has taken part in advisory boards for Vifor. SMS has received grant support and/or consulting fees from Amgen, Abbott, Cytochroma, Kai, Shire, and Vifor. EMFC, SG, and LJL are employees of Vifor.
Footnotes
SUPPLEMENTARY MATERIAL
Table S1. Median (interquartile range) of serum Vitamin D, CRP and and iPTH concentrations at baseline and Week 24 Endpoint* (Stage 1; safety set, N=1,055).
Table S2. Analysis of change in serum phosphorus concentrations from baseline to Week 12 (PPS [N=685] and FAS [N=1041]).
Figure S1. Median iron parameters (±interquartile range) at baseline and at Week 24, by region (SS; N=1,055).
Supplementary material is linked to the online version of the paper at http://www.nature.com/ki
Supplementary Material
References
- Hruska KA, Mathew S. The roles of the skeleton and phosphorus in the CKD mineral bone disorder. Adv Chronic Kidney Dis. 2011;18:98–104. doi: 10.1053/j.ackd.2011.01.001. [DOI] [PMC free article] [PubMed] [Google Scholar]
- Block GA. Control of serum phosphorus: implications for coronary artery calcification and calcific uremic arteriolopathy (calciphylaxis) Curr Opin Nephrol Hypertens. 2001;10:741–747. doi: 10.1097/00041552-200111000-00003. [DOI] [PubMed] [Google Scholar]
- Block GA, Klassen PS, Lazarus JM, et al. Mineral metabolism, mortality, and morbidity in maintenance hemodialysis. J Am Soc Nephrol. 2004;15:2208–2218. doi: 10.1097/01.ASN.0000133041.27682.A2. [DOI] [PubMed] [Google Scholar]
- Palmer SC, Hayen A, Macaskill P, et al. Serum levels of phosphorus, parathyroid hormone, and calcium and risks of death and cardiovascular disease in individuals with chronic kidney disease: a systematic review and meta-analysis. JAMA. 2011;305:1119–1127. doi: 10.1001/jama.2011.308. [DOI] [PubMed] [Google Scholar]
- Kanbay M, Goldsmith D, Akcay A, et al. Phosphate—the silent stealthy cardiorenal culprit in all stages of chronic kidney disease: a systematic review. Blood Purif. 2009;27:220–230. doi: 10.1159/000197562. [DOI] [PubMed] [Google Scholar]
- Tentori F, Blayney MJ, Albert JM, et al. Mortality risk for dialysis patients with different levels of serum calcium, phosphorus, and PTH: the Dialysis Outcomes and Practice Patterns Study (DOPPS) Am J Kidney Dis. 2008;52:519–530. doi: 10.1053/j.ajkd.2008.03.020. [DOI] [PubMed] [Google Scholar]
- Isakova T, Gutierrez OM, Chang Y, et al. Phosphorus binders and survival on hemodialysis. J Am Soc Nephrol. 2009;20:388–396. doi: 10.1681/ASN.2008060609. [DOI] [PMC free article] [PubMed] [Google Scholar]
- Lopes AA, Tong L, Thumma J, et al. Phosphate binder use and mortality among hemodialysis patients in the Dialysis Outcomes and Practice Patterns Study (DOPPS): Evaluation of Possible Confounding by Nutritional Status. Am J Kidney Dis. 2012;60:90–101. doi: 10.1053/j.ajkd.2011.12.025. [DOI] [PMC free article] [PubMed] [Google Scholar]
- Arenas MD, Malek T, Gil MT, et al. Challenge of phosphorus control in hemodialysis patients: a problem of adherence. J Nephrol. 2010;23:525–534. [PubMed] [Google Scholar]
- Chiu YW, Teitelbaum I, Misra M, et al. Pill burden, adherence, hyperphosphatemia, and quality of life in maintenance dialysis patients. Clin J Am Soc Nephrol. 2009;4:1089–1096. doi: 10.2215/CJN.00290109. [DOI] [PMC free article] [PubMed] [Google Scholar]
- Wang S, Alfieri T, Braunhofer P, et al. Pill burden and its Association with Medication Possession Ratio Among Hemodialysis Patients with Hyperphosphatemia. Abstract presented at the European Renal Association—European Dialysis and Transplantation Association Annual Meeting; 24–27 May 2012 Paris, France.
- Geisser P, Philipp E. PA21: a novel phosphate binder for the treatment of hyperphosphatemia in chronic kidney disease. Clin Nephrol. 2010;74:4–11. doi: 10.5414/cnp74004. [DOI] [PubMed] [Google Scholar]
- Hergesell O, Ritz E. Stabilized polynuclear iron hydroxide is an efficient oral phosphate binder in uraemic patients. Nephrol Dial Transplant. 1999;14:863–867. doi: 10.1093/ndt/14.4.863. [DOI] [PubMed] [Google Scholar]
- Wuthrich RP, Chonchol M, Covic A, et al. Randomized clinical trial of the iron-based phosphate binder PA21 in hemodialysis patients. Clin J Am Soc Nephrol. 2013;8:280–289. doi: 10.2215/CJN.08230811. [DOI] [PMC free article] [PubMed] [Google Scholar]
- Tentori F, Karaboyas A, Bieber B, et al. Self-reported non-adherence with phosphate binder prescription is associated with high serum phosphorus and PTH: results from the DOPPS [abstract] J Am Soc Nephrol. 2012;23:793A. [Google Scholar]
- Karamanidou C, Clatworthy J, Weinman J, et al. A systematic review of the prevalence and determinants of nonadherence to phosphate binding medication in patients with end-stage renal disease. BMC Nephrol. 2008;9:2. doi: 10.1186/1471-2369-9-2. [DOI] [PMC free article] [PubMed] [Google Scholar]
- Denhaerynck K, Manhaeve D, Dobbels F, et al. Prevalence and consequences of nonadherence to hemodialysis regimens. Am J Crit Care. 2007;16:222–235. [PubMed] [Google Scholar]
- Bond C, Wang S, Alfieri T, et al. Pill Burden and its Association with Medication Possession Ratio Among Hemodialysis Patients with Hyperphosphatemia. Abstract presented at the 49th Annual Meeting of the European Renal Association—European Dialysis and Transplantation Association; 24–27 May 2012 Paris, France.
- Alfieri T, Wang S, Braunhofer P, et al. Reasons for phosphate binder discontinuation vary by binder type [Abstract] J Am Soc Nephrol. 2012;23:793A. doi: 10.1053/j.jrn.2013.11.004. [DOI] [PubMed] [Google Scholar]
- Murtagh FE, Addington-Hall J, Higginson IJ. The prevalence of symptoms in end-stage renal disease: a systematic review. Adv Chronic Kidney Dis. 2007;14:82–99. doi: 10.1053/j.ackd.2006.10.001. [DOI] [PubMed] [Google Scholar]
- Renvela® (sevelamer carbonate) Prescribing Information. Genzyme Corporation: Cambridge, MA; 2011. [Google Scholar]
- Sinsakul M, Sika M, Koury M, et al. The safety and tolerability of ferric citrate as a phosphate binder in dialysis patients. Nephron Clin Pract. 2012;121:c25–c29. doi: 10.1159/000341922. [DOI] [PubMed] [Google Scholar]
- Pisoni RL, Fuller DS, Bieber BA, et al. The DOPPS Practice Monitor for US dialysis care: trends through August 2011. Am J Kidney Dis. 2012;60:160–165. doi: 10.1053/j.ajkd.2012.04.001. [DOI] [PubMed] [Google Scholar]
- Dwyer JP, Sika M, Schulman G, et al. Dose-response and efficacy of ferric citrate to treat hyperphosphatemia in hemodialysis patients: a short-term randomized trial. Am J Kidney Dis. 2013;61:759–766. doi: 10.1053/j.ajkd.2012.11.041. [DOI] [PubMed] [Google Scholar]
- Sinsakul M, Sika M, Koury M, et al. The safety and tolerability of ferric citrate as a phosphate binder in dialysis patients. Nephron Clin Pract. 2012;121:c25–c29. doi: 10.1159/000341922. [DOI] [PubMed] [Google Scholar]
Associated Data
This section collects any data citations, data availability statements, or supplementary materials included in this article.


