Abstract
Nonalcoholic fatty liver disease is the most prevalent chronic liver disease in Western societies. MRI can quantify liver fat, the hallmark feature of nonalcoholic fatty liver disease, so long as multiple confounding factors including decay are addressed. Recently developed MRI methods that correct for to improve the accuracy of fat quantification either assume a common (single- ) for better stability and noise performance or independently estimate the for water and fat (dual- ) for reduced bias, but with noise performance penalty. In this study, the tradeoff between bias and variance for different correction methods is analyzed using the Cramér-Rao bound analysis for biased estimators and is validated using Monte Carlo experiments. A noise performance metric for estimation of fat fraction is proposed. Cramér-Rao bound analysis for biased estimators was used to compute the metric at different echo combinations. Optimization was performed for six echoes and typical values. This analysis showed that all methods have better noise performance with very short first echo times and echo spacing of ∼π/2 for single- correction, and ∼2π/3 for dual- correction. Interestingly, when an echo spacing and first echo shift of ∼π/2 are used, methods without correction have less than 5% bias in the estimates of fat fraction.
Keywords: noise analysis, chemical-shift imaging, T2* correction, hepatic steatosis, Cramér-Rao bound analysis for biased estimators
Nonalcoholic fatty liver disease is the most common chronic liver disease in United States, affecting up to 30% of adults (1,2) and 10% of children (3–5). It is closely associated with obesity, insulin resistance, and metabolic syndrome, afflicting 60–75% of obese persons (6). Intracellular accumulation of triglycerides (hepatic steatosis) is the hallmark feature of nonalcoholic fatty liver disease. Histological analysis of steatosis based on liver biopsy is the current reference standard for assessment of hepatic fat content. However, biopsy is inherently subjective and limited, due to sampling variability, high cost, and risk of complications. For these reasons, biopsy is also poorly suited for longitudinal studies.
Recent work by multiple groups has demonstrated that MRI can accurately quantify hepatic fat content in the form of the proton density fat fraction (7–14). Accurate measurement of fat fraction requires the following confounding factors to be addressed: B0 inhomogeneities (15,16), spectral complexity of fat (9,17), noise bias (18), T1 bias (9,18), eddy currents (19), and decay (9,17,20,21).
Most MRI methods that correct for decay to improve the accuracy of fat quantification assume a common (single- ) for water and fat (9,17,20). At relatively low (high) fat fractions, the of water (fat) dominates, and single- correction provide accurate measurement of fat content. However, water and fat signals have independent in general, which may impact estimation of fat content, particularly at high fat fractions and short (21).
To account for independent of water and fat, O'Regan et al. (22) described a “magnitude-based” independent correction method. Unfortunately, this approach did not account for the spectral complexity of fat, which is necessary for accurate fat quantification to avoid large errors that may be clinically significant (12,23).
Chebrolu et al. (21) recently reported a “complex-based” algorithm that uses both magnitude and phase information. They included spectral modeling in combination with independent correction (dual- ) of water and fat. High accuracy in fat quantification with the dual- model was demonstrated in a fat–water super-paramagnetic iron oxide phantom. However, the dual- method (21) becomes ill-conditioned at fat fractions close to 0% or 100%, because it is not possible to estimate the of a species accurately in the presence of noise, if that species is present in low concentrations. This instability requires constrained reconstruction methods that increase the complexity of the estimation algorithm. In addition, the dual- model introduces additional degrees of freedom that may degrade noise performance in estimates of fat fraction.
Previous works (20,24) used the Cramér-Rao bound (CRB) analysis of unbiased estimators for characterizing the noise performance of chemical shift-based water–fat separation methods. Hernando et al. (25–27) recently compared the performance of fat quantification methods using CRB analysis of unbiased estimators. However, bias may result when no correction or single- correction is used. In such scenarios, the CRB analysis of biased estimators (28) may be more appropriate. One possible reason for the differences between theory and Monte Carlo simulations seen in the previous work (25–27) may have resulted from the use of CRB analysis of unbiased estimators.
Therefore, the major purpose of this work is to compare the bias and the noise performance of single- and dual- correction methods using CRB analysis of biased estimators for better understanding of the tradeoffs needed to improve the accuracy of fat quantification, i.e., is the reduction in bias using a dual- model outweighed by its reduced noise performance, increased complexity and instability?
In previous noise analyses of chemical shift-based water–fat separation methods, noise performance was characterized for water-only and/or fat-only images (15,20,24). However, fat fraction is the most commonly used metric for quantifying fat content because it is independent of B1 coil sensitivity (10–12,22,29,30). Therefore, a secondary purpose of this work was to construct a noise performance metric (NPM) for fat fraction. This metric and CRB analysis for biased estimators (CRBBE) were used to investigate the noise performance of the correction methods. The bias and noise performance of methods without correction were also computed for comparison.
The performance of the correction methods analyzed for a wide range of echo combinations and the echo shifts that achieve better performance for fat fraction estimation are reported. To our knowledge, this is the first study that presents CRBBE for chemical shift-based water–fat separation methods.
Theory
Signal Equations
The signal, s(t), from a volume element containing water and fat with independent decay can be written as:
| [1] |
where ρW and ϕW are the magnitude and phase of water signal, ρF and ϕF are the magnitude and phase of fat signal. As expected from the Bloch equations and from experiments by Yu et al. (17), fat peaks have a common initial phase (ϕF) at t = 0. ψ is the shift (Hz) caused by local B0 field inhomogeneities. Δfp is the chemical shift of the pth fat peak relative to water and rp is the relative proportion of the pth fat peak, such that . At clinical field strengths, the triglyceride spectrum shows at least six (P = 6) distinct spectral peaks (31). In this work the values of Δfp and rp are assumed to be known a priori, according to those reported by Hamilton et al. (31).
All the protons on a single triglyceride molecule will experience very similar magnetic field inhomogeneities (21). This is true for both microscopic and macroscopic magnetic field inhomogeneities, both of which accelerate signal decay through enhanced dephasing of spins within an isochromat. The effects of J-coupling, which affects the apparent decay in sequences that use refocusing pulses (e.g., fast spin-echo, point resolved spectrocopy (PRESS)), should be minimal, because our acquisition uses a low flip angle spoiled gradient echo acquisition (see below), which are unaffected by J-coupling (32,33). For all of these reasons, it should be reasonable to assume the same for all the fat peaks, i.e.,
| [2] |
Equation 2 will be used as the dual- signal model. Recently reported experiments in a fat–water–iron phantom demonstrate that the signal model in Eq. 2 accurately models the underlying physics of the water and fat signals in this phantom (21). Further, a recent report in 55 patients comparing single correction to no correction demonstrated excellent agreement between MRI and MR spectroscopy (MRS) (34). These data indicate that single correction accurately modeled the physics of water and fat signal from the liver and adds indirect evidence that the of all fat peaks are similar to each other. It is important to note, however, that in this particular group of patients, there were none who had both iron overload and severe hepatic steatosis. Dual- modeling may still be necessary in patients with both high iron and high fat concentrations.
For N echoes measured at specific echo times tn (n = 1,2, …, N) in the presence of Gaussian noise (35), Eq. 2 can be written in matrix form,
| [3] |
where
| [4] |
and S = [sr(t1) si(t1) … sr(tN) si(tN)]T, , and γ = [ρw ρF]T · sr (tn) si (tn) and are the real and imaginary parts of the signal and noise at the nth echo, respectively.
One challenge in the estimation of water and fat using Eq. 3 is that it becomes ill-conditioned when a voxel contains predominately water or fat (21). To avoid this instability, it can be assumed that the of water and fat are equal (i.e., ), leading to the single- signal model first described by Yu et al. (17) and Bydder at al. (9), i.e.,
| [5] |
For the purposes of calculating bias, we will assume the dual- signal model in Eq. 2 to be “truth.” The bias and noise performance of single versus dual- correction will then be investigated. The bias and noise performance of methods without correction will also be computed for comparison.
Expectation and Variance of Fat Fraction
The performance of the correction methods is analyzed by comparing the bias and the variance in estimates of fat fraction. Fat fraction is defined as the ratio of the density of mobile fat protons (ρF) divided by the cumulative density of mobile water and fat protons (ρW + ρF). In general, there are no simple exact formulas for the expectation and variance of a quotient ( ) of two random variables (ρF, ρW + ρF). However, Mood et al. (36) derived approximate formulae for expectation and variance of the quotient of two random variables that have nonzero covariance. Using these formulae, the expectation value (Eη) and variance of the fat fraction becomes
| [6] |
| [7] |
where the expectation of ρW and ρF are EρW and EρF, the variance of ρW and ρF are and and the covariance between ρW and ρF is C.
For simplicity of notation, let . Note that μ does not equal Eη in general, except when there is no bias and the variance and covariance of ρW and ρF is small, as can be seen from Eq. 6. Using the expression for μ, Eq. 7 can be further simplified such that the expression for the variance of fat fraction becomes
| [8] |
Equation 8 provides the expression for the variance of fat fraction given the expectation, variance and covariance of both water and fat.
Metric for Analyzing the Noise Performance of Estimation of Fat Fraction
The noise performance of fat–water decomposition has been previously analyzed using the effective number of signal averages, or NSA (15,24,37) as a metric. NSA of water (fat) is the ratio of the variance of the signal (s(tn)) divided by the variance of the estimate water (fat) signal. Analogous to the NSA, we define a NPM for fat fraction as,
| [9] |
This metric for noise performance of the fat fraction provides normalization of the variance of the source signal (σ2). The NPM is the square of the ratio of the normalized measures of dispersion of probability distributions for the source signal (σ/(EρW + EρF)) and fat fraction (σ/1). The normalization of dispersion of probability distribution was performed with the maximum possible values for the source signal (EρW + EρF) and fat fraction (1.0). If the NSA of water and fat magnitude signals are NSAρW and NSAρF then using Eq. 8, the NPMη becomes
| [10] |
The NPMη provides a useful way to combine the NSA of water and fat, the covariance C between water and fat, and the variance of the signal. When C is negligible or when μ. is close to 0 or 1, the term Cμ(1 − μ) in Eq. 10 can be neglected and NPMη become independent of SNR (σ2). Interestingly, if μ = 0 then NPMη = NSAρF, i.e., when there is only water signal, the noise performance of fat fraction depends only on the NSA of fat. The opposite is true when μ = 100%. Intuitively, when the fat fraction approaches 0, the numerator in the expression for fat fraction (ρF) has low SNR, while the denominator (ρW + ρF) has much higher SNR and can be viewed as approximately constant. Thus, η ≈ ρF/(EρW + EρF) is nearly a scaled version of ρF and has similar noise performance as ρF. Analogously, when the fat fraction approaches 1, η ≈ 1 − ρW/(EρW + EρF) is nearly a scaled version of ρF is nearly a scaled and shifted version of ρW.
Expressions for the expectation, variance, and covariance of ρW and ρF are needed for theoretical characterization of the variance in fat fraction. The theoretical expressions for minimum possible variance in the estimates of ρW and ρF are typically calculated using CRB analysis for unbiased estimators. Pineda et al. and Reeder et al. (15,24) theoretically derived and experimentally validated the variance in the estimates of ρW and ρF for three-point chemical shift-based water–fat separation methods that correct for B0 field inhomogeneities. Yu et al,. (20) analyzed the noise performance of six-point fat–water estimation method that uses single- correction.
Cramér-Rao Bound Analysis for Biased Estimators
Methods that assume a single- model (Eq. 5) will, in general, have bias in the estimates of ρW and ρF. Similarly, parameter estimates of methods without correction will, in general, be biased. Previous works (20,24,27) theoretically characterized the noise performance of ρW and ρF by assuming the parameters to be unbiased. However, CRBBE should be used in situations where estimators may be biased. Please see Appendix A for details of the CRBBE for fat quantification when using correction methods.
Bias in the Estimates of ρW and ρF for Methods with No or Single- Correction
Methods with no or single- correction use a signal model different from that the “true” signal model, and hence in general E(x̂) ≠ x, for these methods. CRB of un biased estimators assume E(x̂) to be equal to x for all parameters. We relax this assumption and compute the bias in the estimates of ρW and ρF The estimates of the parameters ϕW, ϕF, and ψ are assumed to be unbiased and an approximate expression for the bias in is derived below. Accurate theoretical expressions for the bias in the estimates of the nonlinear parameters ϕW, ϕF, and ψ and is beyond the scope of this study, and, as we validate through Monte Carlo simulations, is not necessary. Please see Appendix B for details on bias calculations when using no or single correction methods.
Materials and Methods
Estimation of Fat Fraction and In Vivo
The tradeoff between bias and variance in the estimation of fat fraction was analyzed using three representative sets of values to encompass a wide range of values that may be encountered physiologically.
The first set of values were based on those measured by Schwenzer et al. (38) in 129 subjects where the average , and we assume that of water and fat are equal.
values for water and fat for the second and third cases were measured using the dual- method (21) in two patients with severe steatosis. The second patient also has suspected hepatic iron overload from transfusional hemosiderosis. These in vivo exams were performed with institutional review board approval and informed consent and were acquired in a HIPAA compliant manner. Both the patients were scanned at 1.5 T (Signa HDx TwinSpeed, GE Healthcare, Waukesha, WI) with an eight-channel cardiac coil (GE Healthcare). Imaging parameters for the first patient included: 256 × 160, 35 × 35 cm field-of-view, 10 mm slice, 5° flip angle, ±125 kHz bandwidth, six echoes/repetition time, 13.7 ms repetition time, 1.2 ms first echo and 2.0 ms echo spacing. Imaging parameters for the second patient included: 160 × 128, 34 × 27 cm field-of-view, 8 mm slice, 12° flip angle, ±111 kHz bandwidth, six echoes/repetition time, 13.9 ms repetition time, 0.9 ms first echo, and 1.5 ms echo spacing. Two-dimensional parallel imaging with effective acceleration of 2.5 and 2.1 for the two acquisitions, respectively, was performed with autocalibrating reconstruction for Cartesian sampling (39). Both acquisitions acquired 32 slices within a 21 s breath-hold. Fat fraction and estimates of the two methods were computed in a representative central slice from set of slices, by manually segmenting the liver tissue over the entire slice, while carefully avoiding large vessels, bile ducts and other nonhepatic tissue. The average and standard deviation were computed from the resulting histogram of values measured from the segmented liver tissue. The identical region was used to measure values for the single and dual reconstructions for each patient.
Validation of Theory Using Monte Carlo Simulations
Theoretical expressions for bias and noise performance of fat fraction and the assumptions made in these calculations were validated using Monte Carlo simulations. While performing Monte Carlo validation, all the parameters were estimated independently without any assumptions regarding the bias of ρW, ρF, ϕW, ϕF, , and ψ.
The complex MRI signal data were simulated using Eq. 2 as the true signal for fat fractions range from 0% to 100% fat. The three representative sets of values were used. Water and fat signal magnitudes were chosen such that the value of (ρW + ρF) was always 100, and Gaussian noise with unit standard deviation was added to real and imaginary parts of the complex data, such that the SNR of the total water and fat signal was 100. Using the simulated noisy complex signals, estimates of ρW, ρF, ϕW, ϕF, and ψ were calculated without correction (15). In addition, estimates of ρW, ρF, ϕW, ϕF, and ψ were calculated using single- correction (17,20), and finally estimates of ρW, ρF, ϕW, ϕF, , and ψ were calculated using dual- correction (21). In the Monte Carlo simulations, no field map smoothing (40) was used. Parameter estimation was repeated for 5000 independent Gaussian noise realizations for every fat fraction, and the variance of the fat fraction estimated by the three methods was computed to compare with theoretical predictions derived from CRBBE.
Echo Combination Optimization for Estimation of Fat Fraction
The CRB analysis can be performed to optimize the noise performance at different echo times in the acquisition. As the noise performance depends on fat fraction, it is important to choose a relevant range of fat fractions for this optimization. Previous studies in 110 subjects have demonstrated a range of fat fractions from 0–30% (12). Although fat fractions greater than 30% do occur, as shown by the two extreme examples in this study, they are uncommon. A vast majority of cases that we encountered at our institution have fat fractions below 30% (34). Based on these data, we performed echo time optimization for fat fraction range of 0–30%.
The impact of echo timing on bias and noise performance was computed in the following manner: the minimum NPMη and maximum bias over the 0—30% fat fraction range was determined for a large set of echo combinations (echo time, TEmin = 0–2 π, ΔTE = 0–2π, and step size for both TEmin and ΔTE was 0.03π). From these calculations, echo combinations that maximize noise performance and minimize bias have been selected as the optimal echo combinations.
Results
Figure 1 shows the estimates of fat fraction calculated using the single and dual- methods in the two patients, both with severe steatosis. Figure 2 shows the values in the same patients estimated by the two methods. For the first patient, the hepatic fat fraction (%) estimated by the single and dual- methods were 49.5 ± 4.8 and 46.5 ± 5.8, respectively. For the second patient, the hepatic fat fraction (%) was 35.6 ± 7.3 (single- method) and 32.8 ± 7.2 (dual- method).
Fig. 1.
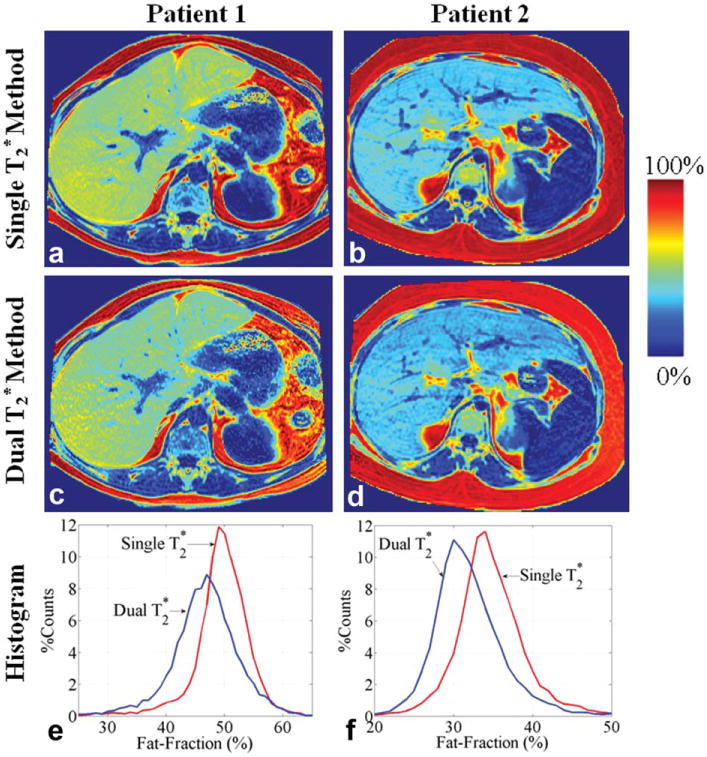
In vivo quantification of fat fraction (%) using the single (a, b) and dual (c, d) correction methods in two patients with severe steatosis. The hepatic fat fractions were manually segmented to avoid large vessels and biliary structures. Histogram plots (bin size = 1%) of the hepatic fat fractions estimated by the two methods are shown in (e) and (f). Data for the second patient were provided by Dr. Shreyas S. Vasana-wala.
Fig. 2.
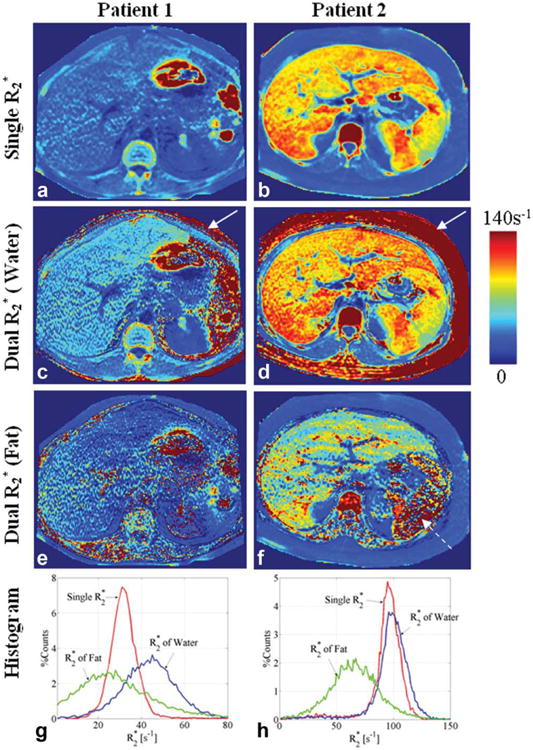
Estimates of in the same patients, shown in Fig. 1, using the single (a, b) and dual (c-f) correction methods. Histogram plots (bin size = 1 s−1) of the estimates by the two methods in the liver, manually segmented avoiding large vessels and biliary structures, are shown in (g, h). The dual method is unstable when one species dominants the voxel as seen by the estimates of the of water in subcutaneous fat (solid arrows) and the of fat estimated in the spleen (dashed arrow). The higher values in the second patient are consistent with known concomitant iron overload in addition to steatosis. Data for the second patient were provided by Dr. Shreyas S. Vasanawala.
The estimated by the single- method in the first patient was 32.3 ± 8.0ms and the corresponding of water and fat estimated by the dual- method were 26.4 ± 25.3 and 62.4 ± 104.4 ms, respectively. The values estimated by the single- method in the second patient were 11.9 ± 15.7ms and the corresponding of water and fat estimated by the dual- method were 12.4 ± 28.2 and 18.9 ± 27.4 ms, respectively. Note that the mean estimates were determined from the mean of the inverse of and not the inverse of the mean of , which will be different in general.
The standard deviations in the estimated values of in these patients using single and dual- correction methods likely reflects a combination of the normal variability of across the liver, variations related to shortening of from external susceptibility, and from noise in the estimated maps. Noise in the estimated maps will depend on the correction method used (single vs. dual), which may explain the increased variability using the dual- correction method. Finally, it should be noted that as the region of interest used to measure the average values is very large, the standard error on these average values is very small.
Based on the work of Schwenzer et al. (38), and measurements in these two patients, we chose values for the three representative scenarios used in subsequent CRBBE calculations as:
Figures 3–5 plot the bias and NPMη for methods with no, single and dual- correction for two representative set of echo times and the three sets of values. Six echoes with typical echo times were used with the first echo time of 1.2 ms and an echo spacing of 1.6 ms and also spacing of 2 ms. The computations were assuming chemical shift and appropriate echo times for generating a phase shift of ∼2π/ 3 and ∼π between the water peak and the main methylene peak of fat at 1.3 ppm. It is important to note that the use of phase shifts (e.g., 2π/3, π, etc.) to describe echo shifts is only valid when the two species each have a single resonance frequency, which is not the case with fat, which has at least six distinct spectral peaks. However, the use of phase shifts to describe echo times is commonly used in the literature and provides a useful intuitive basis to understand the underlying signal behavior.
Fig. 3.
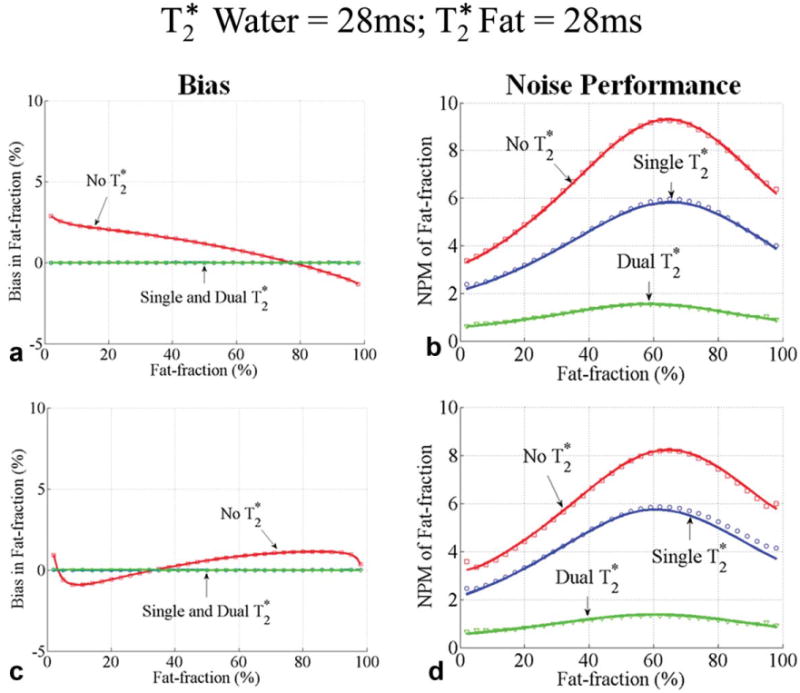
Bias (a, c) and noise performance (b, d) in estimation of fat fraction using six echoes without correction, single and dual correction, when the water and fat signals have the same (28 ms). Two sets of representative echo times were used: a first echo time of 1.2 ms and an echo spacing of 2 ms were used in (a, b) and a first echo time of 1.2 ms and an echo spacing of 1.6 ms were used in (c, d). Close agreement between theoretical calculations (lines) and Monte Carlo simulations (□, ○, and ▽) is seen. The bias is zero for only dual methods because the is the same for water and fat (28 ms). A large decrease in SNR performance occurs due to the additional degrees of freedom for dual correction method.
Fig. 5.
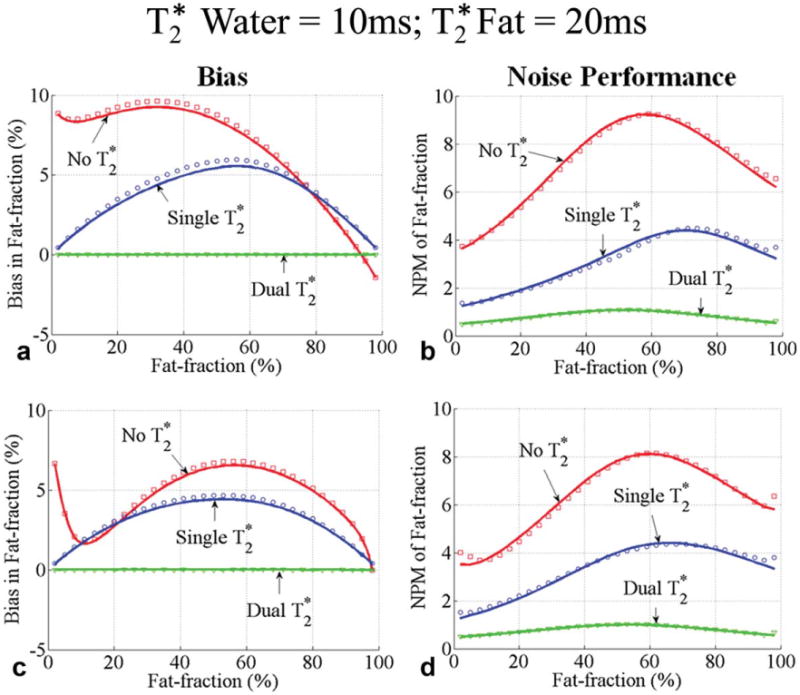
Bias (a, c) and noise performance (b, d) in fat fraction estimation using six echoes without correction, single, and dual correction, when the of water is 10 ms and of fat is 20 ms. Two sets of representative echo times were used: a first echo time of 1.2 ms and an echo spacing of 2 ms were used in (a, b) and a first echo time of 1.2 ms and an echo spacing of 1.6 ms were used in (c, d). Close agreement between theoretical calculations (lines) and Monte Carlo simulations (□, ○ and ▽) is seen. The bias is zero for only dual correction. Note that the bias for methods without from iron overload. A large decrease in SNR performance occurs when adding additional degrees of freedom for single and dual correction methods in an attempt to reduce bias.
Monte Carlo simulations were also performed to validate the theoretical predictions by CRBBE in Figs. 3–5. Excellent agreement between theory and Monte Carlo simulations was observed, demonstrating that assumptions made in the calculation of bias and noise performance with the CRBBE are valid. As expected, bias and noise performance are highly dependent on fat fraction, values, and the choice of echo combinations.
From Figs. 3–5, it can be observed for all the three methods, that the minimum NPMη (maximum variance) occurs at fat fractions close to 0%. Interestingly, when no correction is used, the fat fraction where the minimum and maximum bias occur is highly dependent on the choice of echo combination.
Figures 6–8 show the theoretical minimum NPMη and maximum bias for the three methods at different echo combinations. Computations were performed for fat fractions between 0% and 30% and for the three sets of values. Interestingly, an echo spacing of ∼π/2 provides the best noise performance with single- correction. An echo spacing of ∼2π/3 provides the best noise performance for the methods with no or dual- correction. The echo spacings of ∼π and ∼4π/3 are the next best choices for optimal noise performance for methods without or with dual- correction. All the three methods demonstrate tremendous improvement in noise performance with very short first echo times. Also note the difference between the noise performance at optimal echo combinations and the noise performance at a typical echo combination (shown with *) used in subjects (34).
Fig. 6.
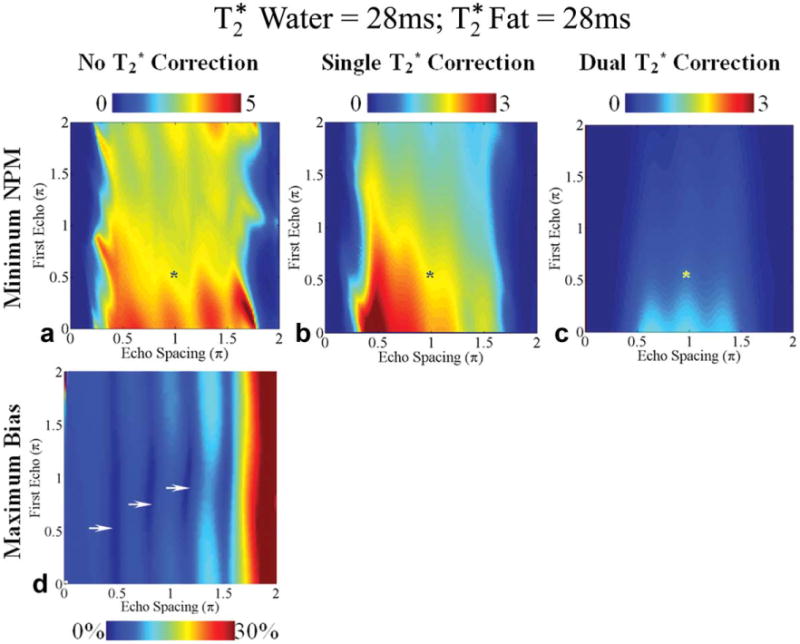
Worst-case noise performance (a-c) and bias (d) in the estimation of fat fraction using six echoes for fat fractions between 0% and 30% for methods without correction (a, d), single correction (b), and dual correction (c) when the water and fat signals have the same (28 ms). First echo time and the echo spacing are represented using the phase difference (multiples of π) between water and the main fat peak at 1.3 ppm. Note that the color bar scales for worst-case NPM for methods with correction range from 0 to 3 and for methods without correction range from 0 to 5. A typical echo combination used in subjects is shown with an asterisk (*). The optimal echo spacing for best noise performance for methods with no or dual correction is ∼2π/3. An echo spacing of ∼π/2 provides the best noise performance for single correction. Single and dual correction methods have no bias in this case because the of water and fat are equal (28 ms). The regions with small worst-case bias for methods without correction are shown by arrows.
Fig. 8.
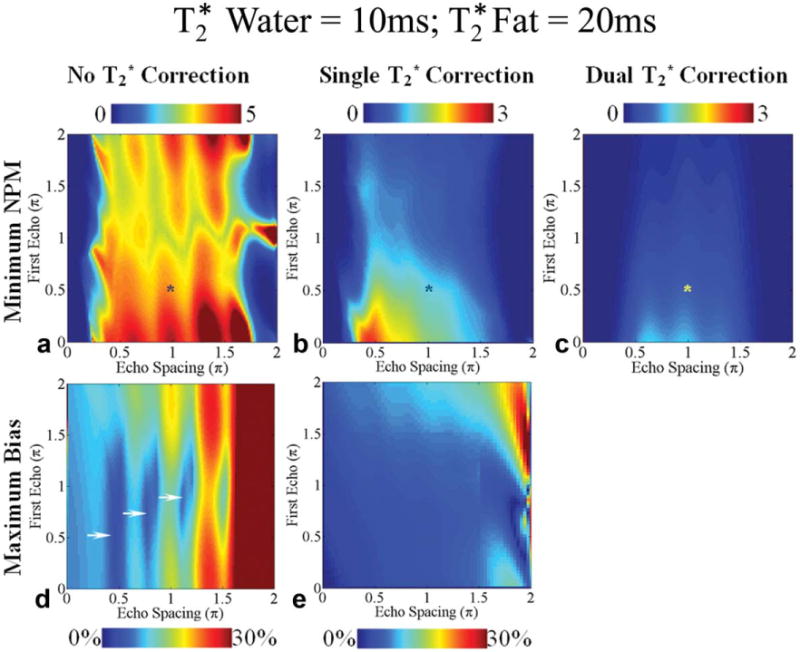
Worst-case noise performance (a-c) and bias (d, e) in the estimation of fat fraction using six echoes for fat fractions between 0% and 30% for methods without correction (a, d), single, (b) and dual correction (c) when of water is 10 ms and of fat is 20 ms. First echo time and the echo spacing are represented using the phase difference (multiples of π) between water and the main fat peak at 1.3 ppm. Note that the color bar scales for worst-case NPM for methods with correction range from 0 to 3 and for methods without correction range from 0 to 5. A typical echo combination used in subjects is shown with an asterisk (*). The optimal echo spacing for best noise performance for methods with no or dual correction is ∼2π/3. An echo spacing of ∼π/2 provides the best noise performance for single correction. Only dual correction methods have no bias in this case. The regions with small worst-case bias for methods without correction are shown by arrows. Among the regions pointed to by the arrows, the region close to the first echo time and echo spacing of ∼π/2 represents the optimum choice of echo times for reducing bias without correction because it has lowest value for maximum bias (<4% error).
The troughs in the two-dimensional plots for maximum bias (Figs. 6–8) identify optimal echo times for reducing bias when no correction is used. Without correction the echo combination with first echo time and echo spacing of (∼π/2, ∼π/2) provides less than 5% worst-case bias. The other optimal choices of first echo time and echo spacing that provide relatively smaller maximum bias (<7.5%) for methods without correction are (∼0.75π, ∼0.80π), (∼ π, ∼0.88π), and (∼0.88π, ∼1.11π). These echo combinations are optimal for reducing bias in the estimates for fat fractions between 0% and 30%. The performance of the three correction methods at the optimal echo combinations is compared for the complete range of fat fractions in Figs. 9 and 10.
Fig. 9.
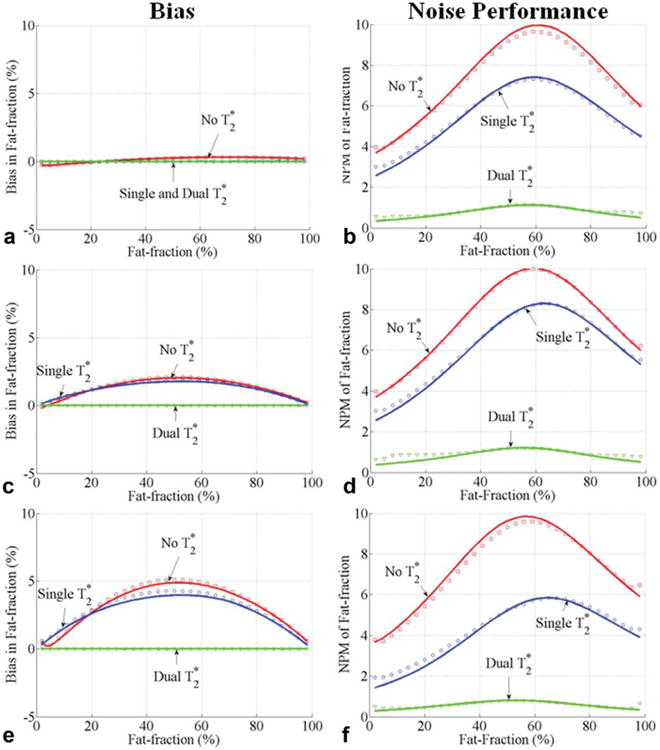
Bias (a, c, e) and noise performance (b, d, f) in estimation of fat fraction with the first echo time and echo spacing of (∼ π/2, ∼ π/2) for 0–100% fat fractions. Results from Figs. 6 to 8 show that these echo combinations have less than 4% worst-case bias for methods without correction for fat fractions between 0% and 30%. A first echo time of 1.2 ms, an echo spacing of 1.1 ms, and six echoes were used. The performance of methods without correction, single, and dual correction for three sets of are shown. The following combinations of values were used: of 28 ms for both water and fat (a, b), of 28 ms for water and 65 ms for fat (c, d), and of 10 ms for water, and 20 ms for fat (e, f). Close agreement between theoretical calculations (lines) and Monte Carlo simulations (□,○ and ▽]) is seen. Interestingly, the bias for methods with single and no correction is approximately the same for this echo combination. In addition, methods without correction have significantly better noise performance. This specific echo combination may provide a combination of low bias and excellent noise performance if no correction is used.
Fig. 10.
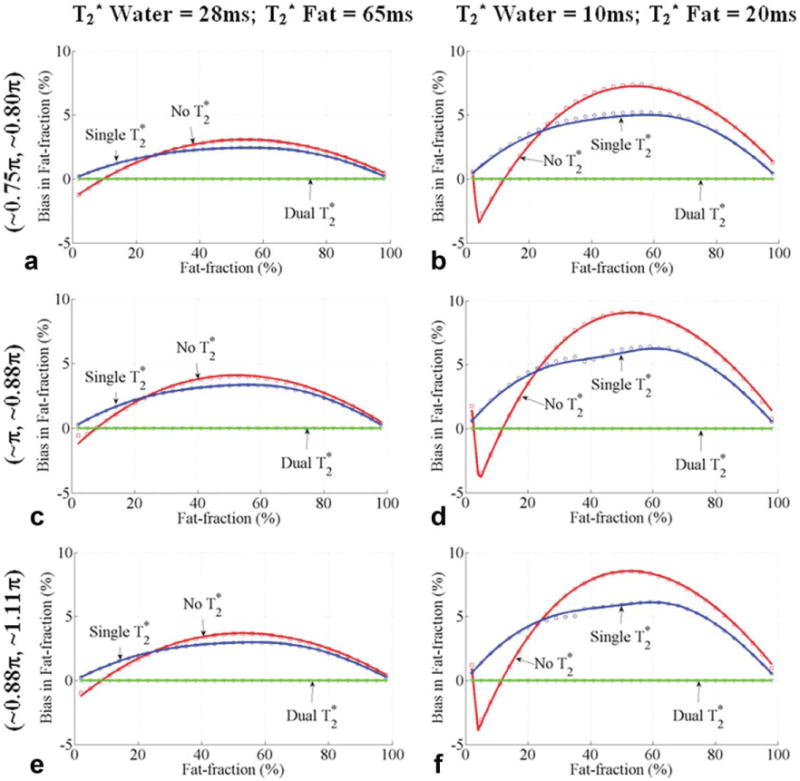
Bias in the estimates of fat fraction with the first echo time and echo spacing of (∼0.75π, ∼0.80π), (∼ π, ∼0.88π), and (∼0.88π, ∼ 1.11 π) for 0–100% fat fractions. Results from Figs. 6 to 8 show that these echo combinations have small worst-case bias without correction for fat fractions between 0% and 30%. These echo combinations use echo spacing longer than π/2. Six echoes were used, as well as three representatives sets of for water and fat: of 28 ms for water and fat (the bias without correction was less than 2% for all the three optimum echo combinations and is not shown); of 28 ms for water and 65 ms for fat (a, c, e); of 10 ms for water and 20 ms for fat (b, d, f). Close agreement between theoretical calculations (lines) and Monte Carlo simulations (□, ○ and ▽) is seen. Note that methods without correction provide less than 5% worst-case bias for fat fractions between 0% and 20% and have smaller bias than methods with single correction for fat fractions between 10% and 20%.
Figure 9 plots the bias and NPMη with the first echo time of 1.2 ms and an echo spacing of 1.1 ms. These echo times were used to generate echo combinations optimal for reducing bias for methods without correction (Figs. 6–8). The three sets of values were used. Results show that when a first echo time and echo spacing of (∼ π/2, ∼ π/2) are used, the estimates of fat fraction without correction are approximately equal to the fat fractions estimated by single- correction. Importantly, methods without correction have less than 5% bias while providing much better noise performance than single and dual- correction methods. Although the echo spacing of ∼π/2 is difficult to achieve for single-shot methods (all echoes in one repetition time), it is possible to achieve this spacing if interleaved echo trains are used.
Figure 10 compares the bias for methods with no, single-, and dual- correction when using the echo combinations with first echo time and echo spacing corresponding to (∼0.75π, ∼0.80π), (∼ π, ∼∼0.88π), and (∼0.88π, ∼1.11π). The worst-case bias in the estimates of fat fraction without correction for these echo combinations is less than 5% for fat fraction between 0% and 20% and less than 7.5% for fat fractions between 0% and 30%. Interestingly, methods without correction have smaller bias in the estimates of fat fraction than the single- correction methods for fat fractions between 10% and 20%.
Discussion
In this study, the tradeoff between bias and variance in the estimation of fat fraction was analyzed for different correction methods, using CRBBE. Theoretical noise performance was compared with Monte Carlo simulations, demonstrating excellent agreement, validating the analytical expressions for CRB of biased estimators. In addition, we formulated NPMη for the fat fraction, rather than that for water or fat signals.
We have developed an efficient framework to analyze and optimize the tradeoffs for bias and noise performance of different correction methods. Calculations were performed using six echoes, three sets of values encountered clinically, and over a relevant range of fat fractions. We found that using the shortest possible first TE lead to large improvements in noise performance. An echo shift of ∼π/2 provides significantly better noise performance for single- correction, particularly when values are short. For methods with no or dual- correction echo shifts of ∼2π/3 provide the best noise performance, although there is a relatively broad range of echo spacings over which noise performance is similar.
In general, adding additional degrees of freedom to provide more accurate estimates of fat fraction through correction leads to reduced bias, but at the cost of worse noise performance. The optimal choice of correction method will depend on the specific clinical scenario. For example, an application that acquires high SNR fat-fraction images or uses extensive signal averaging may be willing to trade SNR performance for improved accuracy through the use of dual- correction. However, for most liver fat quantification applications, the SNR is generally low because rapid breathhold imaging, often with parallel imaging, is used, in combination with low flip angles (to minimize T1-related bias). Therefore, the large SNR penalty that occurs with dual- correction may be outweighed by the reduction in bias. This is particularly true for detection of early steatosis, when concentrations of fat near 5–6% are needed to classify a patient as having abnormal levels of fat (23). For this reason, it is probably most important to have an accurate estimate of fat at low fat fractions. At low fat fractions, the bias from single- correction methods is low and the use of dual- may be more detrimental through large decreases in SNR performance to achieve small improvements in bias.
The bias for single- correction, was generally small, being zero at low (∼0%) and high (∼100%) fat fractions with a maximum bias near 50%. Very interestingly, however, was the observation of “troughs” of very low maximum bias at discrete echo spacings (e.g., 0.5π, 0.88π, ∼1.11π) when no correction was used. When very specific echo combinations were used, the bias without correction was approximately the same as single- correction. Importantly, the noise performance without correction was markedly higher than single- correction. A detailed analytical explanation for this observation is beyond the scope of this manuscript, but warrants further research to understand the basis of this observation.
In past work on the noise analysis of three-point chemical shift-based water–fat separation methods (24,37), it has been shown that a maximum effective NSA of three could be achieved for both water and fat signals, so long as the optimal choice of echo times was used (15,24). This was an intuitive result—this noise performance was equivalent to the same SNR performance by simply averaging the source images together, although without water– fat separation. Unfortunately, this analysis did not include the effects of spectral modeling of fat or the effects of decay. Chebrolu et al. (41) recently demonstrated that inclusion of spectral modeling of fat has minimal impact on the noise performance of water signal but degrades the noise performance of the fat signal estimation. Further, Yu et al. showed that including the effects of also reduces the noise performance in a manner that is dependent on the value itself (17,20). For these reasons, the NPM used in this work may not have the same intuitive maximum achievable value as that for past NSA calculations. One exception is the case with 100% fat and no correction. From Eq. 10, it can be seen that when the sample is 100% fat, the NPM only depends on the noise performance of water, and therefore, the effects of spectral modeling will not impact the NPM. In this situation, the NPM is approximately six (red curves in Figs. 3–5), which is an intuitive result that would be achieved with six well-spaced echoes, where the effects of decay and spectral modeling are absent. Further, for the no correction case and when the fat fraction is approximately 50%, from Eq. 10 it can be seen that NPM ≈ 2NPMρw = 2NPMρf ignoring the covariance term, explaining how NPM values greater than six can occur.
One important limitation of this work is that we analyzed the bias and variance in the estimates of fat fraction, separately. In some scenarios combining bias and variance as a total mean square error might be a better metric for analyzing the performance of an estimation method. However, in clinical practice, estimates of fat fraction are often analyzed by choosing a region of interest in the fat-fraction image. In such cases of clinical practice, when the mean and variance in a region of interest are computed, separating the bias and variance, as done in this study, is more useful.
A second limitation is that three assumptions were made in deriving theoretical expressions for the CRBBE. First, the expectation and variance of fat fraction are derived using the approximate formulae provided by Mood et al. (36). Second, ϕW, ϕF, and ψ were assumed to be accurately estimated without bias by the three correction methods. Third, we used an approximate expression for bias in . The later two assumptions were made to avoid recursive theoretical equations for the bias in the estimates of fat fraction. However, close agreement between Monte Carlo simulations and theoretical noise performance demonstrates that these assumptions were valid for analyzing the estimation of fat fraction over the range of parameters tested.
An additional limitation of this study is that the dual- signal model (Eq. 2) assumes that the of all fat peaks are equal, and that the spectral model of fat is known. The assumptions regarding uniform of the fat peaks is probably reasonable, based on the fact that all protons on a triglyceride molecule experience the same B0 field inhomogeneity and that J-coupling effects are negligible when using low flip angle spoiled gradient echo imaging (32,33). In addition, Hamilton et al. (31) recently characterized the relative frequencies and amplitudes of liver triglycerides in 121 patients with liver disease. In this study, they characterized the triglyceride spectrum and also demonstrated minimal variability of the spectral model of fat between patients (i.e., all subjects had very similar triglyceride spectra). Perhaps most importantly, however, recently reported data in a fat–water–iron phantom demonstrate that dual- correction with spectral modeling of fat accurately models the underlying physics of the water and fat signals from this phantom (21). Further, recently reported data in 55 patients (none of whom had both iron overload and high fat concentration) demonstrate excellent agreement between MRS and MRI with spectral modeling and single- correction, providing indirect evidence that the of all triglyceride peaks are very similar (34). However, it is important to stress that the major purpose of this work was not to investigate the validity of the single and dual- signal models but rather investigate the relative tradeoffs in noise performance between the two signal models.
Finally, the analysis was limited to six echo acquisitions, although analysis of other echo train lengths is warranted. However, additional optimization and validation is beyond the scope of this work.
In conclusion, we have presented a rigorous framework for analyzing the bias and noise performance of fat quantification using complex chemical shift-based water–fat separation methods. As part of this framework, we formulated a NPM for estimation of fat fraction as the parameter of interest and validated the use of CRB for biased estimators to determine the minimum variance of the estimates of fat fraction. Using this framework, we compared three correction methods to examine the tradeoffs among bias, noise performance, and instability of algorithms. We found that for typical acquisition parameters over a wide range of fat fractions, significantly better tradeoff between bias and variance is achieved with the single- correction method. In addition, we demonstrated that at very discrete echo spacings, methods without correction achieve similar bias to that of single- correction methods but with greatly improved noise performance. Future work will use the dual- correction method to measure differences in between water and fat to help determine the role and need for dual- correction for in vivo fat quantification in larger populations. In addition, detailed analysis of the discrete echo spacings that provide small bias with no correction will also be pursued.
Fig. 4.
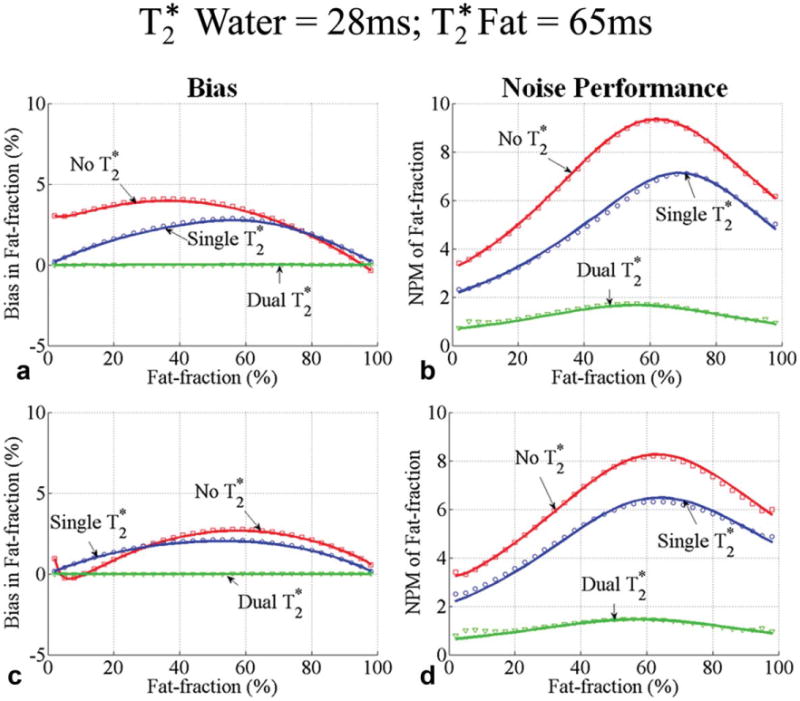
Bias (a, c) and noise performance (b, d) in fat-fraction estimation using six echoes without correction, single, and dual correction, when the of water is 28 ms and of fat is 65 ms. Two sets of representative echo times were used: a first echo time of 1.2 ms and an echo spacing of 2 ms were used in (a, b) and a first echo time of 1.2 ms and an echo spacing of 1.6 ms were used in (c, d). Close agreement between theoretical calculations (lines) and Monte Carlo simulations (□, ○ and ▽) is seen. Also note that the bias for methods without correction depends heavily on the choice of echo timing. The bias is zero only for dual correction. A large decrease in SNR performance occurs when adding additional degrees of freedom for the dual correction method in an attempt to reduce bias.
Fig. 7.
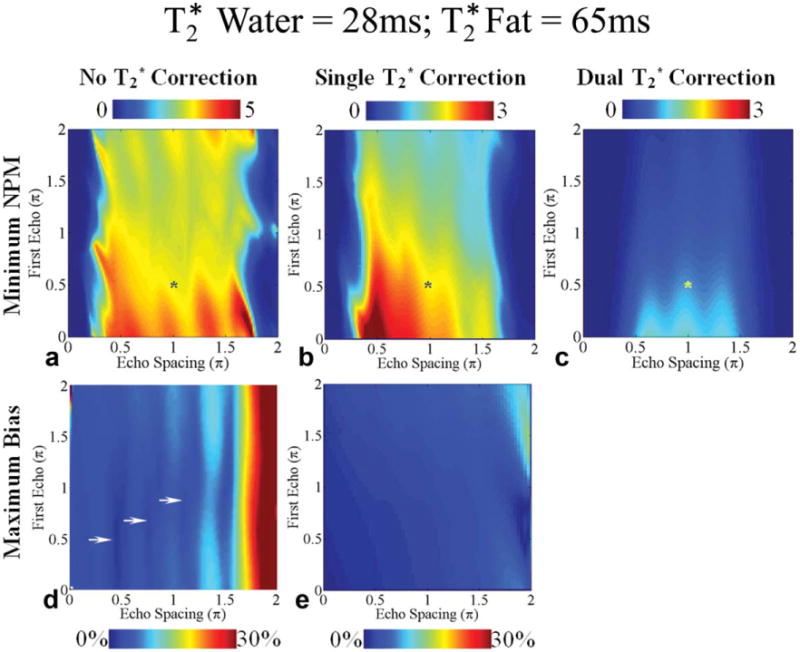
Worst-case noise performance (a-c) and bias (d, e) in the estimation of fat fraction using six echoes for fat fractions between 0% and 30% for methods without correction (a, d), single, (b) and dual correction (c) when of water is 28 ms and of fat is 65 ms. First echo time and the echo spacing are represented using the phase difference (multiples of π) between water and the main fat peak at 1.3 ppm. Note that the color bar scales for worst-case NPM for methods with correction range from 0 to 3 and for methods without correction range from 0 to 5. A typical echo combination used in subjects is shown with an asterisk (*). The optimal echo spacing for best noise performance for methods with no or dual correction is ∼2π/3. An echo spacing of ∼ π/2 provides the best noise performance for single correction. Only dual correction methods have no bias in this case. The regions with small worst-case bias for methods without correction are shown by arrows.
Acknowledgments
The authors wish to thank GE Healthcare for their support.
Grant sponsor: NIH Clinical and Translational Science Award (to University of Wisconsin ICTR); Grant number: 1UL1RR025011; Grant sponsor: NIH; Grant numbers: RC1EB010384, R01 DK083380-01A1, and R01 DK088925-01.
Appendix A
Cramér-Rao Bound Analysis for Biased Estimators
Let x = [ρW ρF ϕW ϕF ψ]T be the vector representation of the parameters to be estimated. If x̂ is the estimate of x, then the bias b in x̂ is E(x̂) − x and the covariance C of x̂ is E{[x̂ − Ex̂][x̂ − E(x̂)]T}. If E(x̂) = x, then the estimator is unbiased. This assumption is appropriate when the signal model used by the estimation method and the truesignal model are the same. In this study, we assume the dual- signal model to be truth. Hence, for dual- correction we perform the CRB analysis of unbiased estimators and the minimum variance on each parameter is given by the diagonal elements of the inverse of the Fisher information matrix F (24,42), whose (k, l)th element is given by the equations:
| [A1] |
| [A2] |
| [A3] |
where σ2 is the variance of the noise in a source image (s(t)). xk and xl are the kth and lth vector elements of x. If the parameter estimation method uses a signal model different than true signal model, then generally E(x̂) ≠ x. In this case, the estimator is biased. The theoretical expressions for the minimum possible variance in the biased estimates of the parameters are computed using CRBBE, i.e.,
| [A4] |
where is the partial derivative of the bias with respect to the parameters (x). To simplify notation below, we define . The theoretical minimum value for the variance in the biased estimates of the parameters is given by the diagonal elements of C, the covariance matrix. The theoretical minimum variance of the parameters estimated by the CRBBE using Eq. 12 becomes equal to the minimum variance estimated by the CRB theory of unbiased estimators, when D is zero, or in other words, when the estimator is unbiased.
Fat fraction is the metric of interest, therefore, c11 , c12 (C), and c22 are the only elements of C (Eq. 14) that need to be derived. The only elements of D that must be computed are the partial derivatives of the bias in ρW and ρF with respect toρW, ρF, ϕW, ϕF, and ψ. All elements of F are required
Appendix B
Bias for Methods with No or Single- Correction
Expressions for the minimum variance in estimates of ρW and ρF depend on their bias. To calculate the partial derivatives in Eq. 14, analytical expressions for the bias in ρW and ρF are required. Let Γ̂n and Γ̂s be the vector representation of the biased estimates of water and fat signal magnitudes by methods without correction and with single- correction, respectively. Then Γ̂n and Γ̂s are given by the equations
| [B1] |
| [B2] |
An is obtained from Ad in Eq. 4 by substituting and with zero. Similarly, As is obtained from Ad by substituting and with . Equations 15 and 16 provide expressions for bias in ρW and ρF. These equations were used for deriving theoretical bounds for the minimum possible variance in the parameter estimates.
Approximate Expression for
An analytical expression for the bias in the estimated by the single- model is needed to calculate the partial derivative on the bias in Eq. 14. The estimated by the single- model will have zero bias at 0 and 100% fat fractions because there is only one component (water or fat). However, bias will be nonzero between these extremes. A linear approximation that satisfies the above condition for the is . A more accurate, nonlinear approximation for can be derived by equating Eqs. 2 and 5, and assuming that ϕW, ϕF, and ψ have already been demodulated, i.e.,
| [B3] |
where for simplicity. If we define ρ̂W,s and ρ̂F,s to be the biased estimates of the water and fat signal magnitudes of the single- correction method, then using ρ̂W,s + ρ̂F,s|Cf| in the denominator would provide a more accurate expression for . Equation 17 provides an approximate analytical expression for the decay term to conduct partial differentiation of the bias, b.
References
- 1.Chitturi S, Abeygunasekera S, Farrell GC, Holmes-Walker J, Hui JM, Fung C, Karim R, Lin R, Samarasinghe D, Liddle C, Weltman M, George J. NASH and insulin resistance: insulin hypersecretion and specific association with the insulin resistance syndrome. Hepatology. 2002;35:373–379. doi: 10.1053/jhep.2002.30692. [DOI] [PubMed] [Google Scholar]
- 2.Harrison SA, Neuschwander-Tetri BA. Nonalcoholic fatty liver disease and nonalcoholic steatohepatitis. Clin Liver Dis. 2004;8:861–879. ix. doi: 10.1016/j.cld.2004.06.008. [DOI] [PubMed] [Google Scholar]
- 3.Papandreou D, Rousso I, Mavromichalis I. Update on non-alcoholic fatty liver disease in children. Clin Nutr. 2007;26:409–415. doi: 10.1016/j.clnu.2007.02.002. [DOI] [PubMed] [Google Scholar]
- 4.Tominaga K, Kurata JH, Chen YK, Fujimoto E, Miyagawa S, Abe I, Kusano Y. Prevalence of fatty liver in Japanese children and relationship to obesity. an epidemiological ultrasonographic survey. Dig Dis Sci. 1995;40:2002–2009. doi: 10.1007/BF02208670. [DOI] [PubMed] [Google Scholar]
- 5.Schwimmer JB, Deutsch R, Kahen T, Lavine JE, Stanley C, Behling C. Prevalence of fatty liver in children and adolescents. Pediatrics. 2006;118:1388–1393. doi: 10.1542/peds.2006-1212. [DOI] [PubMed] [Google Scholar]
- 6.Angulo P, Lindor KD. Non-alcoholic fatty liver disease. J Gastroenterol Hepatol. 2002;17(Suppl):S186–S190. doi: 10.1046/j.1440-1746.17.s1.10.x. [DOI] [PubMed] [Google Scholar]
- 7.Rydell J, Knutsson H, Pettersson J, Johansson A, Farneback G, Dahlqvist O, Lundberg P, Nystrom F, Borga M. Phase sensitive reconstruction for water/fat separation in MR imaging using inverse gradient. Med Image Comput Comput Assist Interv. 2007;10(Pt 1):210–218. doi: 10.1007/978-3-540-75757-3_26. [DOI] [PubMed] [Google Scholar]
- 8.Cowin GJ, Jonsson JR, Bauer JD, Ash S, Ali A, Osland EJ, Purdie DM, Clouston AD, Powell EE, Galloway GJ. Magnetic resonance imaging and spectroscopy for monitoring liver steatosis. J Magn Reson Imaging. 2008;28:937–945. doi: 10.1002/jmri.21542. [DOI] [PubMed] [Google Scholar]
- 9.Bydder M, Yokoo T, Hamilton G, Middleton MS, Chavez AD, Schwimmer JB, Lavine JE, Sirlin CB. Relaxation effects in the quantification of fat using gradient echo imaging. Magn Reson Imaging. 2008;26:347–359. doi: 10.1016/j.mri.2007.08.012. [DOI] [PMC free article] [PubMed] [Google Scholar]
- 10.Hines CD, Yu H, Shimakawa A, McKenzie CA, Brittain JH, Reeder SB. T1 independent, T2* corrected MRI with accurate spectral modeling for quantification of fat: validation in a fat-water-SPIO phantom. J Magn Reson Imaging. 2009;30:1215–1222. doi: 10.1002/jmri.21957. [DOI] [PMC free article] [PubMed] [Google Scholar]
- 11.Guiu B, Petit JM, Loffroy R, Ben Salem D, Aho S, Masson D, Hillon P, Krause D, Cercueil JP. Quantification of liver fat content: comparison of triple-echo chemical shift gradient-echo imaging and in vivo proton MR spectroscopy. Radiology. 2009;250:95–102. doi: 10.1148/radiol.2493080217. [DOI] [PubMed] [Google Scholar]
- 12.Yokoo T, Bydder M, Hamilton G, Middleton MS, Gamst AC, Wolfson T, Hassanein T, Patton HM, Lavine JE, Schwimmer JB, Sirlin CB. Nonalcoholic fatty liver disease: diagnostic and fat-grading accuracy of low-flip-angle multiecho gradient-recalled-echo MR imaging at 1.5 T. Radiology. 2009;251:67–76. doi: 10.1148/radiol.2511080666. [DOI] [PMC free article] [PubMed] [Google Scholar]
- 13.Hu HH, Kim HW, Nayak KS, Goran MI. Comparison of fat–water MRI and single-voxel MRS in the assessment of hepatic and pancreatic fat fractions in humans. Obesity (Silver Spring) 2010;18:841–847. doi: 10.1038/oby.2009.352. [DOI] [PMC free article] [PubMed] [Google Scholar]
- 14.Hines CD, Yu H, Shimakawa A, McKenzie CA, Warner TF, Brittain JH, Reeder SB. Quantification of hepatic steatosis with 3-T MR imaging: validation in ob/ob mice. Radiology. 2010;254:119–128. doi: 10.1148/radiol.09090131. [DOI] [PMC free article] [PubMed] [Google Scholar]
- 15.Reeder SB, Pineda AR, Wen Z, Shimakawa A, Yu H, Brittain JH, Gold GE, Beaulieu CH, Pelc NJ. Iterative decomposition of water and fat with echo asymmetry and least-squares estimation (IDEAL): application with fast spin-echo imaging. Magn Reson Med. 2005;54:636–644. doi: 10.1002/mrm.20624. [DOI] [PubMed] [Google Scholar]
- 16.Hernando D, Haldar JP, Sutton BP, Ma J, Kellman P, Liang ZP. Joint estimation of water/fat images and field inhomogeneity map. Magn Reson Med. 2008;59:571–580. doi: 10.1002/mrm.21522. [DOI] [PMC free article] [PubMed] [Google Scholar]
- 17.Yu H, Shimakawa A, McKenzie CA, Brodsky E, Brittain JH, Reeder SB. Multiecho water–fat separation and simultaneous R2* estimation with multifrequency fat spectrum modeling. Magn Reson Med. 2008;60:1122–1134. doi: 10.1002/mrm.21737. [DOI] [PMC free article] [PubMed] [Google Scholar]
- 18.Liu CY, McKenzie CA, Yu H, Brittain JH, Reeder SB. Fat quantification with IDEAL gradient echo imaging: correction of bias from T(1) and noise. Magn Reson Med. 2007;58:354–364. doi: 10.1002/mrm.21301. [DOI] [PubMed] [Google Scholar]
- 19.Yu H, Shimakawa A, Reeder S, McKenzie C, Brittain J. Magnitude fitting following phase sensitive water–fat separation to remove effects of phase errors; Proceedings of the 17th Scientific Meeting of ISMRM; Honolulu, HI. 2009; p. 461. [Google Scholar]
- 20.Yu H, McKenzie CA, Shimakawa A, Vu AT, Brau AC, Beatty PJ, Pineda AR, Brittain JH, Reeder SB. Multiecho reconstruction for simultaneous water–fat decomposition and T2* estimation. J Magn Reson Imaging. 2007;26:1153–1161. doi: 10.1002/jmri.21090. [DOI] [PubMed] [Google Scholar]
- 21.Chebrolu VV, Hines CD, Yu H, Pineda AR, Shimakawa A, McKenzie CA, Samsonov A, Brittain JH, Reeder SB. Independent estimation of T*2 for water and fat for improved accuracy of fat quantification. Magn Reson Med. 2010;63:849–857. doi: 10.1002/mrm.22300. [DOI] [PMC free article] [PubMed] [Google Scholar]
- 22.O'Regan DP, Callaghan MF, Wylezinska-Arridge M, Fitzpatrick J, Naoumova RP, Hajnal JV, Schmitz SA. Liver fat content and T2*: simultaneous measurement by using breath-hold multiecho MR imaging at 3.0 T—feasibility. Radiology. 2008;247:550–557. doi: 10.1148/radiol.2472070880. [DOI] [PubMed] [Google Scholar]
- 23.Szczepaniak LS, Nurenberg P, Leonard D, Browning JD, Reingold JS, Grundy S, Hobbs HH, Dobbins RL. Magnetic resonance spectroscopy to measure hepatic triglyceride content: prevalence of hepatic steatosis in the general population. Am J Physiol Endocrinol Metab. 2005;288:E462–E468. doi: 10.1152/ajpendo.00064.2004. [DOI] [PubMed] [Google Scholar]
- 24.Pineda AR, Reeder SB, Wen Z, Pelc NJ. Cramer-Rao bounds for three-point decomposition of water and fat. Magn Reson Med. 2005;54:625–635. doi: 10.1002/mrm.20623. [DOI] [PubMed] [Google Scholar]
- 25.Hernando D, Liang ZP, Kellman P. Comparison of magnitude and complex data fitting for quantitative water/fat imaging; Proceedings 18th Scientific Meeting, International Society for Magnetic Resonance in Medicine; Stockholm, Sweden. 2010; p. 5098. [Google Scholar]
- 26.Hernando D, Liang ZP, Kellman P. Modeling of T2* decay in water/ fat imaging: comparison of one-decay and two-decay models; Proceedings 18th Scientific Meeting, International Society for Magnetic Resonance in Medicine; Stockholm, Sweden. 2010; p. 5095. [Google Scholar]
- 27.Hernando D, Liang ZP, Kellman P. Chemical shift–based water/fat separation: a comparison of signal models. Magn Reson Med. 2010;64:811–822. doi: 10.1002/mrm.22455. [DOI] [PMC free article] [PubMed] [Google Scholar]
- 28.Eldar YC. Minimum variance in biased estimation: bounds and asymptotically optimal estimators. IEEE Trans Signal Processing. 2004;52:1915–1930. [Google Scholar]
- 29.Hussain HK, Chenevert TL, Londy FJ, Gulani V, Swanson SD, McKenna BJ, Appelman HD, Adusumilli S, Greenson JK, Conjeevaram HS. Hepatic fat fraction: MR imaging for quantitative measurement and display—early experience. Radiology. 2005;237:1048–1055. doi: 10.1148/radiol.2373041639. [DOI] [PubMed] [Google Scholar]
- 30.Reeder S, Hines C, Yu H, McKenzie C, Brittain J. On The definition of fat-fraction for in vivo fat quantification with magnetic resonance imaging; Proceedings of the 17th Scientific Meeting, International Society for Magnetic Resonance in Medicine; Honolulu, Hawaii. April 2009; p. 211. [Google Scholar]
- 31.Hamilton G, Yokoo T, Bydder M, Cruite I, Schroeder ME, Sirlin CB, Middleton MS. In vivo characterization of the liver fat (1)H MR spectrum. NMR Biomed. 2010 doi: 10.1002/nbm.1622. Epub ahead of print. [DOI] [PMC free article] [PubMed] [Google Scholar]
- 32.de Graaf R, Rothman D. In vivo detection and quantification of scalar coupled (1)H NMR resonances. Concepts Magn Reson. 2001;13:32–76. [Google Scholar]
- 33.Hamilton G, Middleton MS, Bydder M, Yokoo T, Schwimmer JB, Kono Y, Patton HM, Lavine JE, Sirlin CB. Effect of PRESS and STEAM sequences on magnetic resonance spectroscopic liver fat quantification. J Magn Reson Imaging. 2009;30:145–152. doi: 10.1002/jmri.21809. [DOI] [PMC free article] [PubMed] [Google Scholar]
- 34.Meisamy S, Hines CD, Hamilton G, Sirlin CB, McKenzie CA, Yu H, Brittain JH, Reeder SB. Quantification of hepatic steatosis with T1-independent, T2*-corrected MR imaging with spectral modeling of fat: blinded comparison with MR spectroscopy. Radiology. 2011;258:767–775. doi: 10.1148/radiol.10100708. [DOI] [PMC free article] [PubMed] [Google Scholar]
- 35.McVeigh ER, Henkelman RM, Bronskill MJ. Noise and filtration in magnetic resonance imaging. Med Phys. 1985;12:586–591. doi: 10.1118/1.595679. [DOI] [PMC free article] [PubMed] [Google Scholar]
- 36.Mood AM, Graybill FA, Boes DC. Introduction to the theory of statistics. NY: McGraw-Hill; 1974. [Google Scholar]
- 37.Glover GH. Multipoint Dixon technique for water and fat proton and susceptibility imaging. J Magn Reson Imaging. 1991;1:521–530. doi: 10.1002/jmri.1880010504. [DOI] [PubMed] [Google Scholar]
- 38.Schwenzer NF, Machann J, Haap MM, Martirosian P, Schraml C, Lie-big G, Stefan N, Haring HU, Claussen CD, Fritsche A, Schick F. T2* relaxometry in liver, pancreas, and spleen in a healthy cohort of one hundred twenty-nine subjects-correlation with age, gender, and serum ferritin. Invest Radiol. 2008;43:854–860. doi: 10.1097/RLI.0b013e3181862413. [DOI] [PubMed] [Google Scholar]
- 39.Brau AC, Beatty PJ, Skare S, Bammer R. Comparison of reconstruction accuracy and efficiency among autocalibrating data-driven parallel imaging methods. Magn Reson Med. 2008;59:382–395. doi: 10.1002/mrm.21481. [DOI] [PMC free article] [PubMed] [Google Scholar]
- 40.Yu H, Reeder SB, Shimakawa A, Brittain JH, Pelc NJ. Field map estimation with a region growing scheme for iterative 3-point water-fat decomposition. Magn Reson Med. 2005;54:1032–1039. doi: 10.1002/mrm.20654. [DOI] [PubMed] [Google Scholar]
- 41.Chebrolu VV, Yu H, Pineda AR, McKenzie CA, Brittain JH, Reeder SB. Noise analysis for 3-point chemical shift-based water-fat separation with spectral modeling of fat. J Magn Reson Imaging. 2010;32:493–500. doi: 10.1002/jmri.22220. [DOI] [PMC free article] [PubMed] [Google Scholar]
- 42.Van Trees HL. Detection, estimation, and modulation theory. New York: Wiley; 1968. [Google Scholar]


