Short abstract
Bileaflet mechanical heart valves (BMHVs) are among the most popular prostheses to replace defective native valves. However, complex flow phenomena caused by the prosthesis are thought to induce serious thromboembolic complications. This study aims at employing a novel multiscale numerical method that models realistic sized suspended platelets for assessing blood damage potential in flow through BMHVs. A previously validated lattice-Boltzmann method (LBM) is used to simulate pulsatile flow through a 23 mm St. Jude Medical (SJM) Regent™ valve in the aortic position at very high spatiotemporal resolution with the presence of thousands of suspended platelets. Platelet damage is modeled for both the systolic and diastolic phases of the cardiac cycle. No platelets exceed activation thresholds for any of the simulations. Platelet damage is determined to be particularly high for suspended elements trapped in recirculation zones, which suggests a shift of focus in blood damage studies away from instantaneous flow fields and toward high flow mixing regions. In the diastolic phase, leakage flow through the b-datum gap is shown to cause highest damage to platelets. This multiscale numerical method may be used as a generic solver for evaluating blood damage in other cardiovascular flows and devices.
Introduction
Native heart valves may become defective due to congenital birth defects or valvular disease, and prosthetic valves have been used for over 50 years to replace defective native valves. Tissue valves are popular as a prosthetic valve design, but have known durability issues and are prone to calcification and structural damage [1]. Mechanical valves are an alternate, but also widely implanted prosthetic valve design with advantages of durability lasting up to the lifetime of the recipient while retaining good function and bulk flow hemodynamics [2]. The BMHV design accounts for the majority [3] of implanted mechanical heart valves.
The SJM Regent™ valve is a popular BMHV design, and is made of a durable pyrolitic carbon material (Fig. 1(a)). The circular wall of the valve is referred to as the valve housing, which is surrounded by a sewing cuff. The two leaflets of the valve are hinged to the valve housing and open and close due to pressure differences on either side of the valve. During forward flow, most of the blood flows through three orifices formed by the open leaflets (Fig. 1(b)). The three flow jets during forward flow are through the two lateral orifices, and the central orifice. In the reverse flow phase (Fig. 1(c)), there is leakage flow through the hinges, the gap between the closed leaflets and valve housing (referred to as the valve housing gap), and through the central b-datum plane.
Fig. 1.

(a) SJM 23 mm Regent valve, (b) diagram of BMHV in forward flow phase with three orifices, and (c) BMHV in reverse flow phase and domain split into (1) ventricular chamber, (2) ventricular side within valve, (3) aortic side within valve, and (4) aortic sinus expansion
Despite long-term improvements in design, BMHVs still cause serious complications such as platelet activation and thromboembolism [4,5]. These complications are thought to be due to nonphysiologic shear stress levels imposed on blood elements by complex flows through BMHVs [6–8]. Thrombus formation in the valves may lead to dislodged emboli that can cause stroke and death [9–11]. Various experimental studies have been performed on flow through prosthetic heart valves to study the complex flow dynamics [12–16], though experimental studies are often limited to lower spatiotemporal resolution and obstructed viewpoints. Blood damage experiments are also possible, in which human blood can be run through valves and assays are performed to assess blood damage potential [17–19], but only give bulk blood damage results.
Computational fluid dynamics (CFD) simulations provide a tool to model three-dimensional BMHV flows with high resolution. Pulsatile BMHV flows have been explored in computational studies to attempt to connect the complex flow with potential for blood damage [20–22], and have included modeling two-way fluid–solid interaction (FSI) of leaflet motion [23] and more realistic anatomic geometries [24,25]. As blood damage is of interest in BMHV flows, computational studies have also employed Lagrangian particle tracking to assess damage potential. These efforts have mostly been limited to point particle tracking [26–29]. These previous studies of BMHV flow were performed with spatial resolution that cannot resolve the smallest scales of flow, and do not realistically model suspended blood elements.
The objective of this study is to model blood damage in pulsatile BMHV flows with a multiscale numerical method that can resolve the smallest flow scales and realistically model suspended blood elements. The numerical method is previously validated for quantifying platelet damage [30], and the use of realistic platelet modeling was shown to differ in blood damage assessment from point particle methods [31]. This numerical method has also been shown to resolve the smallest scales of BMHV fluid motion [32,33]. Thus, this study aims to model blood damage in BMHV flows with the highest spatiotemporal accuracy to date. Thousands of suspended platelets are released in pulsatile BMHV flow, and platelets are tracked with full temporal history of position, and instantaneous and accumulated damage. Damage is analyzed by bulk distribution, fine-scaled Eulerian regions, and Lagrangian particle tracking. This will allow for increased understanding of how platelet damage occurs in BMHV flows to help in the ultimate reduction of serious thromboembolic complications.
Methods
Numerical Solver.
The LBM for fluid flow modeling [34–38] is employed in this study. FSI for the solid domain is based on the standard bounce-back (SBB) method [36], whereas FSI with suspended platelets is based on the external boundary force (EBF) method [39]. These methods have been validated for accurate modeling of bulk BMHV pulsatile flows [32] and for modeling suspended platelets to quantify damage in BMHV hinge and hingelike flows [30,31].
The LBM has roots in kinetic theory and has been shown rigorously to converge to the solution of the Navier–Stokes equations for fluid flow [35,40,41]. Briefly, the fluid flow field is computed on a fixed Eulerian regular “lattice” with fluid particle distributions on each lattice node. These distribution values can reconstruct the entire 3D fluid flow field for density, velocity, and pressure. The LBM uses calculations localized in space and is optimal for high performance parallel computing, which makes the method appealing for high spatial resolution studies of BMHV flows. The interaction between the fluid and the solid surfaces of the flow domain is computed using the SBB method, which has been well validated as a FSI method in combination with LBM and is mass conservative. Detailed descriptions of the LBM and SBB methods and extensive validations have been previously presented by the authors [30,34–36].
FSI is modeled for suspended particles with the EBF method. In the EBF method, solid particles in the suspension use Lagrangian reference frames that move continuously through the fixed Eulerian fluid domain. The solid particle surface is mapped on the Lagrangian frame by boundary nodes, creating a mesh of surface elements. This Lagrangian frame for the solid is then mapped onto the 3D fluid domain. The two frames of reference used in the EBF method allow for a smoother and more accurate interpolation of the FSI boundary. A Dirac delta function, first described in the work by Peskin [42] for the Immersed Boundary method, is used in the EBF method to interpolate the location of the solid boundary nodes. The EBF method works by computing the force from the fluid to each solid boundary node that is necessary to enforce the no-slip boundary condition. This computed force is then applied back to the fluid, thus completing FSI. The EBF methodology has been well validated as a FSI solver [39,43].
Forces and torques are computed along the entire meshed surface of the suspended particle and accumulated at each numerical timestep. Shear stresses at the particle surface are computed from EBF FSI forces that enforce no-slip conditions at the boundary, and not simply from the homogeneous fluid stress field. As platelets are essentially rigid, they are modeled in this study as rigid ellipsoids, and simple 3D Newtonian dynamics are solved using accumulated forces and torques to determine particle motion and orientation through time. The EBF method also allows for subgrid particle modeling [43] and has been employed in a previous study of multiscale subgrid modeling of blood damage in BMHV hinges [30]. FSI with solid surfaces of the flow domain is enforced with the SBB method due to its computational efficiency and high parallel scalability. For smaller suspended particles, the EBF method must be employed as it allows for subgrid particle modeling that is required of this study. Details of the EBF method are given in the methodology papers [39,43], and the capability of the EBF method to capture rigid body dynamics for subgrid particles is also given in the Appendix.
The LBM is a direct numerical simulation method for solving fluid flow and thus no special turbulence modeling is required. However, the LBM does encounter numerical instabilities at higher Reynolds number flow modeling in the form of negative fluid particle distribution values. In order to eliminate these instabilities, a special entropic lattice-Boltzmann (ELB) method has been proposed for modeling high Reynolds number flows [35,44]. These methods lead to stable explicit algorithms even at very low viscosities, allowing for the modeling of high Reynolds numbers with good accuracy. The use of ELB has also been well validated [32] with very good quantitative and qualitative matching with experimental data at various flow regimes for pulsatile, high Reynolds number BMHV flows.
Numerical Setup and Boundary Conditions.
In vitro particle image velocimetry (PIV) experiments were previously performed of pulsatile flow through a 23 mm SJM valve (Fig. 1(a)) in the aortic position using a blood analog fluid [20]. The exact in vitro experimental setup is recreated computationally using microcomputed tomography (microCT) for use in these simulations (Fig. 2). Physiologic adult conditions are used, with a cardiac cycle with period 860 ms, corresponding to 70 beats/min. The mean flow rate is 4.5 l/min with a peak flow rate of 25.0 l/min and forward systolic flow duration of 340 ms. Kinematic viscosity is matched to whole human blood (3.5 cSt). Figure 3 shows prescribed flow rate and leaflet angle as they vary throughout the cardiac cycle, which is taken from experimental PIV data. Translational motion of the leaflets is restricted, and only rotational motion about the hinge axis is prescribed in this one-way FSI for the leaflets.
Fig. 2.
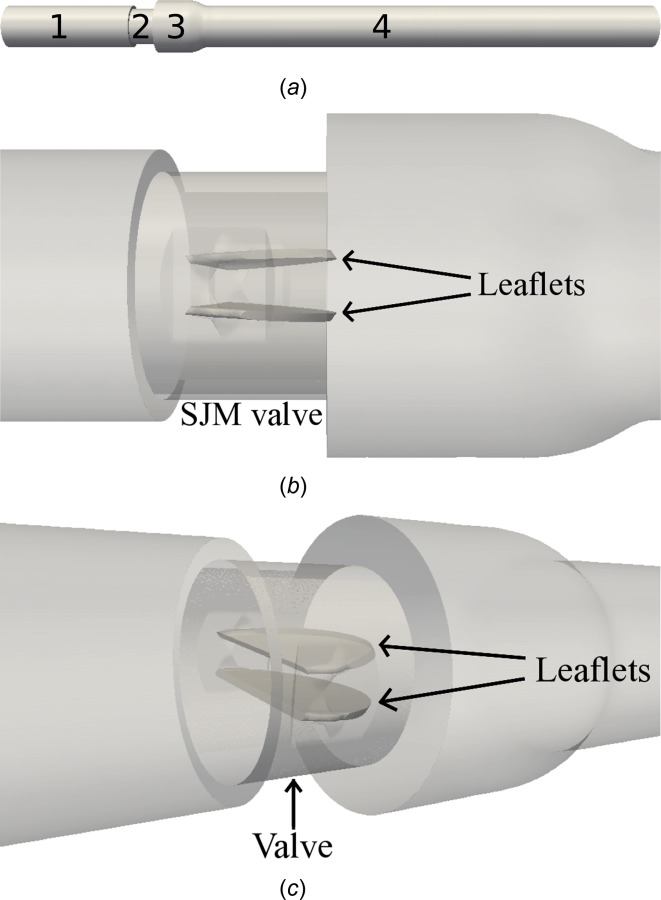
Computational setup of SJM valve in aortic position, (a) domain split into regions: (1) ventricular side chamber, (2) valve, (3) sinus expansion, and (4) aortic side chamber, (b) zoomed view showing fully open leaflets in valve region, and (c) angled view
Fig. 3.

(a) Prescribed flowrate and (b) leaflet motion throughout one cardiac cycle of 860 ms from experimental data
The domain consists of a ventricular side chamber, valve region, sinus expansion, and an aortic side chamber (Fig. 2(a)). The ventricular and aortic chambers are rigid straight tubes with a diameter of D = 25.4 mm. The total domain length is approximately 16 diameters long, with a ventricular inlet chamber length of 4 diameters. The valve itself is a 23 mm SJM valve with an inner diameter of 21.4 mm. Downstream of the valve on the aortic side is a sudden axisymmetric expansion to a diameter of 31.75 mm representing the aortic sinus root immediately downstream of the aortic valve. This is an idealized modeling of the sinus root, as the expansion to the aortic sinus is more gradual in nature. More descriptions of the setup can be found in the literature [20].
The fluid domain employs uniform 3D grid spacing with a spatial resolution of 80 μm as well as a temporal resolution of 2.4 μs per numerical timestep. The hinge regions cannot be resolved at this spatial resolution. However, this high resolution is adequate to resolve the smallest Kolmogorov scales of turbulent fluid motion for this BMHV flow [32,33]. Although the hinge gap regions are important in completely studying BMHV flows, this was not the focus of this particular study. The very high temporal resolution also resolves the Kolmogorov time scales.
The solid domain was created using Gambit© software, where the internal surface of the flow loop and the leaflet surfaces are discretized using an unstructured triangular mesh. This mesh is immersed into the 3D fluid domain and employs variable spatial resolution meshing. The ventricular inlet and aortic outlet chamber lengths employ 320 μm length grid spacing. In the valve region, the valve housing and leaflets use grid spacing variable from 20 to 40 μm.
At the inlet of the domain (ventricular side), a plug flow profile is prescribed based on the time-varying flowrate curve data from the experimental study (Fig. 3). Plug flow is chosen due to the high Womersely number of this flow (Wn = 18). The maximum Reynolds number of the cardiac cycle based on the inlet diameter is Re = 5780. These simulations also include leakage reverse flow during the diastolic phase. At the outlet of the domain (aortic side), a stress-free boundary condition is applied. In order to reduce its effects on the fluid flow field in the region of interest, the aortic chamber outlet of the domain is extended in length. These exact conditions were used in experimental validation with good matching against PIV data [32].
Due to the parallel computing capabilities of LBM, 2592 processor cores are used in parallel for all simulations. The run time for one cardiac cycle is approximately 20 h. Only one cardiac cycle is modeled for the simulations in one-pass blood damage quantification. Although cycle-to-cycle variations exist for aortic valve flows, the modeling of averaged experimental pulsatile flow conditions as employed in this study has shown to result in very similar flows across separate cardiac cycles in a previous study [32], thus showing the periodicity of the flow field solution.
Visualization of Flow Fields.
The pulsatile flow fields in the simulations are visualized in 2D using out-of-plane vorticity magnitude and viscous shear stress fields. For flow field visualization, grayscale contour plots of out-of-plane vorticity magnitude are shown at longitudinal cutplanes perpendicular to the open leaflets. All perpendicular cutplanes are taken at the center slice of the domain and all contour plots use the same vorticity magnitude grayscale contour scaling for comparison.
As shear stress on suspended blood elements is of interest, instantaneous plots of viscous fluid shear stress magnitude are displayed throughout the cardiac cycle. The viscous fluid stress tensor is defined as
| (1) |
For a plane defined by the unit normal vector , the magnitude of shear stress projected on the plane is defined as
| (2) |
where is a unit vector tangential to the plane. In this work, shear stresses are projected onto planes perpendicular to the leaflets and are quantified in units of dynes/cm2. Due to the very high temporal resolution of the simulations, there is no noise found in instantaneous shear stress values from numerical timestep to timestep.
Platelet Modeling and Damage Quantification.
Blood is modeled computationally as an incompressible Newtonian fluid, with the same physical properties as blood. Although real blood is non-Newtonian, the kinematic viscosity of blood approaches an asymptotic value of 3.5 cSt at high shear rates, such as those found in aortic valve flows. This computational matching of blood kinematic viscosity was also deemed suitable when validating against experimental blood damage studies [30]. Suspended platelets are modeled as neutrally buoyant, rigid particles and are released throughout the simulation. Platelets are modeled with the same shape (3D oblate spheroid, “flat discoid”) and size (3 μm major axis diameter, 1.3 μm minor axis diameter) and with the same surface mesh (292 triangular elements). A sample platelet with meshed surface is visualized in Fig. 4. The EBF method allows for the modeling of suspended particles with subgrid resolution, which is required in this study for modeling suspended platelets. The subgrid resolution capabilities of EBF have been validated in a previous study [43], and are also discussed in the Appendix.
Fig. 4.

Modeled platelet (3D ellipsoid—oblate spheroid) with surface mesh of 292 triangular elements, 3 μm major axis diameter, 1.3 μm minor axis diameter
Platelet damage is quantified as accumulated damage throughout the simulation. Based on previous analyses with this numerical method [30], it is found that a linear shear stress-exposure time model with no threshold level is the best indicator of platelet damage. This linear damage accumulation model is similar to those proposed in other platelet activation studies [28,45]. The blood damage index (BDI) for this study is defined for each platelet as
| (3) |
where τ max is the maximum instantaneous surface shear stress experienced by the platelet, and Δt is the numerical timestep. Platelet damage is accumulated upon platelet release until the simulation end. Using the curvature of the particle surface from the Lagrangian surface grid, the normal and tangential vectors along the surface are readily available in local co-ordinates. The stress from the fluid is projected on the surface of the particles in the normal and tangential directions. This gives normal and shear stress values across the platelet surface. The maximum shear stress value across the entire platelet surface is then determined at each numerical timestep. Damage values are then accumulated for each platelet, and BDI can be averaged across platelets. The averaging of BDI across platelets was used as a BDI in validation against experimental bulk blood damage results [30]. The methodology of this study, which uses the same linear damage accumulation model, allows for tracking of individual platelet damage with full temporal history of platelet position, orientation, and damage.
The Nomenclature of BDI has previously been used for hemolysis models. In this study, BDI refers to shear stress accumulation on platelets, not red blood cells, which ultimately leads to platelet activation. However, for consistency with previous studies using this numerical method [30,31], the generic Nomenclature of “BDI” is used.
As the modeled platelets are small, subgrid particles, performing two-way FSI for the platelets results in minor influence on the BMHV flow field and one-way FSI is sufficient. Thus, one-way FSI is performed for modeling platelets to save computational costs. A test of modeling one-way FSI versus two-way FSI for platelets in the BMHV flow is performed and presented in the Appendix.
Point particle methods in previous blood damage studies may obtain different platelet shear stress magnitudes, and also cannot account for shear stress variation with angular orientation. This was previously demonstrated with an example of an isolated ellipsoid in simple shear flow [31]. For the simulations of this study, suspended platelets that are smaller than the fluid grid are modeled. To demonstrate the subgrid accuracy of the EBF method for calculating surface shear stresses, another example of an isolated ellipsoid in simple shear flow (Jeffery's orbit [46]) is shown in Fig. 5, with a progressively shrinking particle size. This is performed with two-way FSI. The smallest particle size represents the subgrid size of the platelets used in the BMHV blood damage simulations.
Fig. 5.
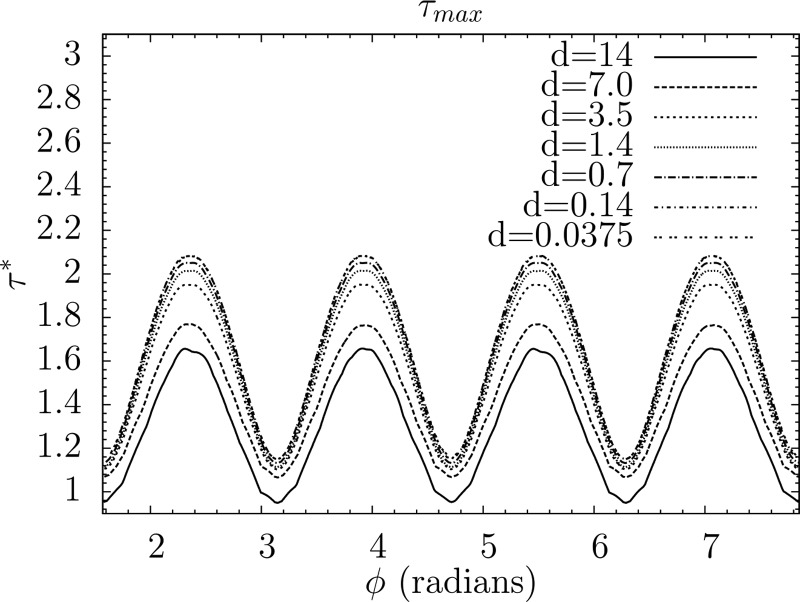
Maximum instantaneous particle shear stress (normalized by ambient fluid shear stress) variation with respect to angular orientation for an isolated platelet-shape ellipsoid in simple shear flow (Jeffery's orbit), with decreasing particle diameter d from supergrid to subgrid resolution. Smallest diameter represents size of subgrid platelets in BMHV blood damage simulations.
For shear stress calculation (Fig. 5), it is demonstrated that the smallest subgrid particle overestimates the calculated shear stress of a well-resolved particle by 20–26%. A test with one-way FSI at the smallest particle size shows nearly identical shear stress values as with two-way FSI. Thus, subgrid particles using one-way FSI have reasonable accuracy for computing platelet shear stresses (within 26% accuracy). It is important to note that this accuracy for subgrid one-way FSI particles is applicable for low particle Reynolds number flows only. As the particle Reynolds number for platelets in BMHV flow is very low Rep = O(10−5), this reasonable level of accuracy applies to the simulations of this study.
The subgrid particles account for variation of shear stress based on angular orientation of the platelet, while point particle methods cannot. In addition, the suspended platelet shear stresses differ in magnitude from the homogeneous fluid stress value as predicted by some point particle methods. Thus, it is shown that subgrid platelets of this study can capture surface shear stresses with reasonable accuracy. These subgrid platelets can account for variation of shear stress with angular orientation, which ultimately improves upon previous point particle methods of quantifying blood damage.
Although red blood cells (RBCs) are not included in these simulations, the effect of RBC presence on platelet shear stress calculation was previously demonstrated for LBM [47]. It was shown that RBC presence increased platelet shear stresses due to particle–particle interaction, but could be represented by a scale factor of ∼1.7. This study also demonstrated the variation of computed platelet shear stress with angular orientation, again showing the importance of suspended particle modeling for blood damage simulations.
Platelet Release.
To obtain realistic volume fraction of platelets, billions of platelets must be simulated [48]. This type of computational resource is not available, and thus, a representative sample is instead used in the simulations. For the forward systolic flow simulations, 300 platelets are released every 20 ms during the systolic phase with an initial seed of 300 platelets at the start of systole. This totals 5400 released platelets in the blood damage simulation, which is much less than the physiological number of platelets that flow through the valve. However, this release methodology does sample platelets that flow through the valve at 18 different time points of the systolic flow phase.
Platelets are released one diameter upstream of the valve as the damage that occurs in flows through BMHVs is of interest for this study. The cardiac cycle flow modeling is first performed without the presence of platelets through the end of diastole. Platelets are released at the start of systole when the leaflets open, and damage is tracked throughout the simulation. The simulations tracking platelet damage cover 460 ms of the 860 ms cardiac cycle, representing all of systole, leaflet closing, and early diastole.
Each platelet is released from the same axial position upstream of the valve, but with randomized cross-sectional position and randomized angular orientation for every seed. Cross-sectional position is chosen using a disk-seeding algorithm [49] and random number generation (Fig. 6). As the platelet suspension is very dilute in the simulations, no contact modeling between platelets is required.
Fig. 6.

300 platelets seeded randomly upstream of BMHV. (a) Side view showing platelets with same initial axial position, and (b) cross-sectional view showing platelets with randomized cross-sectional position
Results
5400 platelets are released in the domain, which are several orders of magnitude less than the realistic number of platelets (1010 ∼ 1011 platelets) that would exist for in vivo conditions [48]. The platelets are randomly seeded at a cross section upstream of the valve and released at 18 time points throughout the systolic flow phase. To test if the random seeding distribution influences blood damage results, two different random seeding methods are tested and their BDI distributions are compared. One seeding method uses randomized positions and angles for each of the 18 seed times, and the secondary method uses the same positions and angles for every seed. The test simulation using the secondary seeding method is only performed up to 260 ms of systole, at which point 4200 platelets have been released in each simulation. As the secondary test simulation is only performed up to 260 ms of systole, the BDI comparison is made at this intermediate timepoint.
The two seeding methods are compared by a histogram (Fig. 7) of BDI. With interval spacing of 0.05 dynes·s/cm2, the BDI distributions using the two seeding methods compare very well. For this comparison point, the average BDI is 0.12 dynes·s/cm2 with a standard deviation of 0.10 dynes·s/cm2 for both platelet release methods. Although 5400 platelets is several orders of magnitude lower than the realistic number of platelets in this domain, the results showing very similar BDI distribution demonstrate that the random seeding of platelet position and angular orientation can be representative of platelets at a cross section upstream of the valve. This is performed with just 300 platelets for every seed at the cross section.
Fig. 7.
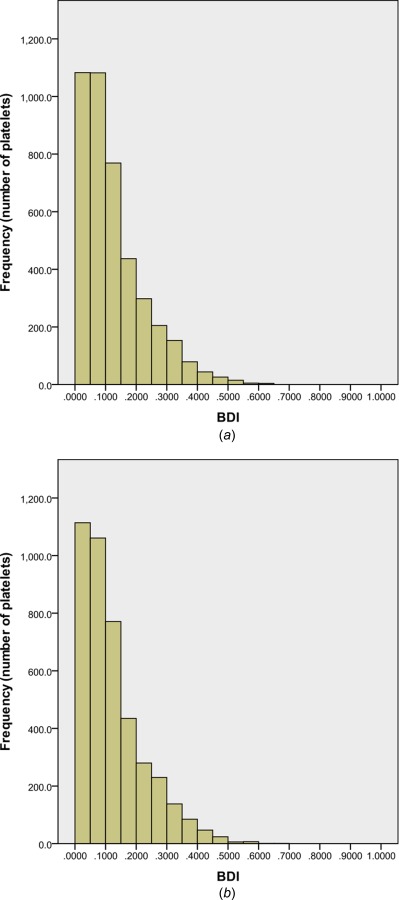
BDI histogram for 4200 platelets after simulation of 260 ms of systolic flow: (a) positions and angles randomized for every seed of 300 platelets and (b) same positions and angles for every seed of 300 platelets. Interval: 0.05 dynes·s/cm2, damage beyond 1.0 dynes·s/cm2 not shown
Systolic Flow—Bulk Blood Damage.
Figure 8 shows the initial seed of 300 platelets at the onset of systole and the final distribution of 5400 platelets after the leaflets have closed in diastole after 460 ms of simulation. A histogram of BDI for all 5400 platelets after 460 ms of simulation is plotted (Fig. 9), representing all of systolic flow and early diastole with an interval spacing of 0.05 dynes·s/cm2. The average BDI for all 5400 platelets is 0.224 dynes·s/cm2 with a standard deviation of 0.154 dynes·s/cm2. It should be noted that platelets are no longer released as the leaflets begin closing. However, an additional of 80 ms is simulated after full leaflet closure, allowing for more damage accumulation during the early diastole phase.
Fig. 8.
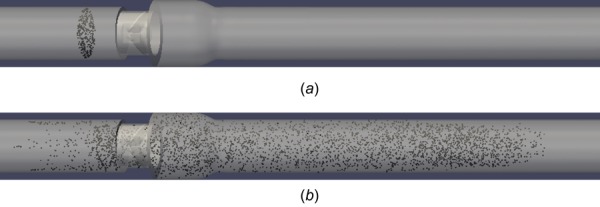
(a) 300 platelets initially seeded upstream of valve and (b) 5400 platelets distributed throughout domain at end of simulation
Fig. 9.
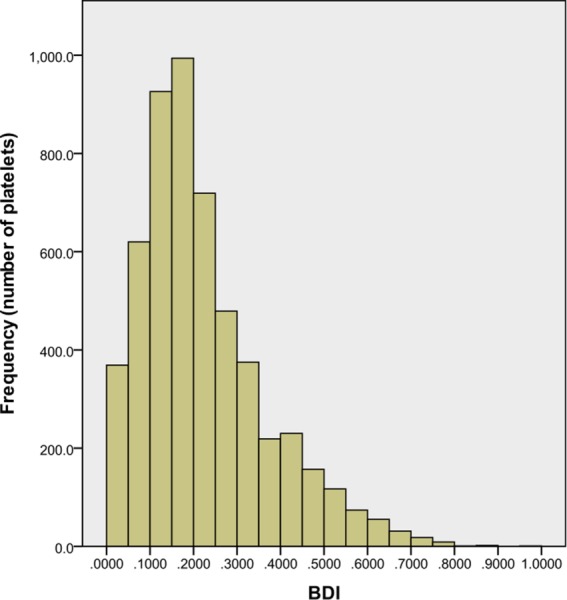
BDI histogram for 5400 platelets after simulation of 460 ms of damage accumulation representing full systole and early diastole. Interval: 0.05 dynes·s/cm2, damage beyond 1.0 dynes·s/cm2 not shown.
The histogram demonstrates that the majority of platelets experience low levels of accumulated damage as they pass through the BMHV. This skewing toward lower damage is expected as some platelet waves are released later in the simulation and have less exposure time. However, the repeated seeding of platelets is important to capture continuous systolic forward flow through the BMHV. Only the final wave of 300 platelets does not pass through the valve in the simulation. However, these platelets approach the valve closely enough to experience the leaflet closing wakes, and thus, their inclusion is deemed important. The wave of 300 platelets released 154 ms into systole (and 55 ms before peak flow) experiences the highest average damage of 0.303 dynes·s/cm2. The last wave released 15 ms before leaflet closing experiences the lowest average damage of 0.046 dynes·s/cm2.
Only four platelets out of 5400 (0.07%) have damage accumulation larger than 1.0 dynes·s/cm2, with a maximum platelet damage value of 3.6 dynes·s/cm2. Additionally, 5084 of 5400 platelets (94.1%) have damage accumulation less than 0.5 dynes·s/cm2. Damage accumulation thresholds for platelet activation have been given as 35.0 dynes·s/cm2 by Hellums [50] and even higher for in vitro platelet activation studies [51,52]. This demonstrates that for one pass through a BMHV, platelets are not in danger of becoming activated. A similar computational study by Xenos et al., using a point particle methodology, showed higher accumulated platelet damage values but also found that platelets do not reach the activation threshold [53].
The platelet damage by region of the domain is given in Table 1 representing BDI values after 460 ms of simulation. The domain is split into four regions (Fig. 2(a)) for analysis: the ventricular side chamber, the valve, the sinus expansion, and the aortic side chamber.
Table 1.
Platelet and BDI distribution by region for systolic flow simulation
| Average damage | ||
|---|---|---|
| Region | # of platelets | (dynes·s/cm2) |
| Overall | 5400 | 0.2248 |
| Ventricular chamber | 732 | 0.0739 |
| Valve | 302 | 0.1988 |
| Sinus expansion | 951 | 0.3227 |
| Aortic chamber | 3415 | 0.2322 |
Although flow recirculation regions are known to exist, 63% of platelets advect downstream of the sinus expansion into the aortic chamber. 17.6% of platelets remain in the sinus expansion region immediately downstream of the valve. The sinus region includes platelets that are caught in recirculation in the sinus expansion, and platelets that have not advected beyond the sinus region before the end of the simulation. 5.6% of platelets are in the valve itself, and 13.6% of platelets remain in the ventricular chamber of the valve. These platelets are released but also have not advected downstream quickly enough before the onset of diastole. It is noted that the simulation ends at early diastole, before mid-diastolic leakage jets are formed at the valve. Platelets near the valve in mid-diastolic flows are covered in a separate simulation.
Although only 17.6% of platelets remain in the sinus expansion, the average damage accumulation in this region is highest. This average damage value is 44% higher than the total average, 40% higher than platelets located in the aortic chamber, and 62% higher damage than platelets within the valve. The ventricular chamber has the lowest average BDI of all four regions.
Table 2 shows the top 10% and 1% of damaged platelets. For the top 10%, though platelets in the valve and ventricular chamber have elevated damage, these regions account for only 37 platelets out of 540. The sinus region has the second highest damage level in addition to 39.6% of these top 10% highly damaged platelets.
Table 2.
Top 10% and 1% of damaged platelets, by region, for systolic flow simulation
| Top 10% | Average damage | Top 1% | Average damage | |
|---|---|---|---|---|
| Region | # of platelets | (dynes·s/cm2) | # of platelets | (dynes·s/cm2) |
| Overall | 540 | 0.5509 | 54 | 0.8355 |
| Ventricular chamber | 10 | 0.5421 | 2 | 0.7325 |
| Valve | 27 | 0.7173 | 5 | 1.586 |
| Sinus expansion | 214 | 0.5633 | 29 | 0.7891 |
| Aortic chamber | 289 | 0.5265 | 18 | 0.7131 |
Examining the top 1% of damaged platelets, the valve region shows the highest average damage values. This highlights potential damage from leaflet closing wakes, although these account for only 9.3% of the top 1% damaged platelets. The sinus expansion, however, has the second highest average damage and account for 53.7% of these highly damaged platelets. This highlights the sinus expansion as a danger region for platelet damage.
Eulerian Viewpoint.
Blood damage in prosthetic valve flows is often visualized in two manners: bulk damage distribution or Lagrangian particle tracking. These viewpoints are important for understanding blood damage, but miss the potential of a fine level Eulerian tracking of blood damage. The flow domain is discretized into cubic regions of size 2.5 mm × 2.5 mm × 2.5 mm. The number of platelets residing in each cubic region is determined, as well as the average accumulated damage across these platelets. The average damage by cubic region is plotted in 3D contours throughout the domain. This is an Eulerian representation of average platelet damage by small regions. For improved visualization, cubic regions with no platelets are blanked from the 3D contour plot. The plots of average BDI values by region are displayed with a maximum contour of 0.5 dynes·s/cm2.
After 460 ms of modeling, the platelet damage distribution throughout the domain in the Eulerian viewpoint demonstrates higher damage regions throughout the sinus expansion and downstream aortic chamber (Fig. 10(a)). A blanking procedure is performed for this end timepoint of the simulation (Fig. 10(b)), demonstrating high damage regions. Although high damage regions exist in the sinus expansion and aortic downstream chamber, there is a larger clustering of high damage regions in the sinus expansion at the end timepoint. This larger number of high damage regions, in addition to the fact that the sinus expansion volume is smaller than the aortic chamber, again highlights platelet damage dangers of the sinus expansion as a whole.
Fig. 10.
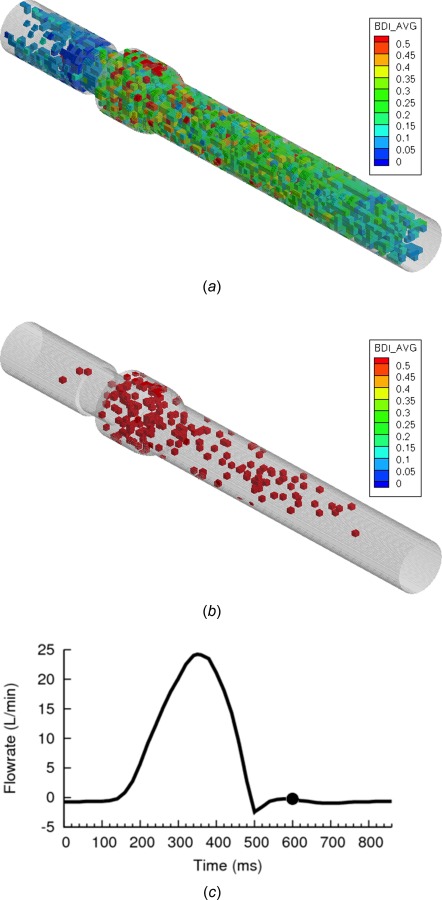
(a) BDI contour plot for small cubic regions of domain—Eulerian view, (b) contours blanked if damage in region is less than 0.5 dynes·s/cm2 (c) flowrate curve at end of simulation at early-to-mid diastolic flow (Re = 75 in reverse flow)
Finally, it is noted that very few high damage regions exist within the valve itself. This could be due to the fact that very few platelets (302 platelets, 5.6%) reside in the valve region at this time. From the analysis of top damaged platelets, the valve is known to contain some highly damaged individual platelets. Cluster regions of highly damaged platelets may not be observed due to a low number of total platelets in the valve.
The aortic chamber contains platelets that have a longer exposure time, which may explain the high damage. However, these regions are also widely scattered throughout a large volume. Platelets in these regions are also at low risk of being caught in diastolic leakage jet flows, as they are far downstream of the valve and simply recirculate during diastole. At the onset of the next systolic phase, these platelets would simply advect through the aorta. Thus, although platelets in the aortic chamber have high accumulated damage, they may not be of serious concern in these BMHV flows.
Lagrangian Tracking.
Platelet damage data are processed to determine which platelet pathlines incur the highest levels of damage. Although platelets are modeled with rigid 3D ellipsoidal shape, for visualization purposes, platelets are displayed in the figures as spheres multiplied in size and uniformly colored by maximum instantaneous surface shear stress. These platelets are visualized within the large domain as spheres of diameter 320 μm, as they would not be visible if represented by their actual size (3 μm). A platelet trail is created to better visualize the pathlines of platelets, with each trail particle spaced apart by 2.5 ms. All viscous shear stress plots for the flow are given with a scaling in units of dynes/cm2.
It is determined that the platelets with the ten highest accumulated damage values all reside within the valve or sinus expansion. These platelets are divided into three categories: platelets traversing very close to the leaflet surface, platelets caught in sinus expansion recirculation, and platelets caught in the sudden leaflet closing wake.
A platelet that is close to the leaflet surface is highlighted as it incurs high levels of damage (Fig. 11). The clustering of the particle trail during this time period (Fig. 11(a)) shows the relatively low velocity of the platelet near the leaflet surface, despite the flow being near peak flow (Re = 5000). The zoomed viewpoint (Fig. 11(c)) focusing on the platelet shows the realistic 3D ellipsoidal shape is apparent with shear stress distribution across the surface. While the platelet is close to the leaflet surface, it experiences continuously high shear stress levels (10–25 dynes/cm2 maximum shear stress), which corresponds to higher accumulation of damage over time. The perpendicular viewpoints (Fig. 12) show the slow motion of the platelet near the leaflet surface with corresponding vorticity and shear stress fields. It is shown that there is no flow separation along the leaflet surface (Fig. 12(b)), which causes the slow velocity of the platelet. Fluid shear stresses near the leaflet are very high (Fig. 12(c)) due to a thin shear layer, explaining the high levels of damage incurred by the platelet traveling near the leaflet surface. The plot of damage accumulation over time demonstrates the steady high accumulation of damage as the platelet travels near the leaflet (Fig. 12(d)).
Fig. 11.
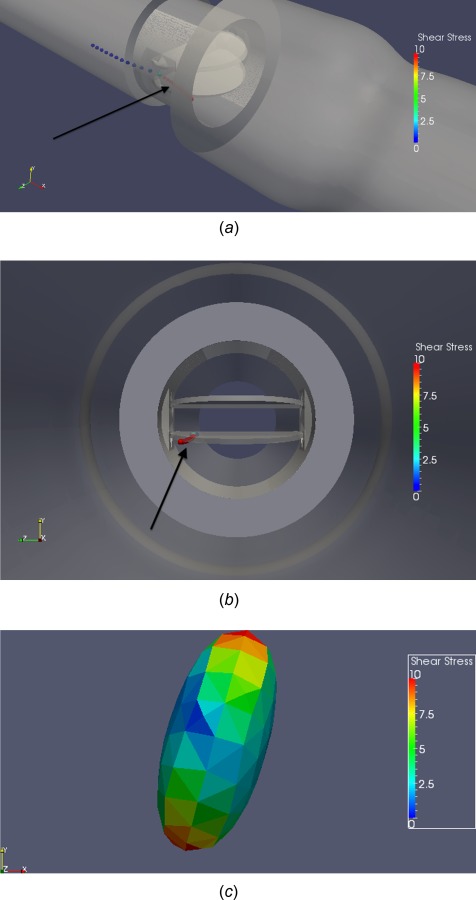
(a) Angled view, (b) cross-sectional view, (c) zoomed view of platelet, demonstrating high damage values of a platelet traversing near the bottom leaflet surface
Fig. 12.

Perpendicular viewpoints of platelet pathline demonstrating high damage values while (a) traversing near leaflet surface, (b) corresponding vorticity field, (c) viscous shear stress field (units in dynes/cm2), and (d) damage accumulation over time
The most common high damage path is in the sinus expansion, where platelets accumulate damage over an extended period of time due to recirculation. These platelets do not experience very high instantaneous levels of shear stress, but moderate levels (15–30 dynes/cm2 maximum shear stress) over a long time, leading to high accumulated damage. One example is given of a platelet caught near the sinus expansion walls. The platelet is shown to experience moderate levels of instantaneous shear stress while caught in this region (Fig. 13). The platelet pathline shows how the platelet incurs low levels of damage until it reaches the sinus expansion, where it then experiences moderate levels of instantaneous shear stress damage.
Fig. 13.
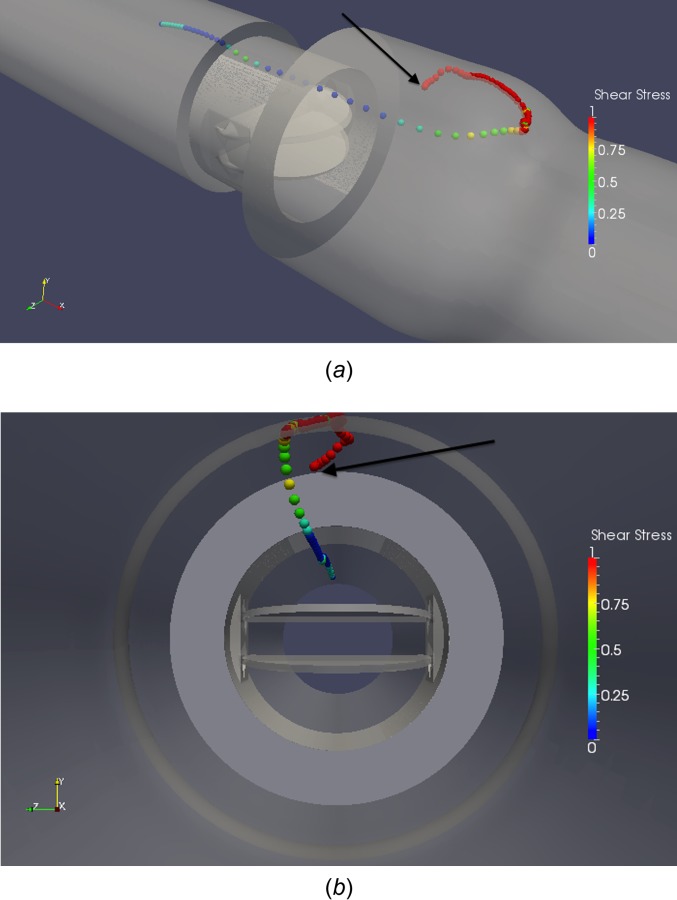
Platelet caught in recirculation near sinus expansion wall (a) 3D angled view, (b) cross-sectional view
This near wall pathline is demonstrated in perpendicular viewpoints (Fig. 14), where the corresponding vorticity field (Fig. 14(b)) shows the wide sinus expansion recirculation zone that the platelet is trapped within. The shear stress field (Fig. 14(c)) shows moderate levels of fluid shear stresses in this recirculation region, but the continuous recirculation leads to high damage accumulation (Fig. 14(d))
Fig. 14.
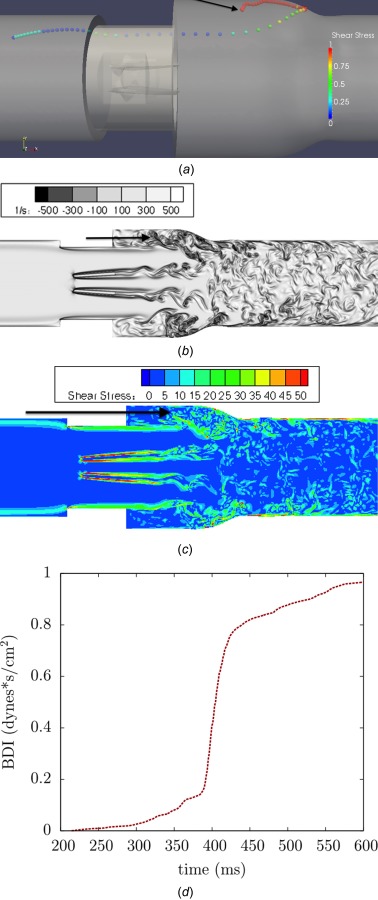
Perpendicular viewpoints of platelet pathline demonstrating (a) platelet caught in recirculation near sinus expansion wall, (b) corresponding vorticity field, (c) viscous shear stress field (units in dynes/cm2), and (d) damage accumulation over time
Although platelets caught in leaflet closing wakes experience high damage, this is a rare occurrence (2 out of 5400 platelets total) and is unavoidable due to the nature of sudden leaflet closing. Thus, as these platelet trails are not of high clinical interest, they are not discussed.
Diastolic Flow.
A separate simulation on the effects of diastolic leakage flow on platelet damage is also performed. During mid-diastole, most flow throughout the domain shows low vorticity and slow recirculation [33]. Of interest is flow near the valve, where leakage flow past the closed leaflets in the valve may cause high platelet damage. Although this study does not include hinge gap leakage, the effects of diastolic leakage flow through the b-datum line and valve housing gaps can be explored.
To determine platelet damage in diastolic leakage flow, 2000 platelets are randomly seeded in the BMHV at the start of mid-diastole. These platelets are seeded at the edge of the valve on the aortic side to capture platelets that are more likely to leak through the valve. This simulation is performed for a pulsatile flow cardiac cycle during mid-diastole, at a timepoint almost 150 ms after leaflet closure. Mid-diastolic flow at this point has a quasi-steady reverse flowrate and most of the flow structures from systole and leaflet closing have dissipated.
2000 platelets for the diastolic flow simulation are technically less than the 5400 total platelets simulated for systolic forward flow. However, the 300 platelets per seed for the systolic flow simulation represent a cross-sectional seed density of 1 platelet per 1.7 mm2. For diastolic flow, the 2000 released platelets represent a much higher seed density of 1 platelet per 0.18 mm2. In addition, the systolic phase includes forward flow rates up to 25 l/min, which is much higher than reverse flow rates of mid-diastole (<1 l/min). Finally, the continuous seeding of platelets is necessary for systole as there is a coherent forward flow through the valve during this phase. For diastole, the flow field is more recirculating in nature and there is no coherent reverse flow, thus eliminating the need for continuous seeding of platelets.
At the start of the diastole simulation, the leaflets are closed and leakage jets exist in b-datum and valve housing gaps. The b-datum gap width is approximately 0.76 mm, and the valve housing gap width is approximately 0.336 mm. The diastolic flow time period that is simulated is 320 ms, representing all of mid-diastolic quasi-steady flow up to end diastole right before the leaflets re-open. Platelet damage is quantified and damage values are determined in four primary regions (Fig. 1(c)): (1) ventricular chamber section, (2) ventricular side within the valve, (3) aortic side within the valve, and (4) aortic sinus expansion.
The initial seed of 2000 platelets is randomly distributed at the aortic edge of the BMHV (Fig. 15(a)) with the same disk point method as the systolic flow simulations. Platelets are seeded very close to the closed leaflets to model platelets “in danger” of leaking through the valve in mid-diastole. After simulation of the mid-diastolic phase (320 ms), platelets are distributed on either side of the valve and are shown in Fig. 15(b). Platelets that have leaked to the ventricular side have mostly traversed to the ventricular chamber and do not remain in the valve. This is due to the strong b-datum jet forcing leaked platelets centrally towards the ventricular chamber. Alternatively, some platelets leak through small valve housing gaps. On the aortic side, platelets are well distributed both within the valve and in the aortic sinus.
Fig. 15.
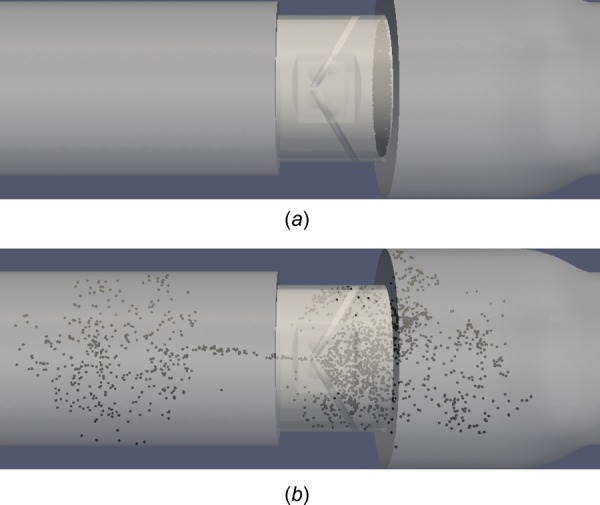
2000 platelets at (a) beginning of simulation and (b) end diastole after 320 ms of mid-diastole simulation
Damage in leaked platelets is compared to damage in platelets that remain on the aortic side (Table 3). The majority of platelets (68.9%) remain on the aortic side of the leaflets after 320 ms of simulation. Platelets that leak through the leaflets (31.1% of total platelets) are mostly advected to the ventricular chamber (23.1% of total platelets) with a small number within the valve (8% of total platelets) on the ventricular side.
Table 3.
Platelet and BDI distribution for diastole simulation
| Average damage | |||
|---|---|---|---|
| Region | # of platelets | % of total platelets | (dynes·s/cm2) |
| Overall | 2000 | 100 | 0.0646 |
| Ventricular side | 623 | 31.1 | 0.1137 |
| Aortic side | 1377 | 68.9 | 0.0425 |
Although most platelets do not leak through the closed leaflets, the platelets that do experience 2.68 times more damage than those that remain on the aortic side. The average damage for platelets on the ventricular side is still low, at 0.1137 dynes·s/cm2, but only represent 320 ms of exposure time. In addition to incurring higher levels of damage, platelets on the ventricular side will likely flow through the valve again at the systolic phase of the next cardiac cycle.
This underlines potential dangers of sinus expansion recirculation, as platelets caught in these regions can potentially incur high levels of damage during systole, additional damage during diastolic leakage, and more damage during the next systolic flow phase. Although a small percentage of platelets would be caught in this recirculation scenario, this still highlights the general danger of recirculation in BMHVs.
Although the spatial resolution of the simulations is not high enough to resolve hinge gap flows, two primary leakage jets can be resolved: b-datum central jet leakage and valve housing leakage. The difference in damage levels for platelets caught in these leakage jets is compared. It is found that all platelets caught in the b-datum leakage jet are advected into the ventricular chamber and do not reside within the valve. All platelets that leak through the valve housing gaps, however, remain within the valve upon traversing to the ventricular side. Figure 16 demonstrates a small cluster of platelets approaching the b-datum gap. Only 2 ms later, this cluster of platelets leaks through the b-datum gap to the ventricular side.
Fig. 16.
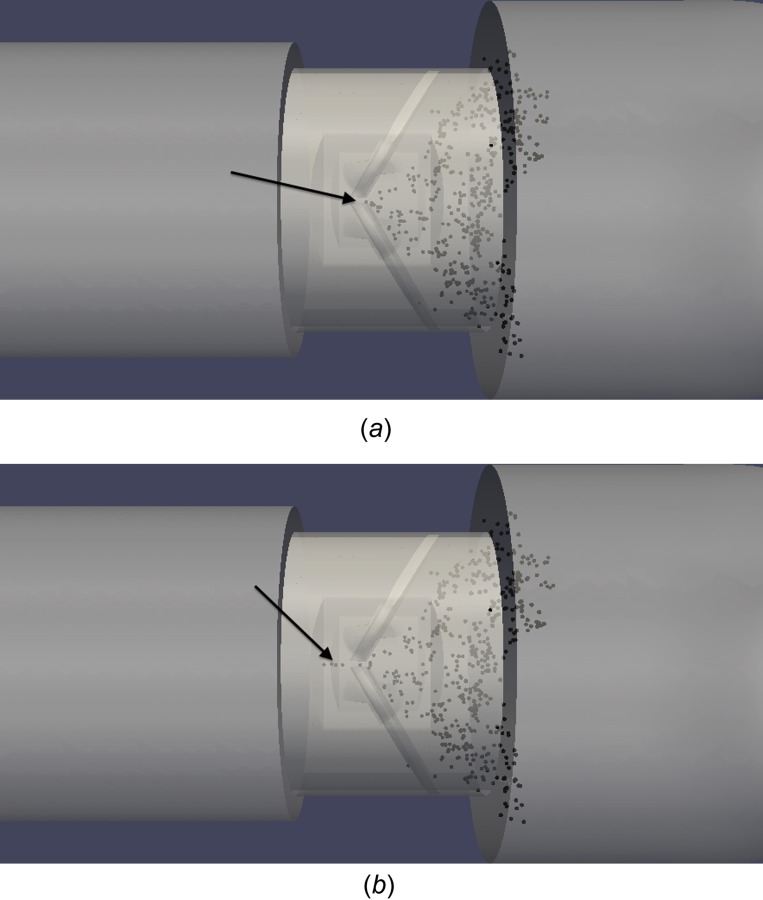
Cluster of platelets leaking through b-datum gap (a) approaching b-datum line, (b) flowing through gap 2 ms later
At a time point 25 ms later (Fig. 17), this cluster of platelets has advected well into the ventricular chamber due to the strength of the b-datum leakage jet. The vorticity and shear stress fields are also shown in this figure, demonstrating the strong b-datum jet that causes the platelets to quickly traverse into the ventricular chamber, and the high shear stresses associated with this leakage jet. The shear stress field shows low values throughout the domain with the exception of the b-datum jet.
Fig. 17.
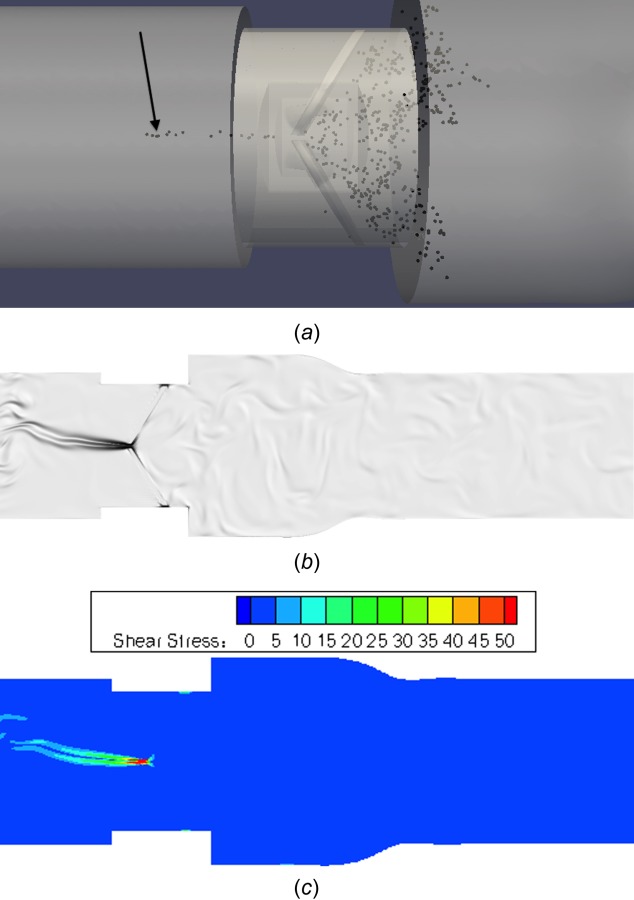
(a) Cluster of platelets leaking through b-datum gap, (b) corresponding vorticity flow field, and (c) viscous shear stress field (units in dynes/cm2)
Platelets that leak through valve housing gaps traverse quickly through the gap but reside within the valve afterwards. Figure 18 shows an example of a platelet approaching the valve housing gap. After 2 ms, the platelet is in the valve housing leakage gap. The platelet appears to come out of the domain due to the visualization of the platelet as an enlarged sphere. After an additional 2 ms, the platelet is through the valve housing gap and on the ventricular side of the valve. It is observed that all platelets that leak through valve housing gaps remain within the valve at the end of the simulation. These platelets flow quickly through the valve housing gap, but have slow recirculating motion within the valve afterwards. Thus, no platelets from valve housing leakage traverse into the ventricular chamber. This is contrary to platelets that leak through the b-datum orifice, in which all platelets are immediately swept into the ventricular chamber.
Fig. 18.
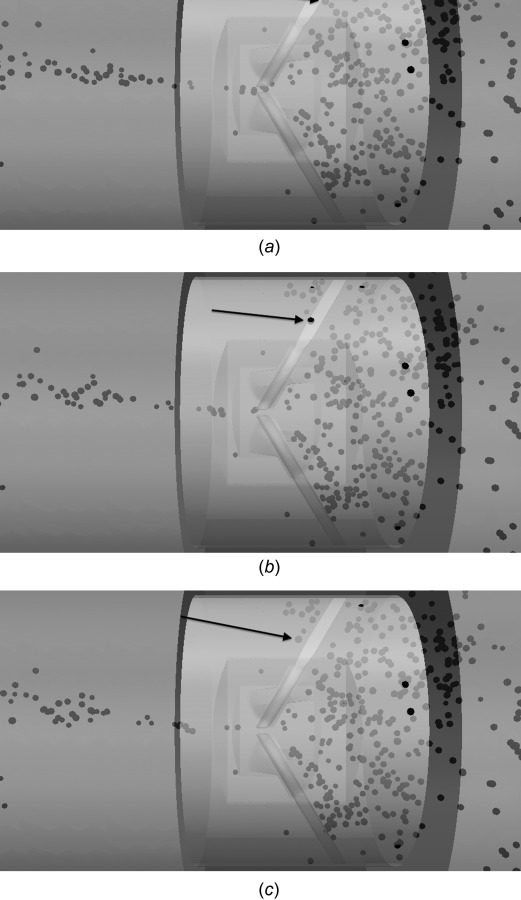
Platelet leaking through valve housing gap (a) approaching leaflet, (b) flowing through gap 2 ms later, and (c) on ventricular side after leakage
Platelets that leak through the central b-datum gap versus the valve housing gap are differentiated by damage as well (Table 4). 31.1% of the total platelets leak through to the ventricular side after 320 ms of simulation. Most of these platelets (74.3%) leak through the b-datum gap, and experience 3.0 times more damage than platelets that remain on the aortic side. Platelets that leak through valve housing gaps still experience 1.71 times more damage than platelets that remain on the aortic side.
Table 4.
Distribution of platelets by method of leakage to ventricular side with BDI values
| Average damage | |||
|---|---|---|---|
| Leakage gap | # of platelets | % of leaked platelets | (dynes·s/cm2) |
| Total | 623 | 100 | 0.1137 |
| b-datum gap | 463 | 74.3 | 0.1278 |
| Valve housing gap | 160 | 25.7 | 0.0727 |
This lesser damage from valve housing leakage flow is likely due to the fact that after leaking through the valve housing gaps, platelets simply recirculate within the valve, similar to platelets that recirculate on the aortic side of the valve. Platelets that flow through the b-datum gap are instead caught in a strong leakage jet and are caught in continuous recirculation vortices in the ventricular chamber. This b-datum leakage jet is also associated with high fluid shear stresses (Fig. 17(c)), explaining why these platelets experience 1.76 times more accumulated damage than platelets flowing through valve housing gaps. It has also been shown that the fluid shear stresses at the b-datum jet are consistently higher (80–130 dynes/cm2) than those at the valve housing gaps (10–20 dynes/cm2) throughout the mid-diastolic phase [33].
Discussion
These simulations performed with physiologic adult conditions highlight aspects of BMHV flow that could lead to thromboembolic complications. Upon Lagrangian analysis of platelet damage paths, it is found that relatively low instantaneous damage occurs for platelets caught in leaflet vortex wakes. Only moderate levels of instantaneous shear stress (5–15 dynes/cm2 maximum shear stress) occur in near-peak flow when these vortex wakes break into small eddies (Fig. 19). Generally, platelets caught in leaflet vortex wakes experience mild platelet shear stress (5–15 dynes/cm2 maximum shear stress) and moderate levels of accumulated platelet damage at the end simulation timepoint (<0.5 dynes·s/cm2) as these platelets quickly advect downstream, where vortical structures dissipate and damage levels are low.
Fig. 19.
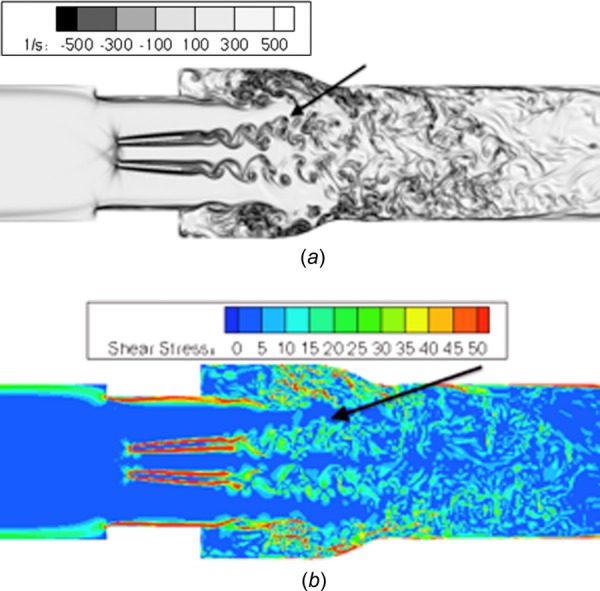
Near peak flow (Re = 5500) showing (a) disorganized vortex shedding past leaflet tips that incur mild damage, (b) corresponding shear stress field (units in dynes/cm2)
However, higher levels of instantaneous shear stress (20–50 dynes/cm2 maximum shear stress) occur in platelets caught in mixing vortical regions where the sinus expansion recirculation and the leaflet vortex wakes interact. This demonstrates that leaflet vortex shedding itself does not induce high levels of damage, but mixing with the sinus recirculation could lead to high platelet damage. The sinus recirculation regions of these simulations cause both higher levels of instantaneous shear stress (20–50 dynes/cm2 maximum shear stress) on platelets and have longer exposure times that lead to high accumulated damage values.
Although previous studies have reported BMHV flow stresses that are orders of magnitude higher (>1000 dynes/cm2) [54], these values are for turbulent Reynolds stresses and not viscous fluid shear stresses. As turbulent stresses are a mathematical quantity and not an actual mechanical stress on the fluid, the viscous fluid shear stresses are more relevant.
The most common path for high platelet damage occurs for constant recirculation in the sinus. This path is noted by a moderate level of instantaneous damage but for an extended period of time. This pathline is more common due to the large region of the sinus recirculation as compared to the other damage path regions (near wall, near leaflet closing wake). In addition, sinus recirculation occurs for the entire systolic phase of 350 ms, allowing for many platelets to be trapped in this flow. This recirculation flow is of considerable concern, as it is very easy for platelets to be caught in the sinus expansion. Platelets in this sinus region do not advect downstream but continue to recirculate throughout the cycle. If platelets were to become activated, this continuous recirculation could lead to a coagulation cascade from release of activating factor to other nearby platelets that are also recirculating. This is similar to the development of thrombus in the hinge regions, which is also caused by stagnation and recirculation regions.
It is noted that platelets residing in the aortic chamber at the end of the simulation are not among the most damaged platelets. Platelets in the aortic chamber are generally caught in leaflet vortex shedding wakes and experience both low instantaneous shear stress (5–15 dynes/cm2) and low accumulated damage. This low damage occurs even in peak flow when the large vortices break into small scale eddies. Thus, attempting to characterize instantaneous flow fields and attributing high damage to unstable and disorganized features of peak flow is shown to be not accurate in assessing actual platelet damage. This previous method has commonly been used in literature to connect instantaneous flow fields with platelet damage [22,23,55]. The results of this study demonstrate that recirculation regions cause both higher instantaneous damage and higher accumulated damage, and these flow mixing regions should be focused on in the future when assessing single-phase flow simulation results. This also demonstrates the need for Lagrangian particle tracking to more accurately assess platelet damage.
Sinus regions are naturally present in the aorta, and recirculation regions are present even in native aortic valve flows. The simulations of this study also are performed for a domain with a sudden sinus step expansion, whereas the physiological sinus has a more gradual expansion. The sudden step expansion in these simulations leads to a stronger recirculation region in the simulations than would actually occur in vivo, which could lead to the higher damage accumulation values in the sinus. Even with a native aortic sinus, however, recirculation regions would occur that could cause high platelet damage. Nonetheless, it is likely that the level of platelet damage for a native sinus region would be lower. Future simulations may employ more realistic aortic sinus geometries to determine effects on platelet damage.
The conclusion of these results is not that the sinus itself is a particular danger, or that anything may be fixed with a native aortic sinus. It is instead determined that strong recirculation regions, such as those present in the sinus expansion and caused by the sudden step expansion, are more dangerous for platelet activation than instantaneous damage levels caused by flows. As the aortic sinus is not something to be fixed, the recommendation for the creation of future prosthetic devices is to avoid designs that cause strong recirculation zones. In the previous work by Wu et al. [30] and Yun et al. [31], it is determined that sharp geometries lead to stagnation and recirculation regions in BMHV hinges that lead to thromboembolic complications. Similarly, it is shown that sharp transition geometries (sudden sinus step expansion) may lead to high damage in bulk BMHV flows due to formation of recirculation regions. Thus, it is recommended that future valve design (housing, leaflets, and hinges) generally avoid sharp geometries to avoid recirculation regions that lead to high accumulated platelet damage.
The platelets along the leaflet surface in the simulation (Figs. 11 and 12) eventually traverse to the ending leaflet tips, where they advect to the aortic chamber quickly due to vortex shedding past the leaflets. Although the platelets incur a high level of damage, they are not of particular danger once they advect downstream. In addition, as BMHV leaflets are made of thromboresistant pyrolitic carbon, it is unlikely that damaged platelets would activate and aggregate on leaflet surfaces. It has previously been shown that vortex generators on leaflet surfaces can reduce blood damage potential during diastolic flows [17,19]. These vortex generators are primarily designed for reduction of blood damage in diastolic flows through the breakup of coherent vortices in the b-datum jet. However, their effects on systolic flow are unknown. As it is noted (Figs. 19(a) and 19(b)) that damage from the vortices shedding from the leaflet tips are not connected with high levels of accumulated damage, it is possible that vortex generators may help reduce damage in systolic flows as well. These may cause flow separation from the leaflet surfaces, thus preventing near-leaflet shear regions that cause platelet damage. The vortex shedding wakes from these vortex generators could cause minimal damage to platelets, similar to the vortices shed from leaflet tips. However, this should be investigated in detail in the future, as the possibility of dangerous recirculation caused by these vortex generators during systole is unknown. In addition, flow separation from the leaflet surface may cause increased mixing with the sinus recirculation region, which is also dangerous. Thus, further investigation in numerical simulations is warranted.
The diastolic flow simulations show that platelets that leak through the leaflets experience 2.68 times more damage and also must flow through the valve again during the next systolic phase. It should be noted that platelets that leak through the leaflets do not experience high-accumulated damage (0.1137 dynes·s/cm2 average) even for 320 ms of exposure time. Thus, for one pass in systolic or diastolic flow, platelets are not in danger of becoming activated. It is the continuous recirculation of platelets near the valve that is of higher concern.
It is found that few (8.0%) platelets leak through the valve housing gaps. These platelets also experience lower damage compared to platelets that leak through the b-datum gap. This is primarily due to the slow recirculation of platelets after they have leaked through the valve housing gaps. The platelets that flow through the b-datum leakage jet experience higher instantaneous damage for a longer period of time. This higher damage after leakage is possibly made worse by the asymmetric leakage jets in the diastolic phase as observed in a previous study [33]. The continuous interaction of the b-datum jet with larger vortices on the ventricular side may explain the higher damage experienced by platelets in b-datum leakage flows.
This simulation demonstrates that valve housing leakage jets are not highly damaging to platelets, particularly when compared to b-datum leakage or the known dangers of hinge leakage. The potential of b-datum leakage jets to incur damage is more troubling, and efforts should be focused on reducing the coherent jets through this region. This can be accomplished by the inclusion of vortex generators, as has been previously proposed [17,19] and demonstrated.
This data can only be viewed as a “one-pass” model, as platelets that pass through the valve and through the aorta may not return to the heart for some time. In addition, platelets that do return to the heart will likely not undergo the same platelet path for each pass through the BMHV. Although none of the BDI data can be extrapolated over multiple flows through the valve, the results of this study still highlight regions of the domain, aspects of solid geometry and subsequent flow fields, and platelet pathlines that may be of interest for thromboembolic complications. These simulations only model dilute platelet suspensions due to computational limitations, but represent a significant step in BMHV flow modeling compared to previous studies.
No strong conclusions can be made on thromboembolic potential of valves based on these one-pass simulations, particularly due to the idealized nature of the solid geometry. Instead, these simulations highlight aspects of BMHV flows that may lead to increased blood damage in ways that experimental studies cannot. This methodology can also be used in future studies to assess comparative thromboembolic potential across different prosthetic designs and flow conditions. These and future simulations can also be used in combination with experimental studies to assess valve hemodynamics and blood damage performance. This can be performed with blood damage experiments, for example, to correlate BDI values from computational simulations to blood damage experimental data. Although the simulations of this study have highlighted damage patterns in a specific case of pulsatile BMHV flow, the multiscale numerical method can be applied as a general predictive tool for blood damage assessment for novel devices in cardiovascular flows.
Conclusions
In this study, pulsatile BMHV flow is modeled using a high performance multiscale suspension flow solver with the highest spatiotemporal resolution to date. Platelet damage is modeled for the cardiac cycle, and results are analyzed in a variety of viewpoints to better understand blood damage in these flows. Platelet damage is shown to not exceed activation threshold values for one-pass, though danger regions and pathlines are highlighted. In particular, platelets that are trapped in recirculation zones are of high interest. It is concluded that studies should shift focus in blood damage towards regions where high flow mixing may occur, rather than simply evaluate instantaneous fluid shear stress fields. For future device development, it is recommended that sharp transition geometries should be avoided to prevent increased recirculation zones. Future simulations may wish to quantify flow fields on propensity of flow mixing to predict where platelet damage may occur. In the diastolic phase, flow through the b-datum gap is shown to be significantly higher in causing damage to platelets, and efforts should be concentrated to reduce coherent leakage jets through this gap. The numerical method has been applied to BMHV flows in this study but may be used as a generic and powerful tool for evaluating blood damage in a variety of cardiovascular flows and prosthetic devices.
Acknowledgment
The authors would like to thank Shiva Arjunon, Lucia Mirabella, Prasad Dasi, and Jarek Rossignac for their valuable comments in the development of this work.
This research was carried out through funding from the National Heart, Lung and Blood Institute (NHLBI), Grant No. HL-07262. Computational simulations were performed using resources from Extreme Science and Engineering Digital Environment (XSEDE), allocation TG-CTS100012. The authors are grateful for their continuing support.
Glossary
Nomenclature
- BDI =
blood damage index
- BMHV =
bileaflet mechanical heart valve
- cSt =
centi-stokes
- CFD =
computational fluid dynamics
- D =
pipe diameter
- EBF =
external boundary force
- ELB =
entropic lattice-Boltzmann
- FSI =
fluid–solid interaction
- LBM =
lattice-Boltzmann method
- microCT =
microcomputed tomography
- PIV =
particle image velocimetry
- RBC =
red blood cell
- Re =
bulk flow Reynolds number
- SBB =
standard bounce-back
- SJM =
St. Jude medical
- Wn =
Womersley number
- Δt =
numerical timestep
- τmax =
maximum instantaneous surface shear stress
- τshear stress =
fluid viscous shear stress
Appendix
Subgrid Particle Modeling.
To test the numerical capabilities of the EBF method to model accurate rigid-body dynamics for subgrid particles, a validation case is presented. The case of a rigid ellipsoid isolated in the center of simple shear flow is modeled (Fig. 20), with the theoretical solution for Stokes flow given by Jeffery [46]. This solution assumes that one of the principal axes is kept parallel to the vorticity vector and that the shear flow is in the Stokes flow regime (Rep → 0). The top and bottom walls move in opposite directions with magnitude U w/2 and are separated by a wall distance of H.
Fig. 20.
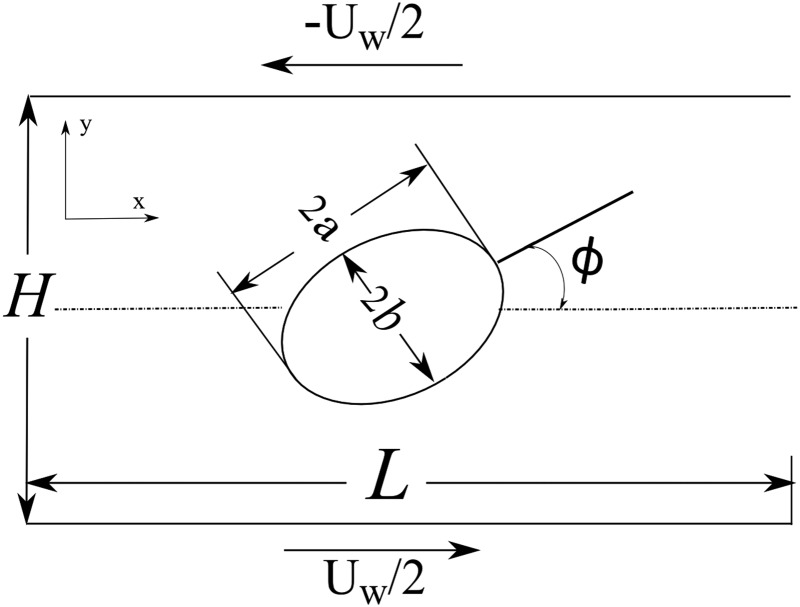
Rigid ellipsoid isolated in simple shear flow (Jeffery's orbit)
The general form of a 3D ellipsoid is given by
| (A1) |
As the principal axis in the z-direction is kept parallel to the vorticity vector, the radius c in the z-direction does not affect the solution. The particle Reynolds number, Rep, is defined as
| (A2) |
where G is the shear rate and is calculated as G = U w/H. The particle diameter d is given as twice the major axis radius, or d = 2 a.
For Stokes flow, the rotation angle, ϕ, and angular rate of rotation, ∂ϕ/∂t, are exactly defined as
| (A3) |
| (A4) |
Although this solution is theoretically derived for Stokes flow at zero particle Reynolds number, simulations can still be performed to approximate Jeffery's orbit with Rep ≪ 1. Two-dimensional simulations of Jeffery's orbit were also performed for validation of the LBM–SBB method by Aidun et al. [36].
Accuracy of the EBF method is also quantified by determining orbital drift from theory. The orbital drift is defined as
| (A5) |
| (A6) |
where T sim is the time to complete one orbital period for the numerical simulation, T theory is the theoretical time to complete one orbital period from Jeffery's solution, and a and b are the ellipsoid axis radii.
For one-way FSI, cases of subgrid scale resolution for modeling of the solid particles are tested. This is particularly relevant as the platelets simulated in this study are 3 μm, whereas the fluid resolution is 80 μm. Thus, subgrid modeling is a requirement for any suspension flow modeling method that attempts to model realistic platelet particles.
The flow domain for this test is 120 × 120 × 60 in lattice Boltzmann units, with a channel length and height of 120. The shear rate is given as G = 1/6000, corresponding to a wall velocity of U w/2 = ±0.01 in LB units. The kinematic viscosity is set at 1.5 in LB units. The platelet originally modeled with radii 7 × 7 × 3.1 is scaled by a factor of 1/100. This results in a platelet with maximum diameter of 0.14 times the fluid spatial grid resolution.
The results (Fig. 21) show excellent matching between theory and simulations for multiple orbital periods, with no drift observed. This is also the case despite the maximum particle diameter being significantly smaller than the fluid grid spatial resolution. The results of this multiscale Jeffery's orbit simulation demonstrate that the EBF method is capable of accurately capturing particle dynamics for solid particles much smaller than the fluid grid resolution. The maximum diameter of the particle is 0.14 times the fluid spatial grid, and the solid mesh resolution is at an even finer grid resolution of approximately 0.025 times the fluid spatial grid. For the pulsatile BMHV suspension flow simulations of this study, the maximum diameter of the platelets is approximately 0.04 times the fluid spatial grid. The subgrid resolution modeling capabilities of the EBF method were also demonstrated in the BMHV hinge flow simulations from the study by Yun et al. [31].
Fig. 21.

(a) Angular orientation and (b) angular velocity variation for simulations versus theory of Jeffery's orbit for platelet 0.07 × 0.07 × 0.031 radius, one-way FSI, Rep = 0.0218, G = 1/6000, τ = 5
Figure 22 demonstrates drift from Jeffery's orbit theory for two-way FSI based on a particle size that maintains the same aspect ratio, but shrinks in total size. The flow domain, wall velocity, and fluid kinematic viscosity are maintained with the same values of the previous example (120 × 120 × 60 domain, U w/2 = ±0.01, kinematic viscosity = 1.5). The particle used for these tests is a 12 × 9 × 9 radii ellipsoid for the largest case, which is then shrunk in size. It is observed that the shrinking particle leads to closer matching with theory. For a particle with subgrid resolution with 0.012 × 0.009 × 0.009 radii, the particle shows only 0.051% drift from Jeffery's orbit theory. This is likely due to the fact that as the particle becomes smaller, the effect it has on the flow field is significantly reduced.
Fig. 22.

Effect of particle size on orbital drift from Jeffery's orbit theory for two-way FSI modeling (maximum diameter given as major axis diameter in LB units)
As the particle grows in size, the drift from theory increases to approximately 0.97% for a 12 × 9 × 9 ellipsoid. This is likely due to the relative solid mesh resolution at this largest particle size, where the solid surface elements have length greater than the fluid mesh resolution. Thus, as the particle becomes larger, the comparative mesh resolution of the solid surface becomes coarser, leading to higher inaccuracies. Nevertheless, the drift from theory is still less than 1%. This combination of results justifies the use of LBM–EBF in this study to accurately capture platelet particle dynamics with subgrid scale modeling.
Platelet Modeling in BMHV Flow for One-Way FSI Versus Two-Way FSI.
The difference between one-way and two-way FSI modeling of suspended subgrid platelets is tested for this BMHV flow. Three hundred platelets are seeded at peak flow at an axial location immediately downstream of the leaflet tips. These platelets are randomly distributed over a cross section encompassing the sinus expansion. The platelets are released from peak flow to late systole. Two simulations are performed with identical setups, but one simulation employs one-way FSI of platelets and the other uses two-way FSI.
The angular orientation of a platelet is defined by three angles: θ, ϕ, and ψ. As the platelets are modeled as oblate spheroids, θ and ϕ represent rotation about the two major axes (3 μm diameter), and ψ represents rotation about the minor axis (1.3 μm diameter). The angular rotation is defined as the absolute value of the difference in an angle of orientation over a timestep, Δt. For example, the angular rotation of θ at time t is defined as
| (A7) |
where t is the current numerical timestep, and Δt corresponds to the frequency of data output of 200 numerical timesteps (0.5 ms).
An example platelet is released close to the sinus expansion walls, and recirculates within the sinus expansion. This platelet (Fig. 23) incurs 1.6 dynes·s/cm2 of damage. The rotation angle over time shows spikes in changes in angular orientation, with close matching of one-way and two-way FSI. The results of two-way FSI show just 1.1% difference in final BDI value compared to one-way FSI.
Fig. 23.
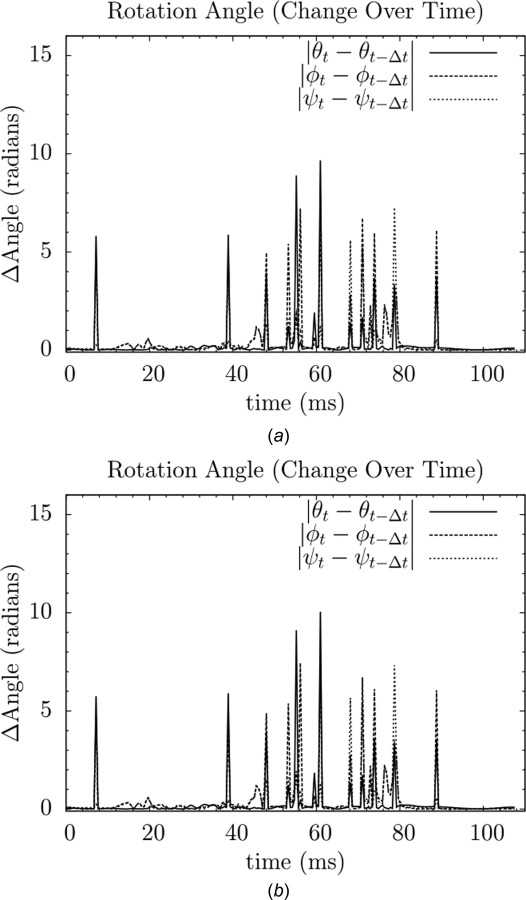
Variation of rotation angle over time for an example platelet for (a) one-way FSI and (b) two-way FSI
For all 300 released platelets in this test, the one- and two-way FSI simulations also give very similar results for platelet motion (position) and BDI values. This demonstrates that the one-way FSI approximation for platelets of the BMHV blood damage studies closely matches what would be modeled for two-way FSI, when performing at subgrid resolution. As shown in Fig. 5, calculated shear stress values are elevated for subgrid particles but within 26% of calculated values for well-resolved supergrid particles. Thus, the subgrid one-way FSI modeling of platelets is a reasonable approximation for determining platelet motion, shear stress calculation, and BDI calculation.
Contributor Information
B. Min Yun, G.W. Woodruff School of Mechanical Engineering, 801 Ferst Drive, Atlanta, GA 30332-0405, e-mail: min@gatech.edu
Cyrus K. Aidun, G.W. Woodruff School of Mechanical Engineering, 801 Ferst Drive, Atlanta, GA 30332-0405 Parker H. Petit Institute for, Bioengineering and Bioscience, 315 Ferst Dr. NW, Atlanta, GA 30332, e-mail: cyrus.aidun@me.gatech.edu.
Ajit P. Yoganathan, G.W. Woodruff School of Mechanical Engineering, 801 Ferst Drive, Atlanta, GA 30332-0405; Parker H. Petit Institute for, Bioengineering and Bioscience, 315 Ferst Dr. NW, Atlanta, GA 30332; Wallace H. Coulter Department of, Biomedical Engineering, School of Chemical and, Biomolecular Engineering, 313 Ferst Drive, Atlanta, GA 30332-0535, e-mail: ajit.yoganathan@bme.gatech.edu.
References
- [1]. Kulik, A. , Bédard, P. , Lam, B. K. , Rubens, F. D. , Hendry, P. J. , Masters, R. G. , Mesana, T. G. , and Ruel, M. , 2006, “Mechanical Versus Bioprosthetic Valve Replacement in Middle-Aged Patients,” Eur. J. Cardiothorac. Surg., 30(3), pp. 485–491. 10.1016/j.ejcts.2006.06.013 [DOI] [PubMed] [Google Scholar]
- [2]. Black, M. M. , and Drury, P. J. , 1994, “Mechanical and Other Problems of Artificial Valves,” Curr. Topic Pathol., 86, pp. 127–159. 10.1007/978-3-642-76846-0 [DOI] [PubMed] [Google Scholar]
- [3]. Yoganathan, A. , Leo, H. , Travis, B. , and Teoh, S. , 2003, “Heart Valve Bioengineering,” Encyclopedia of Comprehensive Structural Integrity, Elsevier Science, New York, pp. 795–796. [Google Scholar]
- [4]. Bonow, R. O. , Carabello, B. A. , Chatterjee, K. , de Leon, A. C., Jr. , Faxon, D. P. , Freed, M. D. , Gaasch, W. H. , Lytle, B. W. , Nishimura, R. A. , O'Gara, P. T. , O'Rourke, R. A. , Otto, C. M. , Shah, P. M. , Shanewise, J. S. , and American College of Cardiology/American Heart Association Task Force on Practice Guidelines, 2008, “Focused Update Incorporated Into the ACC/AHA 2006 Guidelines for the Management of Patients With Valvular Heart Disease: A Report of the American College of Cardiology/American Heart Association Task Force on Practice Guidelines (Writing Committee to Revise the 1998 Guidelines for the Management of Patients With Valvular Heart Disease): Endorsed by the Society of Cardiovascular Anesthesiologists, Society for Cardiovascular Angiography and Interventions, and Society of Thoracic Surgeons,” Circulation, 118(15), pp. e523–e661. 10.1161/CIRCULATIONAHA.108.190748 [DOI] [PubMed] [Google Scholar]
- [5]. Giersiepen, M. , Wurzinger, L. J. , Opitz, R. , and Reul, H. , 1990, “Estimation of Shear Stress-Related Blood Damage in Heart Valve Prostheses—In Vitro Comparison of 25 Aortic Valves,” Int. J. Artif. Organs, 13(5), pp. 300–306. [PubMed] [Google Scholar]
- [6]. Ellis, J. , and Yoganathan, A. , 2000, “A Comparison of the Hinge and Near-Hinge Flow Fields of the St. Jude Medical Hemo-Dynamic Plus and Regent Bileaflet Mechanical Heart Valves,” J. Thorac. Cardiovasc. Surg., 119 (1), pp. 83–93. 10.1016/S0022-5223(00)70221-2 [DOI] [PubMed] [Google Scholar]
- [7]. Ellis, J. , Healy, T. M. , Fontaine, A. A. , Saxena, R. , and Yoganathan, A. , 1996, “Velocity Measurements and Flow Patterns Within the Hinge Region of a Medtronic Parallel Bileaflet Mechanical Heart Valve With Clear Housing,” J. Heart Valve Dis., 5(6), pp. 591–599. [PubMed] [Google Scholar]
- [8]. Lu, P. C. , Lai, H. C. , and Liu, J. S. , 2001, “A Re-evaluation and Discussion on the Threshold Limit for Hemolysis in a Turbulent Shear Flow,” J. Biomech., 34(10), pp. 1361–1364. 10.1016/S0021-9290(01)00084-7 [DOI] [PubMed] [Google Scholar]
- [9]. Barbetseas, J. , Nagueh, S. F. , Pitsavos, C. , Toutouzas, P. K. , Quiñones, M. A. , and Zoghbi, W. A. , 1998, “Differentiating Thrombus From Pannus Formation in Obstructed Mechanical Prosthetic Valves: An Evaluation of Clinical, Transthoracic and Transesophageal Echocardiographic Parameters,” J. Am. Coll. Cardiol., 32(5), pp. 1410–1417. 10.1016/S0735-1097(98)00385-4 [DOI] [PubMed] [Google Scholar]
- [10]. Deviri, E. , Sareli, P. , Wisenbaugh, T. , and Cronje, S. L. , 1991, “Obstruction of Mechanical Heart Valve Prostheses: Clinical Aspects and Surgical Management,” J. Am. Coll. Cardiol., 17(3), pp. 646–650. 10.1016/S0735-1097(10)80178-0 [DOI] [PubMed] [Google Scholar]
- [11]. Hylen, J. C. , 1972, “Mechanical Malfunction and Thrombosis of Prosthetic Heart Valves,” Am. J. Cardiol., 30(4), pp. 396–404. 10.1016/0002-9149(72)90571-1 [DOI] [PubMed] [Google Scholar]
- [12]. Herbertson, L. H. , Deutsch, S. , and Manning, K. B. , 2011, “Near Valve Flows and Potential Blood Damage During Closure of a Bileaflet Mechanical Heart Valve,” ASME J. Biomech. Eng., 133(9), p. 094507. 10.1115/1.4005167 [DOI] [PMC free article] [PubMed] [Google Scholar]
- [13]. Lim, W. L. , Chew, Y. T. , Chew, T. C. , and Low, H. T. , 1994, “Particle Image Velocimetry in the Investigation of Flow Past Artificial Heart Valves,” Ann. Biomed. Eng., 22(3), pp. 307–318. 10.1007/BF02368237 [DOI] [PubMed] [Google Scholar]
- [14]. Lim, W. L. , Chew, Y. T. , Chew, T. C. , and Low, H. T. , 1998, “Steady Flow Dynamics of Prosthetic Aortic Heart Valves: A Comparative Evaluation With PIV Techniques,” J. Biomech., 31(5), pp. 411–421. 10.1016/S0021-9290(98)00026-8 [DOI] [PubMed] [Google Scholar]
- [15]. Lim, W. L. , Chew, Y. T. , Chew, T. C. , and Low, H. T. , 2001, “Pulsatile Flow Studies of a Porcine Bioprosthetic Aortic Valve In Vitro: PIV Measurements and Shear-Induced Blood Damage,” J. Biomech., 34(11), pp. 1417–1427. 10.1016/S0021-9290(01)00132-4 [DOI] [PubMed] [Google Scholar]
- [16]. Manning, K. B. , Kini, V. , Fontaine, A. A. , Deutsch, S. , and Tarbell, J. M. , 2003, “Regurgitant Flow Field Characteristics of the St. Jude Bileaflet Mechanical Heart Valve Under Physiologic Pulsatile Flow Using Particle Image Velocimetry,” Artif. Organs, 27(9), pp. 840–846. 10.1046/j.1525-1594.2003.07194.x [DOI] [PubMed] [Google Scholar]
- [17]. Dasi, L. P. , Murphy, D. W. , Glezer, A. , and Yoganathan, A. P. , 2008, “Passive Flow Control of Bileaflet Mechanical Heart Valve Leakage Flow,” J. Biomech., 41(6), pp. 1166–1173. 10.1016/j.jbiomech.2008.01.024 [DOI] [PubMed] [Google Scholar]
- [18]. Fallon, A. M. , Dasi, L. P. , Marzec, U. M. , Hanson, S. R. , and Yoganathan, A. P. , 2008, “Procoagulant Properties of Flow Fields in Stenotic and Expansive Orifices,” Ann. Biomed. Eng., 36(1), pp. 1–13. 10.1007/s10439-007-9398-3 [DOI] [PubMed] [Google Scholar]
- [19]. Murphy, D. W. , Dasi, L. P. , Vukasinovic, J. , Glezer, A. , and Yoganathan, A. P. , 2010, “Reduction of Procoagulant Potential of b-Datum Leakage Jet Flow in Bileaflet Mechanical Heart Valves via Application of Vortex Generator Arrays,” ASME J. Biomech. Eng., 132(7), p. 071011. 10.1115/1.4001260 [DOI] [PubMed] [Google Scholar]
- [20]. Dasi, L. P. , Ge, L. , Simon, H. A. , Sotiropoulos, F. , and Yoganathan, A. , 2007, “Vorticity Dynamics of a Bileaflet Mechanical Heart Valve in an Axisymmetric Aorta,” Phys. Fluids, 19, p. 067105. 10.1063/1.2743261 [DOI] [Google Scholar]
- [21]. Ge, L. , Dasi, L. P. , Sotiropoulos, F. , and Yoganathan, A. P. , 2008, “Characterization of Hemodynamic Forces Induced by Mechanical Heart Valves: Reynolds vs. Viscous Stresses,” Ann. Biomed. Eng., 36(2), pp. 276–297. 10.1007/s10439-007-9411-x [DOI] [PubMed] [Google Scholar]
- [22]. Shahriari, S. , Maleki, H. , Hassan, I. , and Kadem, L. , 2012, “Evaluation of Shear Stress Accumulation on Blood Components in Normal and Dysfunctional Bileaflet Mechanical Heart Valves Using Smoothed Particle Hydrodynamics,” J. Biomech., 45(15), pp. 2637–2644. 10.1016/j.jbiomech.2012.08.009 [DOI] [PubMed] [Google Scholar]
- [23]. De Tullio, M. D. , Cristallo, A. , Balaras, E. , and Verzicco, R. , 2010, “Direct Numerical Simulation of the Pulsatile Flow Through an Aortic Bileaflet Mechanical Heart Valve,” J. Fluid Mech., 622, pp. 259–290. 10.1017/S0022112008005156 [DOI] [Google Scholar]
- [24]. Borazjani, I. , Ge, L. , and Sotiropoulos, F. , 2008, “Curvilinear Immersed Boundary Method for Simulating Fluid Structure Interaction With Complex 3D Rigid Bodies,” J. Comput. Phys., 227(16), pp. 7587–7620. 10.1016/j.jcp.2008.04.028 [DOI] [PMC free article] [PubMed] [Google Scholar]
- [25]. Borazjani, I. , and Sotiropoulos, F. , 2010, “The Effect of Implantation Orientation of a Bileaflet Mechanical Heart Valve on Kinematics and Hemodynamics in an Anatomic Aorta,” ASME J. Biomech. Eng., 132(11), p. 111005. 10.1115/1.4002491 [DOI] [PMC free article] [PubMed] [Google Scholar]
- [26]. Alemu, Y. , and Bluestein, D. , 2007, “Flow-Induced Platelet Activation and Damage Accumulation in a Mechanical Heart Valve: Numerical Studies,” Artif. Organs, 31(9), pp. 677–688. 10.1111/j.1525-1594.2007.00446.x [DOI] [PubMed] [Google Scholar]
- [27]. Alemu, Y. , Girdhar, G. , Xenos, M. , Sheriff, J. , Jesty, J. , Einav, S. , and Bluestein, D. , 2010, “Design Optimization of a Mechanical Heart Valve for Reducing Valve Thrombogenicity—A Case Study With ATS Valve,” ASAIO, 56(5), pp. 389–396. 10.1097/MAT.0b013e3181e65bf9 [DOI] [PubMed] [Google Scholar]
- [28]. Dumont, K. , Vierendeels, J. , Kaminsky, R. , Van Nooten, G. , Verdonck, P. , and Bluestein, D. , 2007, “Comparison of the Hemodynamic and Thrombogenic Performance of Two Bileaflet Mechanical Heart Valves Using a CFD/FSI Model,” ASME J. Biomech. Eng., 129(4), pp. 558–565. 10.1115/1.2746378 [DOI] [PubMed] [Google Scholar]
- [29]. Simon, H. A. , Ge, L. , Sotiropoulos, F. , and Yoganathan, A. , 2010, “Numerical Investigation of the Performance of Three Hinge Designs of Bileaflet Mechanical Heart Valves,” Ann. Biomed. Eng., 38(11), pp. 3295–3310. 10.1007/s10439-010-0086-3 [DOI] [PMC free article] [PubMed] [Google Scholar]
- [30]. Wu, J. , Yun, B. M. , Fallon, A. M. , Hanson, S. R. , Aidun, C. K. , and Yoganathan, A. , 2011, “Numerical Investigation of the Effects of Channel Geometry on Platelet Activation and Blood Damage,” Ann. Biomed. Eng., 39(2), pp. 897–910. 10.1007/s10439-010-0184-2 [DOI] [PMC free article] [PubMed] [Google Scholar]
- [31]. Yun, B. M. , Wu, J. , Simon, H. A. , Arjunon, S. , Sotiropoulos, F. , Aidun, C. K. , and Yoganathan, A. , 2012, “A Numerical Investigation of Blood Damage in the Hinge Area of Aortic Bileaflet Mechanical Heart Valves During the Leakage Phase,” Ann. Biomed. Eng., 40(7), pp. 1468–1485. 10.1007/s10439-011-0502-3 [DOI] [PubMed] [Google Scholar]
- [32]. Yun, B. M. , Dasi, L. P. , Aidun, C. K. , and Yoganathan, A. P. , 2014, “Computational Modelling of Flow Through Prosthetic Heart Valves Using the Entropic Lattice-Boltzmann Method,” J. Fluid Mech., 743, pp. 170–201. 10.1017/jfm.2014.54 [DOI] [Google Scholar]
- [33]. Yun, B. M. , Dasi, L. P. , Aidun, C. K. , and Yoganathan, A. P. , 2014, “Highly Resolved Pulsatile Flows Through Prosthetic Heart Valves Using the Entropic Lattice-Boltzmann Method,” J. Fluid Mech., 754, pp. 122–160. 10.1017/jfm.2014.393 [DOI] [Google Scholar]
- [34]. Aidun, C. K. , and Lu, Y. , 1995, “Lattice Boltzmann Simulation of Solid Particles Suspended in Fluid,” J. Stat. Phys., 81(1), pp. 49–61. 10.1007/BF02179967 [DOI] [Google Scholar]
- [35]. Aidun, C. K. , and Clausen, J. R. , 2010, “Lattice Boltzmann Method for Complex Flows,” Annu. Rev. Fluid Mech., 42(1), pp. 439–472. 10.1146/annurev-fluid-121108-145519 [DOI] [Google Scholar]
- [36]. Aidun, C. K. , Lu, Y. , and Ding, E. , 1998, “Direct Analysis of Particulate Suspensions With Inertia Using the Discrete Boltzmann Equation,” J. Fluid Mech., 373, pp. 287–311. 10.1017/S0022112098002493 [DOI] [Google Scholar]
- [37]. Ding, E. J. , and Aidun, C. K. , 2000, “The Dynamics and Scaling Law for Particles Suspended in Shear Flow With Inertia,” J. Fluid Mech., 423, pp. 317–344. 10.1017/S0022112000001932 [DOI] [Google Scholar]
- [38]. Ding, E. J. , and Aidun, C. K. , 2003, “Extension of the Lattice-Boltzmann Method for Direct Simulation of Suspended Particles Near Contact,” J. Stat. Phys., 112(3), pp. 685–708. 10.1023/A:1023880126272 [DOI] [Google Scholar]
- [39]. Wu, J. , and Aidun, C. K. , 2010, “Simulating 3D Deformable Particle Suspensions Using Lattice Boltzmann Method With Discrete External Boundary Force,” Int. J. Numer. Method Fluids, 62(7), pp. 765–783. 10.1002/fld.2043 [DOI] [Google Scholar]
- [40]. Junk, M. , and Yong, W. A. , 2003, “Rigorous Navier–Stokes Limit of the Lattice Boltzmann Equation,” Asymptotic Anal., 35(1), pp. 165–185. [Google Scholar]
- [41]. Junk, M. , and Yang, Z. , 2009, “Convergence of Lattice Boltzmann Methods for Navier–Stokes Flows in Periodic and Bounded Domains,” Numerische Math., 112(1), pp. 65–87. 10.1007/s00211-008-0196-0 [DOI] [Google Scholar]
- [42]. Peskin, C. S. , 2002, “The Immersed Boundary Method,” Acta Numer., 11, pp. 479–517. 10.1017/S0962492902000077 [DOI] [Google Scholar]
- [43]. Wu, J. , and Aidun, C. K. , 2010, “A Method for Direct Simulation of Flexible Fiber Suspensions Using Lattice-Boltzmann Equation With External Boundary Force,” Int. J. Multiphase Flow, 36 (3), pp. 202–209. 10.1016/j.ijmultiphaseflow.2009.11.003 [DOI] [Google Scholar]
- [44]. Keating, B. , Vahala, G. , Yepez, J. , Soe, M. , and Vahala, L. , 2007, “Entropic Lattice Boltzmann Representations Required to Recover Navier–Stokes Flows,” Phys. Rev. E, 75(3), p. 036712. 10.1103/PhysRevE.75.036712 [DOI] [PubMed] [Google Scholar]
- [45]. Bluestein, D. , Niu, L. , Schoephoerster, R. T. , and Dewanjee, M. K. , 1997, “Fluid Mechanics of Arterial Stenosis: Relationship to the Development of Mural Thrombus,” Ann. Biomed. Eng., 25(2), pp. 344–356. 10.1007/BF02648048 [DOI] [PubMed] [Google Scholar]
- [46]. Jeffery, G. B. , 1922, “The Motion of Ellipsoidal Particles Immersed in a Viscous Fluid,” Proc. R. Soc. Lond. Ser. A, 102, pp. 161–179. 10.1098/rspa.1922.0078 [DOI] [Google Scholar]
- [47]. Reasor, D. A., Jr , 2011, “Numerical Simulation of Cellular Blood Flow,” Mechanical Engineering, Georgia Institute of Technology, Atlanta, GA, p. 164. [Google Scholar]
- [48]. Fox, S. I. , 2006, Human Physiology, 9th ed., McGraw-Hill, New York. [Google Scholar]
- [49]. Weisstein, E. W. , “Disk Point Picking,” http://mathworld.wolfram.com/DiskPointPicking.html
- [50]. Hellums, J. D. , 1994, “Whitaker Lecture: Biorheology in Thrombosis Research,” Ann. Biomed. Eng., 22(5), pp. 445–455. 10.1007/BF02367081 [DOI] [PubMed] [Google Scholar]
- [51]. Ramstack, J. M. , Zuckerman, L. , and Mockros, L. F. , 1979, “Shear-Induced Activation of Platelets,” J. Biomech., 12(2), pp. 113–125. 10.1016/0021-9290(79)90150-7 [DOI] [PubMed] [Google Scholar]
- [52]. Sheriff, J. , Bluestein, D. , Girdhar, G. , and Jesty, J. , 2010, “High-Shear Stress Sensitizes Platelets to Subsequent Low-Shear Conditions,” Ann. Biomed. Eng., 38(4), pp. 1442–1450. 10.1007/s10439-010-9936-2 [DOI] [PMC free article] [PubMed] [Google Scholar]
- [53]. Xenos, M. , Girdhar, G. , Alemu, Y. , Jesty, J. , Slepian, M. , Einav, S. , and Bluestein, D. , 2010, “Device Thrombogenicity Emulator (DTE)-Design Optimization Methodology for Cardiovascular Devices: A Study in Two Bileaflet MHV Designs,” J. Biomech., 43(12), pp. 2400–2409. 10.1016/j.jbiomech.2010.04.020 [DOI] [PMC free article] [PubMed] [Google Scholar]
- [54]. Yoganathan, A. , He, Z. , and Jones, S. C. , 2004, “Fluid Mechanics of Heart Valves,” Ann. Rev. Biomed. Eng., 6 (1), pp. 331–362. 10.1146/annurev.bioeng.6.040803.140111 [DOI] [PubMed] [Google Scholar]
- [55]. Ge, L. , Jones, S. C. , Sotiropoulos, F. , Healy, T. M. , and Yoganathan, A. P. , 2003, “Numerical Simulation of Flow in Mechanical Heart Valves: Grid Resolution and the Assumption of Flow Symmetry,” ASME J. Biomech. Eng., 125(5), pp. 709–718. 10.1115/1.1614817 [DOI] [PubMed] [Google Scholar]


