

Abstract
The prevalence of brain tumors in males is common but unexplained. While sex differences in disease are typically mediated through acute sex hormone actions, sex-specific differences in brain tumor rates are comparable at all ages, suggesting that factors other than sex hormones underlie this discrepancy. We found that mesenchymal glioblastoma (Mes-GBM) affects more males as the result of cell-intrinsic sexual dimorphism in astrocyte transformation. We used astrocytes from neurofibromin-deficient (Nf1–/–) mice expressing a dominant-negative form of the tumor suppressor p53 (DNp53) and treated them with EGF as a Mes-GBM model. Male Mes-GBM astrocytes exhibited greater growth and colony formation compared with female Mes-GBM astrocytes. Moreover, male Mes-GBM astrocytes underwent greater tumorigenesis in vivo, regardless of recipient mouse sex. Male Mes-GBM astrocytes exhibited greater inactivation of the tumor suppressor RB, higher proliferation rates, and greater induction of a clonogenic, stem-like cell population compared with female Mes-GBM astrocytes. Furthermore, complete inactivation of RB and p53 in Mes-GBM astrocytes resulted in equivalent male and female tumorigenic transformation, indicating that intrinsic differences in RB activation are responsible for the predominance of tumorigenic transformation in male astrocytes. Together, these results indicate that cell-intrinsic sex differences in RB regulation and stem-like cell function may underlie the predominance of GBM in males.
Introduction
Throughout life, there are sex-specific differences in the prevalence of multiple human diseases. Many of these disparities, such as the rise in autoimmune diseases in women during their reproductive years or the increase in cardiovascular diseases in postmenopausal women, can be related to differences in sex hormone abundance (1). However, not all sex disparity in human disease correlates with the dynamics of circulating sex hormones. Regardless of age, brain cancers are more common in males than in females (2). In fact, multiple brain tumor types in children exhibit marked sex disparity. For example, group 3 and group 4 medulloblastomas occur in nearly twice as many boys as girls (3, 4). These tumors occur with peak incidences in young (<5-year-old) and peripubertal children, respectively. Thus, while the hormonal milieu of young and peripubertal children is significantly different, there is a potent effect of sex on tumorigenesis in both age groups. These observations suggest that the sex disparity in medulloblastoma cannot be simply ascribed to the effects of circulating sex hormones. Therefore, an examination of alternate mechanisms through which sex can influence brain tumorigenesis is warranted.
Glioblastoma (GBM), the most common malignant brain tumor in adults, also exhibits a greater prevalence in men (5). Despite enormous breakthroughs in basic cancer research, outcome from GBM remains dismal. For those treated with surgery, radiation, and chemotherapy, overall survival remains approximately 14 months (6). In addition to more frequently developing GBM, males also have a lower 5-year survival rate compared with that of females with GBM and other malignant CNS tumors (7). Understanding how sex affects GBM biology could elucidate mechanisms relevant to both its genesis and response to treatment. In the current study, we investigated whether the effect of sex in GBM involves cell-intrinsic sexual dimorphism in tumor progenitors. Identification of such cell-intrinsic mechanisms has broad implications for all of cancer biology and cancer care.
Results
Male predominance in GBM is subtype specific.
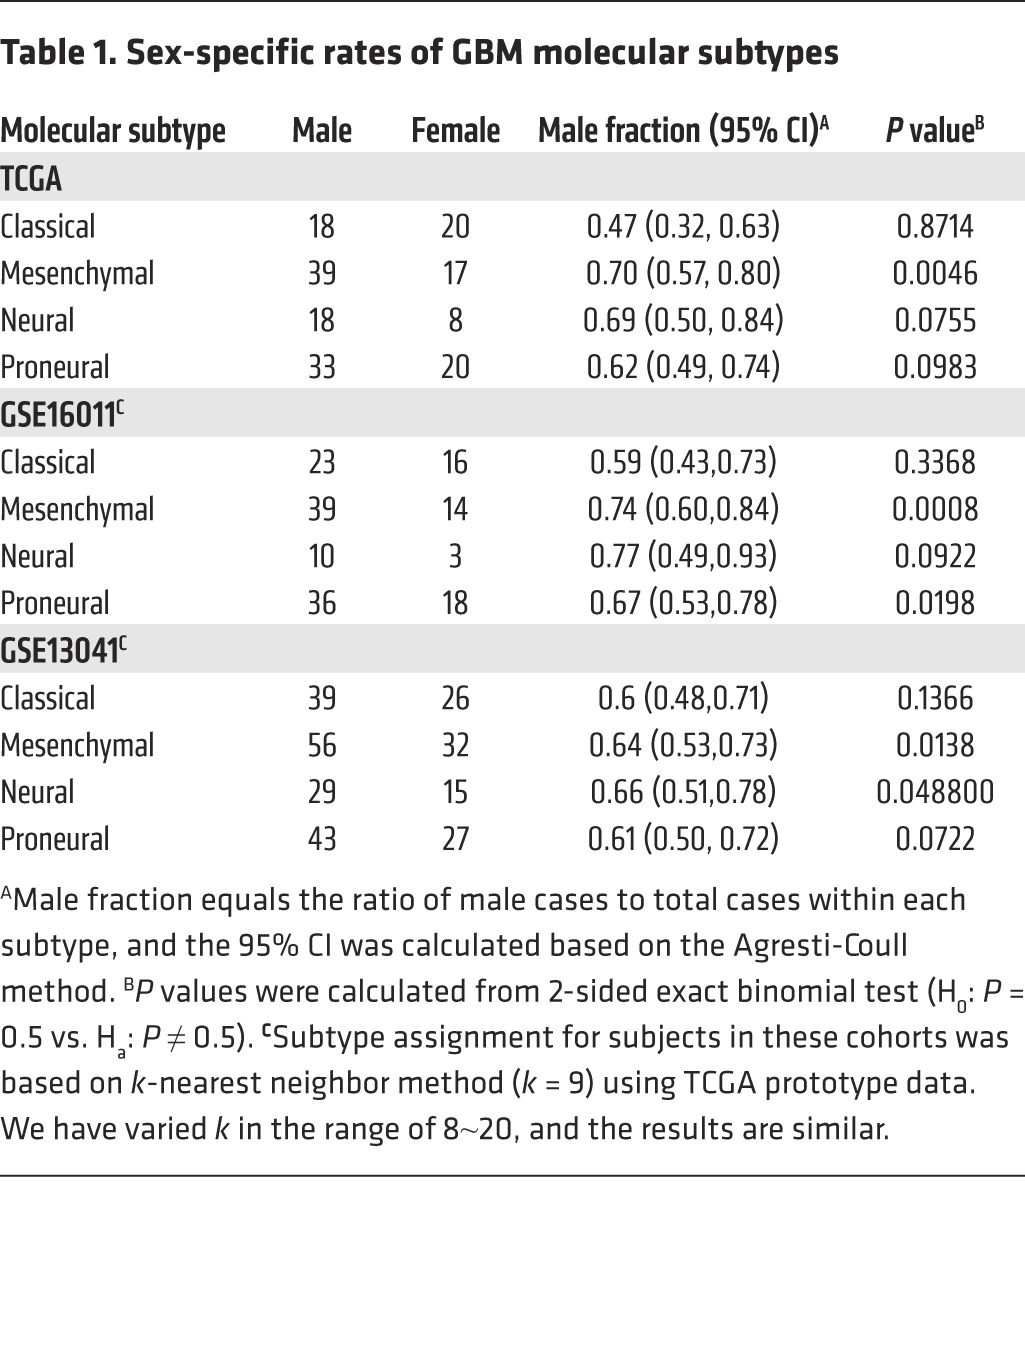
Based on their gene expression profiles, GBMs can be divided into classical, mesenchymal, neural, and proneural subtypes (8). The Cancer Genome Atlas (TCGA) data set, as originally reported by Verhaak et al. (8), indicates that mesenchymal and neural subtypes of GBM occur in at least twice as many men as women (Table 1). To determine whether similar sex differences are evident in other large GBM data sets, we developed methods for sex assignment based on the genetic signature of the sex chromosomes that could be applied to publically accessible gene expression profiling data, which frequently have incomplete or no sex information on the samples (Supplemental Figure 1; supplemental material available online with this article; doi:10.1172/JCI71048DS1). We examined 2 additional data sets (GSE16011, ref. 9, and GSE13041, ref. 10) containing 426 GBM specimens. Molecular subtypes were assigned using the k-nearest neighbor method (with consideration of varying k) based on the prototype data (8), and missing sex was inferred based on the genetic signature of sex chromosomes. We found that mesenchymal GBM (Mes-GBM) exhibited significant sex disparity in both data sets, with the overall rate of affected men greater than twice that of women. Also evident was a trend toward significantly different rates in both the neural and proneural subsets, but this was not evident in the classical GBM. These data suggest that the effect of sex in GBM is dependent on molecular subtype.
Table 1.
Sex-specific rates of GBM molecular subtypes
Sex-specific models of gliomagenesis.
Mes-GBM frequently exhibits loss of neurofibromin (NF1) and TP53 function (8). Moreover, in mouse models of disease, combined loss of Nf1 and p53 is sufficient for gliomagenesis (11), but with a male predominance (12). Thus, in both mice and humans, sex interacts with loss of NF1 and TP53 as a determinant of glioma, but the molecular basis for this effect of sex remains unexplained. To investigate whether the effect of sex on gliomagenesis is independent of the acute actions of sex hormones, we established male and female astrocyte cultures and examined their behavior upon stepwise loss of Nf1 and p53.
Male and female astrocytes were isolated from the neocortices of postnatal day 1 Nf1fl/fl GFAP-Cre mice (13, 14). The sex of resultant cultures was confirmed by expression of the X- and Y-encoded paralogs Jarid1c and Jarid1d (refs. 15, 16, and Figure 1A), and complete loss of NF1 expression was verified by Western blot (Figure 1B). Equal purity of male and female astrocyte cultures was established by their near uniform expression of astrocyte markers (GFAP and aldolase C) and the absence of neuronal (NF200) or oligodendrocyte (CNPase) marker expression (Figure 1C). Male and female Nf1–/– astrocytes were infected with retrovirus encoding a flag-tagged dominant-negative form of p53 (DNp53) and EGFP (DNp53-IRES-EGFP) (17). DNp53-expressing cells were purified by FACS based on EGFP expression (Figure 1D). Western blot analysis indicated that endogenous p53 and the flag-tagged DNp53 construct were similarly expressed in male and female astrocytes (Figure 1E). Equivalent loss of p53 function in male and female Nf1–/– DNp53 astrocytes was validated by the parallel reduction in expression of multiple transcriptional targets of p53, including Bai1, p21 (also known as Waf1 and Cip1), and Gadd45a (Figure 1F).
Figure 1. Preparation of male and female Nf1–/– DNp53 astrocytes.

(A) Sex determination of isolated mouse astrocytes by PCR for X- and Y-encoded paralogs Jarid1c and Jarid1d. Shown are results with genomic DNA isolated from adult mouse brain and from 3 independent litters of postnatal day 1 pups. (B) Western blot analysis of NF1 expression in male and female Nf1fl/fl, Nf1–/–, and Nf1–/– DNp53 astrocytes. Actin served as loading control. (C) Purity of astrocyte cultures was assessed by immunofluorescence detection of the astrocyte markers aldolase C (red) and GFAP (green) and the absence of neuronal (NF200) and oligodendrocyte (CNPase) marker expression. Nuclei were counterstained blue with DAPI. (D) Direct fluorescence microscopy of FACS-sorted cells indicated 100% EGFP expression in male and female Nf1–/– DNp53 astrocytes. (E) Western blot analysis indicated equal expression of endogenous p53 and the flag-tagged DNp53 construct (FLAG). Actin served as loading control. (F) PCR for p53 transcriptional targets Bai1, p21, and Gadd45a indicates equal loss of expression in Nf1–/– DNp53 astrocytes. ND, not detected; NS, not significant; M, male; F, female. Scale bar: 100 microns.
After establishing the astrocyte cultures, we first measured the effects of NF1 and p53 loss on growth in vitro. While male and female Nf1–/– astrocytes exhibited similar growth rates, the additional loss of p53 function led to a significantly greater increase in the growth of male astrocytes compared with female astrocytes (Figure 2A). These data indicate that sex may influence the functional consequences of tumor suppressor loss in a cell-intrinsic fashion.
Figure 2. Male predominant in vitro transformation of mouse astrocytes with inactivation of NF1 and p53.

(A) In vitro growth of male and female Nf1–/– astrocytes and Nf1–/– DNp53 astrocytes over 4 days. Shown are best fits of an exponential growth curve to all data points (***P = 0.0004, ANOVA). (B) EGF treatment (50 ng/ml) supported colony formation (asterisks) in soft agar with male but not female Nf1–/– DNp53 astrocytes. Scale bar: 200 μm.
Combined in vivo loss of Nf1 and p53 was shown to be sufficient for gliomagenesis in mice (11). To determine whether male and female Nf1–/– DNp53 astrocytes were transformed, we evaluated their anchorage-independent growth in soft agar colony formation assays and their tumorigenic potential in intracranial xenograft assays. Neither male nor female Nf1–/– DNp53 astrocytes formed colonies in soft agar (Figure 2B). Tissue analysis 3 months after intracranial implantation revealed that 2 of 7 mice with male Nf1–/– DNp53 astrocyte implants and 2 of 7 mice with female Nf1–/– DNp53 astrocyte implants had tumors (data not shown). Thus, in this model, sequential loss of NF1 and p53 function is only weakly transforming.
Next, we treated male and female Nf1–/– DNp53 astrocytes with PDGF or EGF. The PDGF and EGF pathways are frequently activated in GBM (8, 18–20). The PDGF receptor was equally expressed in male and female Nf1–/– DNp53 astrocytes, and treatment with PDGF was without sex-specific effects on ERK1/2 and AKT phosphorylation, soft agar colony formation, or intracranial tumorigenesis (Supplemental Figure 2).
The EGFR is amplified or mutationally activated in more than 50% of all GBM (21), and EGF can promote transformation in vitro (22). While EGFR mutational activation and amplification is most common in classical GBM, it also occurs in nearly 10% of Mes-GBM (8). Strikingly, EGF treatment resulted in the frequent formation of large (>100-μm diameter) colonies but only in male soft agar cultures (Figure 2B). The persistence of green fluorescence in male and female cells throughout the experiment indicated that the failure to transform female cells was not due to the loss of DNp53 expression. To determine whether the difference in transformation might be due to differences in EGFR expression or activation, we treated male and female Nf1–/– DNp53 astrocytes with EGF and measured EGF-induced activation of ERK1/2 and AKT by immunohistochemistry and Western blot. Male and female Nf1–/– DNp53 astrocytes possessed comparable levels of and similar cell-to-cell uniformity in EGFR expression and similar patterns of EGF-induced ERK and AKT phosphorylation (Supplemental Figure 3). Together, these data indicate that both male and female Nf1–/– DNp53 astrocytes are transformable but that they can possess different thresholds for in vitro transformation, particularly in response to growth factor stimulation.
To determine whether in vitro sexual dimorphism in transformation would translate to differences in in vivo tumorigenesis, we implanted male and female EGF-treated Nf1–/– DNp53 astrocytes into the brains of both male and female nude mice. In contrast to the minimal tumorigenic potential of untreated and PDGF-treated male and female Nf1–/– DNp53 astrocytes, 100% of recipient mice (14 of 14 male, 8 of 8 female) implanted with male EGF-treated Nf1–/– DNp53 cells developed tumors and succumbed to disease (Figure 3A). Strikingly, only 36% of recipient mice (5 of 14 male and 3 of 8 female) implanted with female EGF-treated Nf1–/– DNp53 cells developed tumors and died (P < 0.0001, log-rank test). Tumors were recognizable in situ by their EGFP fluorescence (Figure 3B), confirming persistent transgene (DNp53) expression. Pathological evaluation diagnosed the tumors as high-grade gliomas based on GFAP expression, nuclear atypia, mitoses, and necrosis (ref. 23 and Figure 3C). Notably, there were no histological distinctions between tumors derived from male and female cells (Supplemental Figure 4, A and B). The presence of viable EGFP-positive cells at the injection sites in brains of asymptomatic mice harboring female Nf1–/– DNp53 implants indicated that graft failure and loss of DNp53 expression were not reasons for the lack of tumor formation (Supplemental Figure 4, C and D).
Figure 3. Male predominant in vivo tumorigenesis occurs irrespective of recipient mouse sex.

(A) Intracranial implantation of EGF-treated male (n = 22) and female (n = 22) Nf1–/– DNp53 astrocytes from 3 independent litters resulted in death of 100% of mice receiving male cell implants and 36% of mice receiving female cell implants (***P < 0.0001, log-rank test). (B) Intracranial tumors were recognizable in situ by their EGFP expression (asterisk). (C) Intracranial tumors exhibited features of GBM, including nuclear pleomorphism and pseudopalisading necrosis (asterisk, top row), GFAP positivity, and abundant mitoses (asterisk, bottom row). Scale bar: 20 microns. (D) Male (black arrows) and female (white arrows) EGF-treated Nf1–/– DNp53 astrocytes were implanted into the flanks of male and female mice. Male cells gave rise to more tumors regardless of the recipient mouse sex. (E) Flank tumor volumes measured by calipers at 6 weeks. Each symbol represents an individual tumor. Mean volumes were significantly different (**P = 0.001, Wilcoxon rank test).
The in vivo results suggested that intracranial tumorigenesis was determined by the sex of the implanted cells and not by the sex of the recipient mouse. To directly test whether the sex of the microenvironment and circulating sex hormones influence tumorigenesis, we simultaneously implanted male and female EGF-treated Nf1–/– DNp53 astrocytes into the flanks of 8 male and 9 female NCR nude mice. Twelve of seventeen male implants (71%) formed tumors (Figure 3D) equally in male (5 of 8) and female (7 of 9) recipient mice (P = 0.62, Fisher’s exact test). Six of seventeen female implants (35%) formed tumors, again without difference between male (3 of 8) and female (3 of 9) recipient mice (P = 1, Fisher’s exact test). Moreover, male cells exhibited significantly greater maximal tumor growth (Figure 3E). Thus, in both the intracranial and flank locations, male EGF-treated Nf1–/– DNp53 astrocytes more readily formed tumors than their female counterparts, regardless of the sex of the surrounding tumor microenvironment. These data demonstrate that, in this model, sex-specific thresholds exist for transformation and that cell-intrinsic differences, rather than the sex of the microenvironment, are the stronger determinants of tumor growth.
Mechanisms of sexually dimorphic transformation.
To understand why male astrocytes may be more susceptible to malignant transformation, we first measured the clonogenic subpopulation. Loss of p53 function can enhance self-renewal and the reacquisition of a multipotent stem-like cell state (24), which may be essential for malignant transformation of differentiated cells (25). Clonogenic cell frequency, as measured by extreme limiting dilution assays (ELDA) (26), ranged from 6.1% to 17.6% in male Nf1–/– DNp53 astrocytes and 1.6% to 3.4% in female Nf1–/– DNp53 astrocytes (Figure 4, A and B). The greater stem-like cell frequency in male Nf1–/– DNp53 cells was associated with higher expression of stem cell markers CD133 and Sox2 (Figure 4C) as well as the capability of forming larger and greater numbers of neurospheres (Figure 4D).
Figure 4. Sex differences in induction of a stem-like cell subpopulation in Nf1–/– DNp53 astrocytes.

(A) Frequency of clonogenic (stem-like) cells was measured by ELDA in Nf1–/– DNp53 cells (3,000, 600, 120, 24, 5, and 1 cell per well; 10–12 replicates per dilution), with 3 independent astrocyte preparations. Shown is a representative ELDA analysis from one of the three cell preparations. CSC, clonogenic (stem-like) cell. (B) Male Nf1–/– DNp53 cells have a significantly higher stem-like cell frequency (12.2% ± 3.4%) than female (2.77% ± 0.6%) counterparts, as derived from the ELDA analysis (*P = 0.03, t test). (C) Sex differences in expression of stem cell markers CD133 and Sox2 (*P = 0.018 and **P = 0.03 for CD133 and Sox2 respectively, 2-tailed t test). (D) Representative images of neurospheres from male and female Nf1–/– DNp53 cells (3,000 cells per well) 1 week after plating. Scale bar: 500 microns. (E) The frequency of clonogenic stem-like cells, as determined by ELDA, was equal in male (2.49% ± 1.1%) and female (1.73% ± 0.63) Nf1–/– NSCs. (F) The frequency of clonogenic stem-like cells, as determined by ELDA, was equally low (0.2%) in both male and female Nf1–/– astrocytes.
Next, we asked whether sex differences in stem-like cell activity were a result of p53 inactivation or whether they preexisted as a consequence of Nf1 loss. The frequency of clonogenic cells in Nf1–/– postnatal day 1 hippocampal neural stem cells (NSCs) was approximately 2%, and no differences were observed between male and female cultures (Figure 4E). To determine whether sex differences might emerge with differentiation, we measured clonogenicity in Nf1–/– astrocytes. Both male and female Nf1–/– astrocytes possessed an equivalently low frequency (0.2%) of cells with clonogenic potential (Figure 4F). Thus, sex differences in clonogenic stem-like cell properties between male and female Nf1–/– DNp53 astrocyte cultures are a result of sexually dimorphic response to the loss of p53 function.
To further dissect the mechanistic basis for sex differences in transformation, we examined rates of apoptosis and proliferation in cultured male and female Nf1–/– DNp53 astrocytes. Apoptosis was measured by quantifying levels of cleaved caspase-3 under basal conditions and after etoposide treatment. While there was a trend toward greater basal and etoposide-induced apoptosis in male Nf1–/– DNp53 astrocytes, this did not reach statistical significance (Figure 5A). To measure proliferation, we quantified the percentage of nuclei positive for phospho-histone H3 (pHH3), a widely used proliferation marker in gliomas (27). We found that male Nf1–/– DNp53 astrocytes exhibited significantly higher levels of pHH3 positivity compared with female Nf1–/– DNp53 astrocytes (Figure 5B), indicating that they possess a higher rate of proliferation.
Figure 5. Sex differences in proliferation of Nf1–/– DNp53 astrocytes.

(A) Protein lysates of male and female Nf1–/– DNp53 astrocytes treated with DMSO or etoposide (10 μg/ml, 24 hours) were analyzed by Western blot for cleaved caspase-3 and total caspase-3. Actin served as loading control. A single representative blot and quantitation from the 3 independent experiments are shown. (B) Representative fields from cultures of male and female Nf1–/– DNp53 astrocytes stained with hematoxylin and for the presence of the nuclear proliferation marker pHH3 (brown). Blue arrowheads identify examples of nuclei negative for pHH3. Red arrowheads identify examples of nuclei positive for pHH3. Scale bar: 100 microns. Quantification of the percentage of positive nuclei is shown (*P < 0.05, t test). (C) Representative histograms from male and female Nf1–/– DNp53 astrocyte cell cycle analysis of asynchronously growing serum-supplemented cultures. Quantified areas for each phase of the cell cycle are as indicated. Means for cell cycle distribution from 3 independent cultures are shown.
Next, we performed cell cycle analysis. Under basal asynchronous conditions, the fraction of male Nf1–/– DNp53 astrocytes in the S and G2/M phases of the cell cycle was greater than in their female counterparts (Figure 5C). To understand why male Nf1–/– DNp53 astrocytes exhibited greater proliferation and S/G2/M cell cycle distribution, we examined regulation of the retinoblastoma protein (RB) pathway. The RB pathway is a negative regulator of proliferation, and RB loss or inactivation is among the most common features of human cancers (28). To assess RB regulation, we serum starved male and female Nf1–/– DNp53 astrocytes to promote arrest in the G1 phase of the cell cycle and then followed RB phosphorylation (inactivation) and cell cycle progression after adding serum back. Western blot analysis indicated that, under conditions of serum starvation, male and female Nf1–/– DNp53 astrocytes expressed comparable levels of RB and phosphorylated RB (Figure 6, A and B). Upon addition of serum, male Nf1–/– DNp53 astrocytes exhibited significantly greater time-dependent phosphorylation of RB compared with that of female astrocytes.
Figure 6. Sex differences in RB inactivation in Nf1–/– DNp53 astrocytes.

(A) Western blot analysis for RB and phospho-RB (p-RB) in protein lysates from cultures of male and female Nf1–/– DNp53 astrocytes serum starved for 48 hours (t = 0) and after addition of serum for the indicated times. Actin served as loading control. Shown are representative blots from 1 of 3 independent experiments. (B) Quantification of Western blot analysis of RB phosphorylation. Shown is the ratio of p-RB/RB as a function of time in serum (***P = 0.0001, ANOVA). (C) RB inactivation was mesured with an E2F-Luc reporter in 4 independent cultures of male and female Nf1–/– DNp53 astrocytes. For each measurement, bioluminescence was normalized to EGFP fluorescence, which was linearly related to cell number in both male and female astrocytes (inset). Male values were normalized to female values within each experiment (*P < 0.05, t test). (D) G1 fraction obtained from cell cycle analysis of male and female Nf1–/– DNp53 astrocytes cultured in serum or serum starved for 48 hours. Quantitation of 4 independent experiments is shown (*P = 0.028, t test).
RB regulates transition from the G1 to the S phase of the cell cycle through sequestration of E2F transcription factors. Hyperphosphorylation of RB or loss of RB expression results in increased E2F-dependent transcription and more rapid transit from G1 to S phase. To determine whether the differences in RB phosphorylation had functional consequences, we examined E2F-dependent transcription and cell cycle distribution in male and female Nf1–/– DNp53 astrocytes upon addition of sera. To measure E2F-dependent transcription, we constructed a lentiviral reporter system with 3XE2F-driven luciferase expression (Supplemental Figure 5) and established stable lines of male and female Nf1–/– DNp53 E2F-Luc reporter cells. Male and female Nf1–/– DNp53 E2F-Luc reporter cells were serum starved for 24 hours and then treated with 10% serum-supplemented media for 6 hours. As cell number was linearly related to EGFP fluorescence (Figure 6C, inset), we were able to normalize E2F-Luc reporter activity to EGFP measures. Consistent with the measured differences in RB phosphorylation, male Nf1–/– DNp53 astrocytes exhibited a greater level of E2F-Luc activity in response to serum (Figure 6C). As expected, sex differences in RB phosphorylation and E2F reporter activity were correlated with differences in cell cycle regulation. While serum starvation significantly increased the G1 fraction in female Nf1–/– DNp53 astrocytes, it produced no significant G1 change in male Nf1–/– DNp53 astrocytes, indicating that male cells possessed lower RB activity (Figure 6D). Together, these findings strongly indicate that RB regulation is sexually dimorphic in Nf1–/– DNp53 astrocytes and that the functional consequences of this include greater proliferation in male cells.
To test whether differential inactivation of RB underlies sex differences in transformation, we expressed SV40 large T antigen (SV40-TAg) in male and female Nf1–/– astrocytes (29). SV40-TAg completely inactivates both p53 and RB pathways (reviewed in ref. 30). Quantitative PCR verified equal SV40-TAg expression and equivalent reductions in expression of p53 transcriptional targets p21 and Gadd45a and expected increases and decreases in expression of E2F targets Cdc6 (31) and Bcl2 (32), respectively (Figure 7A). In soft agar assays, we found that, in contrast to EGF-treated Nf1–/– DNp53 astrocytes, both male and female Nf1–/– SV40-TAg astrocytes were competent to form colonies (Figure 7B). Moreover, both male and female Nf1–/– SV40-TAg astrocytes formed tumors of similar sizes upon flank implantation (Figure 7C), regardless of the sex of recipient mice. These data indicate that under conditions of equivalent combined loss of p53 and RB function, male and female astrocytes are equally transformed.
Figure 7. Male and female astrocytes are equally transformed upon inactivation of both p53 and RB by SV40-TAg.

(A) Quantitative PCR for SV40-TAg, the p53 transcriptional targets p21 and Gadd45a, and the E2F targets Cdc6 and Bcl2. (B) Representative images from tumorsphere cultures of male and female Nf1–/– SV40-TAg astrocytes. Scale bar: 200 microns. (C) Male and female Nf1–/– SV40-TAg astrocytes yielded equal numbers of equivalently sized tumors upon flank implantation. Each symbol represents an individual tumor.
Discussion
Sex differences in the incidence and progression of human disease are increasingly recognized as clinically significant and mechanistically important. While the acute actions of sex hormones are recognized as critical determinants of many aspects of normal biology and pathology, here we provide the first evidence that cell-intrinsic sex differences can render male and female cells differentially sensitive to malignant transformation. Among the immediate implications of this work is that the potential for sex-specific effects should be considered when evaluating oncogenic mechanisms. This approach is likely to illuminate new details of cancer cell biology and could modify our approach to cancer surveillance, disease stratification, and treatment.
Male, but not female, astrocytes with complete loss of NF1 and p53 function were poised for transformation by activation of growth factor pathways. Differences in transformation were related to a greater susceptibility for RB inactivation and increased induction of a stem-like cell phenotype in male astrocytes compared with female astrocytes. The equal transformation of male and female astrocytes in the setting of complete RB and p53 inactivation, as well as the equal incidence of classical GBM in males and females, indicate that sex differences in GBM and other cancers may be confined to specific subsets of disease.
Loss of NF1 and p53 function resulted in a greater rate of growth and a significant elevation in the fraction of clonogenic cells in male astrocytes compared with female astrocytes. Both effects can be related to the observation that male Nf1–/– DNp53 astrocytes exhibited greater inactivation of RB. A focus on RB as the mediator of sex differences in transformation in this model is supported by contrasting the effects of p53 loss alone (DNp53) to those after combined loss of p53 and RB (SV40-TAg). When p53 function was abrogated but RB was left intact, significant sex differences were apparent in 4 measures: (a) RB inactivation in response to serum, (b) proliferation rates, (c) stem cell induction, and (d) transformation in response to EGF. When RB and p53 were completely inactivated there was no sex difference in in vitro transformation or tumorigenicity in vivo. These observations strongly suggest that sexual dimorphism in the regulation of RB function can contribute to sex differences in cancer. It is interesting to note that the incidence of retinoblastoma, in which there is complete inactivation of RB, is equal between males and females (33). It is similarly interesting to consider the frequent deletion of CDKN2A in classical GBM (8) and whether this potent mechanism of RB inactivation is related to the equal incidence of classical GBM in males and females.
Differential RB inactivation may also underlie the observed differences in clonogenic cell activity. While RB’s role in regulating cell cycle progression has been known for decades (34), its role in stem cell function has only been recognized recently. Loss of RB function in stem and progenitor cell populations results in multiple cell autonomous abnormalities, including loss of quiescence, hyperplasia, increased apoptosis, defective terminal differentiation, and tumorigenesis (for review ref. 35).
Future studies will need to address whether cell-intrinsic sex differences in transformation will be equally apparent in models involving alternate cells of origin, different transformation paradigms, and in different mouse strains. Mounting evidence indicates that GBM can arise from NSCs, oligodendrocyte progenitors, and differentiated glial and neuronal cells (25, 36, 37). It will be important to determine whether each potential cell of origin exhibits similar sex differences and, if not, to investigate the mechanisms through which sex and cell type interact.
Similar to what we observed with untreated Nf1–/– DNp53 astrocytes, Zhu et al. found that loss of NF1 followed by loss of p53 function did not result in tumorigenesis (11). However, when p53 function was abrogated prior to deletion of Nf1, high-grade gliomagenesis ensued in 100% of mice without apparent sex disparity. It would be interesting to determine whether additional tumor-promoting events, like activation of the EGFR pathway, would reveal sex differences in tumorigenesis in mice with inactivation of NF1 and p53 function under various conditions.
High-grade gliomagenesis in the setting of combined NF1 and p53 loss has also been modeled in NPcis mice, which carry a genetic construct of tightly linked mutant alleles of NF1 and p53 (38). Similar to our results, when NPcis mice were maintained on a C57BL/6J background, high-grade gliomas occurred with a male predominance (12, 39, 40). Importantly, 129S4/SvJae mice were highly resistant to the gliomagenic effects of NPcis mutations. While modifier loci for the strain- and sex-specific effects have been mapped, the mechanisms by which they modify gliomagenesis have not been defined. It will be important to determine whether there are similar strain effects in our model as well as whether any of the loci involved in the effects of sex encode components of the RB pathway.
Finally, while the current data extend our understanding of how cell-intrinsic sexual dimorphism can contribute to sex differences in cancer, they do not diminish the potential role of sex hormones in oncogenesis, cancer progression, and response to therapy. Thus, future studies, particularly those involving models, such as the 4-core genotypes model of sex differences, will be especially important for illuminating the contributions of both chromosomal and gonadal sex to cancer biology (41).
Methods
Chemicals, media, and sera
Unless otherwise stated, all chemicals were purchased from Sigma-Aldrich, and all tissue culture media was obtained from Invitrogen.
Sex determination in publically accessible gene expression data sets
Detailed methods for sex determination in gene expression data sets are provided in the legend to Supplemental Figure 1.
Male and female astrocyte cultures
Primary cultures of astrocytes were prepared from the neocortices of individual postnatal day 1 Nf1fl/fl GFAP-Cre mice and cultured in DMEM/F12 supplemented with 10% FBS as previously described (14, 42). Nf1fl/fl GFAP-Cre mice were a gift from David Gutmann (Washington University School of Medicine). The sex of each mouse was determined from tail DNA by PCR for Jarid1c and Jarid1d (15, 16). All male and female cells from at least a single litter with the same genotype were pooled. Replicate experiments were performed using low-passage (≤6) astrocytes isolated from at least 3 independent litters. Purity of astrocyte cultures was determined by immunolabeling for specific markers for astrocytes (GFAP [1:250, Invitrogen] and aldolase C [1:200, Santa Cruz]), neurons (NF200 [1:250, Sigma-Aldrich]), and oligodendrocytes (CNPase [1:500, Sigma-Aldrich]). Immunolabeling was detected with Alexa Fluor 555– or 488–conjugated secondary antibodies (Molecular Probes). Nuclei were counterstained with DAPI (1:10,000). Fluorescent images were obtained using an inverted fluorescent microscope (IX51, Olympus).
Isolation of Nf1–/– NSCs
Nf1–/– NSCs were isolated from the hippocampi of Nf1fl/fl GFAP-Cre postnatal day 1 pups.
Briefly, the hippocampus was dissected out of whole brain and incubated in digest media for 10 minutes at 37°C as previously described (43). Cells from each hippocampus were maintained separately in neurosphere media (neurobasal medium supplemented with N2, B27, EGF, bFGF, and LIF) until the sex of the pups was identified by PCR. Single cell suspensions were prepared with trituration and passed through a 40-μm cell strainer.
Expression of DNp53 and SV40-TAg in Nf1–/– astrocytes
DNp53-IRES-EGFP–encoding retrovirus was generated by transfecting Plat-E cells (gift from Steven Teitelbaum, Washington University School of Medicine) with a pMIG-DNp53-EGFP construct provided by Emily Cheng (Memorial Sloan-Kettering Cancer Center, New York, New York, USA). The resultant viral media were used to infect male and female Nf1–/– astrocytes with polybrene (5 μg/ml). Nf1–/– DNp53-EGFP–positive cells were sorted to purity using a MoFlo high speed flow cytometer (Beckman Coulter). SV40-TAg retrovirus was similarly generated using pBabe-Neo-SV40-TAg plasmid provided by Sheila Stewart (Washington University School of Medicine). After infection, the Nf1–/– SV40-TAg astrocytes were selected by G418 (250 μg/ml) containing media for 4 weeks. SV40-TAg expression was confirmed by quantitative RT-PCR in resultant G418-resistant clones.
Growth assays
Nf1–/– or Nf1–/– DNp53 astrocytes were grown in 6-well plates (20,000 cells per well).
Viable cell numbers were measured every 24 hours by Trypan Blue exclusion (final concentration 0.1%) using a Cellometer Auto T4 cell counter (Nexcelom Bioscience) with triplicate wells per time point per sex.
Soft agar assays
Colony formation assays were performed in soft agar plates as described previously (29). Briefly, 0.6% Difco Noble Agar (BD Bioscience) in DMEM/F12 media with 10% FBS was plated on the bottom layer and 0.3% agar was plated on the top layer, which contained astrocytes. In some experiments, astrocytes were treated with EGF (50 ng/ml, Sigma-Aldrich) or PDGF-BB (20 ng/ml, Sigma-Aldrich) for a week prior to the assays. EGF or PDGF was also added to the soft agar when cells were plated, and colony formation was evaluated 3 to 4 weeks later based on EGFP expression.
Limiting dilution assays
Male and female Nf1–/– NSCs, Nf1–/– astrocytes, and Nf1–/– DNp53 astrocytes were diluted to various densities (3,000, 600, 120, 24, 5, and 1 cell per well) in neurosphere media and plated in 96-well ultralow cluster plates (Corning), with 10 to 12 wells per concentration. Sphere formation was measured 7 days after plating. Clonogenic stem-like cell frequency was analyzed using the Extreme Limiting Dilution Analysis (http://bioinf.wehi.edu.au/software/elda/).
Tumorigenesis assays
Nf1–/– DNp53 astrocytes treated with 50 ng/ml EGF were implanted either into the brains or flanks of nude mice.
For intracranial implantations, 100,000 cells were stereotactically implanted to the cerebral cortices of nude mice as described previously (44). Mice with intracranial tumors were sacrificed when symptomatic. For flank implantations, 1 million male or female Nf1–/– DNp53 cells in 50 μl Matrigel (BD Bioscience) were implanted in the left or right flank, respectively, of the same mouse. Flank tumors were measured weekly with a digital caliper.
Cell cycle analysis.
Ethanol-fixed cells were washed in PBS plus 0.1% FBS and resuspended in propidium iodide–staining (PI-staining) solution containing 0.1% Triton X-100, 0.25 mg/ml DNase- and protease-free RNase A, and 10 μg/ml PI in PBS. Cells were incubated for 1 hour at room temperature in the dark and filtered through a 35-micron cell strainer. Flow cytometry was done on a FACSCalibur system (Becton Dickinson). Data were analyzed using CellQuest software (Becton Dickinson). Aggregates and debris were excluded from the analysis.
Quantitative real-time PCR
Quantitative PCR assays were performed using SYBR Green 2x PCR Master Mix (Applied Biosystems). cDNA was generated from total RNA with SuperScript III Reverse Transcriptase (Invitrogen) per the manufacturer’s instructions. PCR and data collection were done using the Bio-Rad MiniOpticon Real-Time PCR machine and Opticon Monitor 3 software from Bio-Rad (Hercules). Relative transcript copy number for each gene and corresponding GAPDH sample were calculated using the ΔΔC(t) method. PCR primers used in these studies are listed in Supplemental Table 1.
Western blotting
Western blots were performed using the Odyssey Infrared Imaging system (LI-COR) as previously described (45). Total protein (30~50 μg per lane) was loaded onto a 4% to 12% Nu-Page gradient gel (Invitrogen) for most experiments, except for the detection of NF1 (150 μg total protein per lane). Primary antibodies were incubated at 4°C overnight, except for mouse anti–β actin (1:40,000, Sigma-Aldrich), which was incubated at room temperature for 1 hour. Secondary antibody incubation was at room temperature for 1 hour. Primary antibodies used in this study were rabbit anti-NF1 (1:200, Santa Cruz), goat anti-p53 (1:500, Santa Cruz), mouse anti-FLAG (1:1,000, Sigma-Aldrich).
For evaluation of EGF and PDGF signaling pathways, male and female Nf1–/– DNp53 astrocytes were serum starved for 24 hours and then treated with EGF (50 ng/ml) or PDGF-BB (20 ng/ml) for the indicated times. Western blots were performed as described above using antibodies from Cell Signaling Technology (CST): rabbit anti-EGFR (1:500), rabbit anti-PDGFR β (1:1,000), rabbit anti-pAKT (1:500), pERK1/2 (1:1,000), mouse anti-pan AKT (1:500), and pan ERK1/2 (1:1,000).
For evaluation of RB phosphorylation, male and female Nf1–/– DNp53 astrocytes were serum starved for 48 hours and then treated with 10% serum-supplemented media for the indicated times. Western blots were performed as described above with the following antibodies from CST: rabbit anti-RB (1:800) and rabbit anti-phosphorylated RB (S807/811, 1:1,000).
Immunohistochemistry
Tissue.
Mouse brains were perfused with PBS followed by 4% paraformaldehyde. After paraffin embedding, tissue was sectioned for standard hematoxylin and eosin and immunohistochemical staining as previously described (45).
Cell culture.
Male and female Nf1–/– DNp53 cells were grown on coverslips for 48 hours, followed by 24-hour serum starvation before EGF (50 ng/ml) treatment. Cells were fixed with 4% paraformaldehyde for 15 minutes and permeabilized with 0.1% Triton-X 100 for 30 minutes at room temperature, and nonspecific antibody staining was blocked with normal serum. Immunodetection was performed as previously described with antibodies specific for phospho-ERK1/2 (rabbit IgG 1:500, CST) and EGFR (rabbit IgG 1:50, CST). Nonspecific rabbit IgG control served as control.
pHH3 staining
Cell proliferation was measured by pHH3 (Ser10) immunolabeling. Male and female Nf1–/– DNp53 astrocytes were cultured for 48 hours on coverslips precoated by Poly-l-Lysine and Poly-Ornithine (Sigma-Aldrich). Cells were prepared for immunolabeling, and immunohistochemistry was performed following standard procedures using rabbit anti-pHH3 (CST; 1:500 with 1% BSA and biotin). After DAB development, coverslips were rinsed with PBST and mounted in Immuno Mount (GeneTex). Cells with positive pHH3 staining were counted by ImageJ. Final results were obtained from >1,000 cells per sex derived from 3 independent litters.
Etoposide-induced caspase-3 cleavage
Cleaved caspase-3, measured by Western blot, was used as an indicator for apoptosis. Male and female Nf1–/– DNp53 astrocytes were treated with either DMSO or etoposide (10 μg/ml) for 24 hours, and cell lysates were harvested for Western blotting. Intact and cleaved caspase-3 were detected with rabbit anti–caspase-3 (1:600, CST) and anti-cleaved caspase-3 (1:400, CST).
E2F-Luc reporter assay
To construct the lentiviral E2F-Luc reporter system, we first inserted 3XE2F binding sites (46), provided by Wilhelm Krek (ETH Zurich) and Hans Rotheneder (Medical University of Vienna, Vienna, Austria), into the pGL4.26 (Promega) reporter construct. The DNA fragment encoding 3XE2F-Luc (including the upstream poly-A signal) and the SV40 promoter-hygromycin resistance gene (including the downstream poly-A sequence [HygR]) were amplified by PCR using primers with 5′-NdeI and 3′-EcoRI linkers. Subsequently, a fragment encoding the CMV promoter-GFP cassette of the pRRLsinCMV-GFP vector (47) was removed by NdeI and EcoRI digestion and replaced with the 3XE2F-Luc SV40-HygR encoding PCR product. E2F-Luc lentivirus was prepared from the final pRRLsin-E2F-Luc by cotransfecting 293T cells with both pRRLsin-E2F-Luc construct and the packing plasmids (Delta8.9 and VSV-G) as described previously (48). Viral media were collected 48 hours after 293T transfection, and media were centrifuged, followed by filtering through a 0.44-μm filter, before infecting Nf1–/– DNp53 astrocytes. Stable male and female E2F-Luc–expressing Nf1–/– DNp53 astrocytes were established by hygromycin (250 μg/ml) selection for 3~4 weeks.
A linear correlation between EGFP expression and cell number was established by serial dilution of reporter astrocytes from 3 independent litters (4 replicate wells per concentration per sex per preparation) in a 96-well plate with white walls (Costar). EGFP signals were read 3 hours after plating using a Synergy Neo HTS Multi-Mode microplate reader (Biotek), and EGFP signals were plotted against actual cell number.
E2F reporter activity was measured in male and female Nf1–/– DNp53 E2F-Luc astrocytes that had been serum starved for 24 hours and then stimulated or not with 10% FBS in phenol red–free DMEM/F12 for 6 hours. At 6 hours after serum treatment, total EGFP fluorescence per well was measured as described above. Total luciferase activity was measured using the One-Glo Luciferase Assay System (Promega) according to the manufacturer’s guidelines. Total luciferase activity was normalized to total EGFP fluorescence. For each treatment condition, 4 replicate wells per sex per preparation were read, and the final results were from 4 independent biological replicates of male and female reporter astrocyte cultures.
Statistics
Student’s t test was used to compare quantitative measurements between 2 groups. ANOVA was used to analyze differences in in vitro longitudinal growth and RB phosphorylation between sexes. Tumor formation by sex was compared by Fisher’s exact test. Sex-dependent differences in flank tumor size were evaluated with Wilcoxon rank test. Log-rank test was used to determine sex differences in survival between mouse groups with intracranial implantation of either male or female Nf1–/– DNp53 cells. All tests were 2 sided, and a P value of less than 0.05 was considered significant. All quantitative data are presented as the mean and SEM of 3 independent experiments, using astrocytes derived from at least 3 independent litters of mice. Data were analyzed using GraphPad Prism version 4.00 (GraphPad Software) and R version 2.15.2 (http://cran.r-project.org).
Study approval
Animals were used in accordance with an animal studies protocol (no. 20120174) approved by the Animal Studies Committee of the Washington University School of Medicine per the recommendations of the Guide for the Care and Use of Laboratory Animals (NIH).
Supplementary Material
Acknowledgments
The authors thank Jason Weber (Washington University School of Medicine) for critical suggestions regarding manuscript preparation, the Hope Center Viral Vectors Core for providing the pRRLsinCMV-GFP vector, and the Alvin J. Siteman Cancer Center at Washington University School of Medicine and Barnes-Jewish Hospital in St. Louis, Missouri, USA, for the cell-sorting service provided by the Siteman Flow Cytometry Core. The Hope Center Viral Vectors Core is supported by a Neuroscience Blueprint Core grant (P30 NS057105) from the NIH to Washington University, and The Siteman Cancer Center is supported in part by NCI Cancer Center Support Grant P30 CA91842. This work was supported by NIH R01 CA136573 and NIH R01 CA174737 (to J.B. Rubin) and the Children’s Tumor Foundation Young Investigator Award 2012-01-036 (to T. Sun).
Footnotes
Conflict of interest: The authors have declared that no conflict of interest exists.
Reference information:J Clin Invest. 2014;124(9):4123–4133. doi:10.1172/JCI71048.
References
- 1.Ober C, Loisel DA, Gilad Y. Sex-specific genetic architecture of human disease. Nat Rev Genet. 2008;9(12):911–922. doi: 10.1038/nrg2415. [DOI] [PMC free article] [PubMed] [Google Scholar]
- 2.Sun T, Warrington NM, Rubin JB. Why does Jack, and not Jill, break his crown? Sex disparity in brain tumors. Biol Sex Differ. 2012;3:3. doi: 10.1186/2042-6410-3-3. [DOI] [PMC free article] [PubMed] [Google Scholar]
- 3.Kool M, et al. Molecular subgroups of medulloblastoma: an international meta-analysis of transcriptome, genetic aberrations, and clinical data of WNT, SHH, Group 3, and Group 4 medulloblastomas. Acta Neuropathol. 2012;123(4):473–484. doi: 10.1007/s00401-012-0958-8. [DOI] [PMC free article] [PubMed] [Google Scholar]
- 4.Taylor MD, et al. Molecular subgroups of medulloblastoma: the current consensus. Acta Neuropathol. 2012;123(4):465–472. doi: 10.1007/s00401-011-0922-z. [DOI] [PMC free article] [PubMed] [Google Scholar]
- 5.Dubrow R, Darefsky AS. Demographic variation in incidence of adult glioma by subtype, United States, 1992–2007. BMC Cancer. 2011;11:325. doi: 10.1186/1471-2407-11-325. [DOI] [PMC free article] [PubMed] [Google Scholar]
- 6.Stupp R, et al. Radiotherapy plus concomitant and adjuvant temozolomide for glioblastoma. N Engl J Med. 2005;352(10):987–996. doi: 10.1056/NEJMoa043330. [DOI] [PubMed] [Google Scholar]
- 7. Central Brain Tumor Registry of the United States. CBTRUS Statistical Report: Primary Brain and Central Nervous System Tumors Diagnosed in the United States in 2004–2006. Hinsdale, Illinois, USA: CBTRUS; 2010. [Google Scholar]
- 8.Verhaak RG, et al. Integrated genomic analysis identifies clinically relevant subtypes of glioblastoma characterized by abnormalities in PDGFRA, IDH1, EGFR, and NF1. Cancer Cell. 2010;17(1):98–110. doi: 10.1016/j.ccr.2009.12.020. [DOI] [PMC free article] [PubMed] [Google Scholar]
- 9.Gravendeel LA, et al. Intrinsic gene expression profiles of gliomas are a better predictor of survival than histology. Cancer Res. 2009;69(23):9065–9072. doi: 10.1158/0008-5472.CAN-09-2307. [DOI] [PubMed] [Google Scholar]
- 10.Phillips HS, et al. Molecular subclasses of high-grade glioma predict prognosis, delineate a pattern of disease progression, and resemble stages in neurogenesis. Cancer Cell. 2006;9(3):157–173. doi: 10.1016/j.ccr.2006.02.019. [DOI] [PubMed] [Google Scholar]
- 11.Zhu Y, et al. Early inactivation of p53 tumor suppressor gene cooperating with NF1 loss induces malignant astrocytoma. Cancer Cell. 2005;8(2):119–130. doi: 10.1016/j.ccr.2005.07.004. [DOI] [PMC free article] [PubMed] [Google Scholar]
- 12.Walrath JC, Fox K, Truffer E, Gregory Alvord W, Quinones OA, Reilly KM. Chr 19(A/J) modifies tumor resistance in a sex- and parent-of-origin-specific manner. Mamm Genome. 2009;20(4):214–223. doi: 10.1007/s00335-009-9179-4. [DOI] [PMC free article] [PubMed] [Google Scholar]
- 13.Bajenaru ML, Zhu Y, Hedrick NM, Donahoe J, Parada LF, Gutmann DH. Astrocyte-specific inactivation of the neurofibromatosis 1 gene (NF1) is insufficient for astrocytoma formation. Mol Cell Biol. 2002;22(14):5100–5113. doi: 10.1128/MCB.22.14.5100-5113.2002. [DOI] [PMC free article] [PubMed] [Google Scholar]
- 14.Warrington NM, et al. Spatiotemporal differences in CXCL12 expression and cyclic AMP underlie the unique pattern of optic glioma growth in neurofibromatosis type 1. Cancer Res. 2007;67(18):8588–8595. doi: 10.1158/0008-5472.CAN-06-2220. [DOI] [PubMed] [Google Scholar]
- 15.Xu J, Deng X, Disteche CM. Sex-specific expression of the X-linked histone demethylase gene Jarid1c in brain. PLoS One. 2008;3(7):e2553. doi: 10.1371/journal.pone.0002553. [DOI] [PMC free article] [PubMed] [Google Scholar]
- 16.Clapcote SJ, Roder JC. Simplex PCR assay for sex determination in mice. Biotechniques. 2005;38(5):702, 704, 706. doi: 10.2144/05385BM05. [DOI] [PubMed] [Google Scholar]
- 17.Tu HC, et al. The p53-cathepsin axis cooperates with ROS to activate programmed necrotic death upon DNA damage. Proc Natl Acad Sci U S A. 2009;106(4):1093–1098. doi: 10.1073/pnas.0808173106. [DOI] [PMC free article] [PubMed] [Google Scholar]
- 18.Gan HK, Kaye AH, Luwor RB. The EGFRvIII variant in glioblastoma multiforme. J Clin Neurosci. 2009;16(6):748–754. doi: 10.1016/j.jocn.2008.12.005. [DOI] [PubMed] [Google Scholar]
- 19.Liu KW, Hu B, Cheng SY. Platelet-derived growth factor receptor alpha in glioma: a bad seed. Chin J Cancer. 2011;30(9):590–602. doi: 10.5732/cjc.011.10236. [DOI] [PMC free article] [PubMed] [Google Scholar]
- 20.Szerlip NJ, et al. Intratumoral heterogeneity of receptor tyrosine kinases EGFR and PDGFRA amplification in glioblastoma defines subpopulations with distinct growth factor response. Proc Natl Acad Sci U S A. 2012;109(8):3041–3046. doi: 10.1073/pnas.1114033109. [DOI] [PMC free article] [PubMed] [Google Scholar]
- 21.Zhu H, et al. Oncogenic EGFR signaling cooperates with loss of tumor suppressor gene functions in gliomagenesis. Proc Natl Acad Sci U S A. 2009;106(8):2712–2716. doi: 10.1073/pnas.0813314106. [DOI] [PMC free article] [PubMed] [Google Scholar]
- 22.Bogler O, Nagane M, Gillis J, Huang HJ, Cavenee WK. Malignant transformation of p53-deficient astrocytes is modulated by environmental cues in vitro. Cell Growth Differ. 1999;10(2):73–86. [PubMed] [Google Scholar]
- 23. Kleihues P, et al. Glioblastoma. In: Louis DN, Ohgaki H, Wiestler OD, Cavenee WK, eds. World Health Organization Classification Of Tumours: Pathology And Genetics Of Tumours Of The Central Nervous System. Lyon, France: IARC Press; 2007:33–49. [Google Scholar]
- 24.Kawamura T, et al. Linking the p53 tumour suppressor pathway to somatic cell reprogramming. Nature. 2009;460(7259):1140–1144. doi: 10.1038/nature08311. [DOI] [PMC free article] [PubMed] [Google Scholar]
- 25.Friedmann-Morvinski D, et al. Dedifferentiation of neurons and astrocytes by oncogenes can induce gliomas in mice. Science. 2012;338(6110):1080–1084. doi: 10.1126/science.1226929. [DOI] [PMC free article] [PubMed] [Google Scholar]
- 26.Hu Y, Smyth GK. ELDA: extreme limiting dilution analysis for comparing depleted and enriched populations in stem cell and other assays. J Immunol Methods. 2009;347(1–2):70–78. doi: 10.1016/j.jim.2009.06.008. [DOI] [PubMed] [Google Scholar]
- 27.Colman H, et al. Assessment and prognostic significance of mitotic index using the mitosis marker phospho-histone H3 in low and intermediate-grade infiltrating astrocytomas. Am J Surg Pathol. 2006;30(5):657–664. doi: 10.1097/01.pas.0000202048.28203.25. [DOI] [PubMed] [Google Scholar]
- 28.Cobrinik D. Pocket proteins and cell cycle control. Oncogene. 2005;24(17):2796–2809. doi: 10.1038/sj.onc.1208619. [DOI] [PubMed] [Google Scholar]
- 29.Lundberg AS, et al. Immortalization and transformation of primary human airway epithelial cells by gene transfer. Oncogene. 2002;21(29):4577–4586. doi: 10.1038/sj.onc.1205550. [DOI] [PubMed] [Google Scholar]
- 30.Ahuja D, Saenz-Robles MT, Pipas JM. SV40 large T antigen targets multiple cellular pathways to elicit cellular transformation. Oncogene. 2005;24(52):7729–7745. doi: 10.1038/sj.onc.1209046. [DOI] [PubMed] [Google Scholar]
- 31.Rathi AV, Saenz Robles MT, Cantalupo PG, Whitehead RH, Pipas JM. Simian virus 40 T-antigen-mediated gene regulation in enterocytes is controlled primarily by the Rb-E2F pathway. J Virol. 2009;83(18):9521–9531. doi: 10.1128/JVI.00583-09. [DOI] [PMC free article] [PubMed] [Google Scholar]
- 32.Eischen CM, et al. Bcl-2 is an apoptotic target suppressed by both c-Myc and E2F-1. Oncogene. 2001;20(48):6983–6993. doi: 10.1038/sj.onc.1204892. [DOI] [PubMed] [Google Scholar]
- 33.Broaddus E, Topham A, Singh AD. Survival with retinoblastoma in the USA: 1975–2004. Br J Ophthalmol. 2009;93(1):24–27. doi: 10.1136/bjo.2008.143842. [DOI] [PubMed] [Google Scholar]
- 34.Hatakeyama M, Weinberg RA. The role of RB in cell cycle control. Prog Cell Cycle Res. 1995;1:9–19. doi: 10.1007/978-1-4615-1809-9_2. [DOI] [PubMed] [Google Scholar]
- 35.Sage J. The retinoblastoma tumor suppressor and stem cell biology. Genes Dev. 2012;26(13):1409–1420. doi: 10.1101/gad.193730.112. [DOI] [PMC free article] [PubMed] [Google Scholar]
- 36.Martino TA, Tata N, Bjarnason GA, Straume M, Sole MJ. Diurnal protein expression in blood revealed by high throughput mass spectrometry proteomics and implications for translational medicine and body time of day. Am J Physiol Regul Integr Comp Physiol. 2007;293(3):R1430–R1437. doi: 10.1152/ajpregu.00183.2007. [DOI] [PubMed] [Google Scholar]
- 37.Liu C, et al. Mosaic analysis with double markers reveals tumor cell of origin in glioma. Cell. 2011;146(2):209–221. doi: 10.1016/j.cell.2011.06.014. [DOI] [PMC free article] [PubMed] [Google Scholar]
- 38.Reilly KM, Loisel DA, Bronson RT, McLaughlin ME, Jacks T. Nf1;Trp53 mutant mice develop glioblastoma with evidence of strain-specific effects. Nat Genet. 2000;26(1):109–113. doi: 10.1038/79075. [DOI] [PubMed] [Google Scholar]
- 39.Amlin-Van Schaick JC, Kim S, DiFabio C, Lee MH, Broman KW, Reilly KM. Arlm1 is a male-specific modifier of astrocytoma resistance on mouse Chr 12. Neuro Oncol. 2012;14(2):160–174. doi: 10.1093/neuonc/nor206. [DOI] [PMC free article] [PubMed] [Google Scholar]
- 40.Reilly KM, et al. Susceptibility to astrocytoma in mice mutant for Nf1 and Trp53 is linked to chromosome 11 and subject to epigenetic effects. Proc Natl Acad Sci U S A. 2004;101(35):13008–13013. doi: 10.1073/pnas.0401236101. [DOI] [PMC free article] [PubMed] [Google Scholar]
- 41.Arnold AP, Chen X. What does the “four core genotypes” mouse model tell us about sex differences in the brain and other tissues? Front Neuroendocrinol. 2009;30(1):1–9. doi: 10.1016/j.yfrne.2008.11.001. [DOI] [PMC free article] [PubMed] [Google Scholar]
- 42.Warrington NM, et al. Cyclic AMP suppression is sufficient to induce gliomagenesis in a mouse model of Neurofibromatosis-1. Cancer Res. 2010;70(14):5717–5727. doi: 10.1158/0008-5472.CAN-09-3769. [DOI] [PMC free article] [PubMed] [Google Scholar]
- 43.Dasgupta B, Gutmann DH. Neurofibromin regulates neural stem cell proliferation, survival, and astroglial differentiation in vitro and in vivo. J Neurosci. 2005;25(23):5584–5594. doi: 10.1523/JNEUROSCI.4693-04.2005. [DOI] [PMC free article] [PubMed] [Google Scholar]
- 44.Yang L, Jackson E, Woerner BM, Perry A, Piwnica-Worms D, Rubin JB. Blocking CXCR4-mediated cyclic AMP suppression inhibits brain tumor growth in vivo. Cancer Res. 2007;67(2):651–658. doi: 10.1158/0008-5472.CAN-06-2762. [DOI] [PubMed] [Google Scholar]
- 45.Sengupta R, et al. CXCR4 activation defines a new subgroup of Sonic hedgehog-driven medulloblastoma. Cancer Res. 2012;72(1):122–132. doi: 10.1158/0008-5472.CAN-11-1701. [DOI] [PMC free article] [PubMed] [Google Scholar]
- 46.Krek W, et al. Negative regulation of the growth-promoting transcription factor E2F-1 by a stably bound cyclin A-dependent protein kinase. Cell. 1994;78(1):161–172. doi: 10.1016/0092-8674(94)90582-7. [DOI] [PubMed] [Google Scholar]
- 47.Li M, et al. Optimal promoter usage for lentiviral vector-mediated transduction of cultured central nervous system cells. J Neurosci Methods. 2010;189(1):56–64. doi: 10.1016/j.jneumeth.2010.03.019. [DOI] [PMC free article] [PubMed] [Google Scholar]
- 48.Zufferey R, Nagy D, Mandel RJ, Naldini L, Trono D. Multiply attenuated lentiviral vector achieves efficient gene delivery in vivo. Nat Biotechnol. 1997;15(9):871–875. doi: 10.1038/nbt0997-871. [DOI] [PubMed] [Google Scholar]
Associated Data
This section collects any data citations, data availability statements, or supplementary materials included in this article.