Abstract
In radiopharmaceutical therapy, an understanding of the dose distribution in normal and target tissues is important for optimizing treatment. Three-dimensional (3D) dosimetry takes into account patient anatomy and the nonuniform uptake of radiopharmaceuticals in tissues. Dose-volume histograms (DVHs) provide a useful summary representation of the 3D dose distribution and have been widely used for external beam treatment planning. Reliable 3D dosimetry requires an accurate 3D radioactivity distribution as the input. However, activity distribution estimates from SPECT are corrupted by noise and partial volume effects (PVEs). In this work, we systematically investigated OS-EM based quantitative SPECT (QSPECT) image reconstruction in terms of its effect on DVHs estimates. A modified 3D NURBS-based Cardiac-Torso (NCAT) phantom that incorporated a non-uniform kidney model and clinically realistic organ activities and biokinetics was used. Projections were generated using a Monte Carlo (MC) simulation; noise effects were studied using 50 noise realizations with clinical count levels. Activity images were reconstructed using QSPECT with compensation for attenuation, scatter and collimator-detector response (CDR). Dose rate distributions were estimated by convolution of the activity image with a voxel S kernel. Cumulative DVHs were calculated from the phantom and QSPECT images and compared both qualitatively and quantitatively. We found that noise, PVEs, and ringing artifacts due to CDR compensation all degraded histogram estimates. Low-pass filtering and early termination of the iterative process were needed to reduce the effects of noise and ringing artifacts on DVHs, but resulted in increased degradations due to PVEs. Large objects with few features, such as the liver, had more accurate histogram estimates and required fewer iterations and more smoothing for optimal results. Smaller objects with fine details, such as the kidneys, required more iterations and less smoothing at early time points post-radiopharmaceutical administration but more smoothing and fewer iterations at later time points when the total organ activity was lower. The results of this study demonstrate the importance of using optimal reconstruction and regularization parameters. Optimal results were obtained with different parameters at each time point, but using a single set of parameters for all time points produced near-optimal dose-volume histograms.
1. Introduction
Radiopharmaceutical therapy (RPT) has an established role as a treatment for certain cancers including radioiodine therapy for thyroid cancer, radioimmunotherapy (RIT) for non-Hodgkin’s lymphoma (NHL) (Juweid, 2002), peptide receptor radionuclide therapy (PRRT) for neuroendocrine tumors (NETs) (Pool et al., 2010), and selective internal radiation therapy (SIRT) for liver cancer (Prompers et al., 2011). In RPT, the goal is to deliver a lethal radiation dose to the tumor region while avoiding toxicity to normal organs. Unlike external beam therapy, the relationship between dose and tumor response or normal organ toxicity in RPT is not yet well established. As a result, the role of dosimetry in RPT treatment planning has been limited.
However, some recent studies (Dewaraja et al., 2010, Senthamizhchelvan et al., 2012) have shown some correlations between dose and response. Among the factors limiting the ability to predict response are failure to consider the impact of dose-rate and spatial non-uniformity of the dose distribution as well as limitations in the estimated activity distributions that form the basis for the dose estimates. More advanced and accurate dosimetry methods may prove important in establishing robust dose-response relationships that could enable dosimetry-based treatment planning and therapy optimization.
Quantitative SPECT (QSPECT) imaging methods, which incorporate compensation for non-uniform attenuation, scatter, and collimator-detector response, have been developed and evaluated for RPT dosimetry by several groups (Ljungberg et al., 2002, Ljungberg et al., 2003, Dewaraja et al., 2005, He et al., 2005, He and Frey, 2006). QSPECT has been demonstrated to provide improved quantification of total organ activity and mean absorbed dose. In one simulation study modeling 111In Zevalin (He et al., 2005), the error in mean organ activity estimates with advanced QSPECT methods was found to be less than 5.5% for most organs.
Three-dimensional (3D) RPT dosimetry that uses 3D activity distributions as inputs can potentially provide improved predictions of response as it can account for the effects of non-uniform dose distribution observed in many tumors and some organs. In addition, 3D dosimetry models the size and shape of organs and the geometric relationship among them fully and accurately. This potentially enables highly patient-specific radiobiological modeling (Sgouros et al., 2008).
However, the full information contained in the 3D dose distribution is more than can practically be used for treatment planning. As a result, summary measures are typically computed. The most basic are the mean, maximum, and minimum doses inside a volume-of-interest (VOI). However, these measures discard information that can be important in predicting normal organ toxicity or tumor control.
Differential and cumulative dose-volume histograms (DVHs) (Drzymala et al., 1991) are commonly used in external-beam radiation therapy to summarize and characterize 3D dose distributions. The differential DVH (DDVH) is a histogram of the fractional volume of a VOI receiving an absorbed radiation dose lying in a range corresponding to each of the histogram bins. The cumulative DVH (CDVH), hereafter and commonly referred to as the DVH, is the integral of the DDVH. In DVH plots the horizontal axis represents the absorbed dose threshold for each bin, and the vertical axis represents the fraction of the VOI volume having a dose larger than or equal to the dose threshold. The DVH summarizes the minimum, maximum, and median dose and the dispersion about the median dose, with a more nonuniform dose distribution having a larger dispersion.
The DVH can also be used to calculate parameters such as the tumor control probability (TCP) and normal tissue complication probability (NTCP), which are radiobiology-based parameters describing the tumor-cell survival fraction and late normal organ toxicity (Lyman, 1985, Niemierko and Goitein, 1991). As pointed out in (Sgouros, 2005), the DVH and equivalent uniform dose (EUD) models are two promising ways to meaningfully summarize the large amount of data contained in the 3D distribution of absorbed dose. In this work we have concentrated on optimizing and evaluating reconstruction parameters that improve DVHs.
Accurate 3D dosimetry requires an accurate 3D activity distribution as input. Although 3D dose calculations and DVH estimates, as emerging tools in RPT dosimetry, are being developed and used, there has been little systematic investigation of the effects of image-degrading factors on DVH estimates and optimization of image reconstruction parameters for improved voxel level dosimetry. SPECT imaging is degraded by noise and limited resolution, both of which can lead to distortions in estimated histograms. Three-dimensional dosimetry is usually based on a series of images at several time points. The noise level in the projection data at different time points can be very different because of biological clearance and physical decay. The extent of the partial volume effects (PVEs), mainly caused by the limited spatial resolution of SPECT imaging system, depends on the sizes, spatial relationships, and relative uptakes of the various organs and tumors.
The DVH, as a potentially valuable tool in 3D RPT dosimetry, has been studied and applied in several studies. In (Ljungberg et al., 2003), a general method for 3D absorbed dose calculation based on SPECT was presented, and DVHs derived from phantom and reconstructed images were shown for organs such as liver, spleen, lungs, and bone marrow. Compared to DVHs obtained from the actual absorbed dose distributions in a phantom, large deviations were observed from the DVHs obtained from SPECT images. In an 131I RIT dosimetry study (Dewaraja et al., 2010), DVHs were shown to demonstrate the nonuniformity of the absorbed dose distribution, and measures derived from DVHs were used to study the tumor dose-response relationship. In a patient study with 90Y microspheres therapy, DVHs were calculated to analyze the tumor and liver doses (Sarfaraz et al., 2004). The DVH analysis indicated that, although the patient received a nominal whole liver dose of 110 Gy, only 83% of the tumor and 16% of the liver received a dose higher than 110 Gy.
The number of iterations and the selection of post-reconstruction filters have been found to have a major effect on image quality for applications such as myocardial perfusion SPECT (Frey et al., 2002). However, most of the previous studies of QSPECT and resulting DVH estimates used a fixed iteration number and no filtering of the reconstructed images. It is well known that the image resolution and noise of SPECT images change as a function of iteration number and that post-reconstruction filtering can be used to reduce noise at the expense of image resolution. Therefore, optimization of these image reconstruction parameters has the potential to improve DVH estimates.
In this paper we systemically investigated the effects of image reconstruction parameters used in QSPECT on the DVH estimates of normal organs in 3D RPT dosimetry via a realistic simulation study. A modified NURBS-based Cardiac-Torso (NCAT) phantom (Segars and Tsui, 2009) and previously validated Monte Carlo (MC) simulation methods were used to generate projection data. A voxel S kernel generated using MC simulations with the 3D-RD dosimetry package (Prideaux et al., 2007) was used to compute the dose rate distribution from activity estimates obtained from QSPECT images for various numbers of iterations and post-reconstruction filter parameters. Cumulative DVHs (CDVHs) from both the phantom and reconstructed images were calculated, plotted, and compared both qualitatively and quantitatively. Multiple noise realizations were used to study the accuracy and precision of the histogram estimates.
2. Materials and Methods
2.1 NCAT Phantom and Monte Carlo Simulation
A modified version of the 3D NCAT phantom that incorporated a non-uniform kidney model was used in this study to provide a realistic and flexible model of human anatomy. Each kidney was composed of three parts: the renal cortex, medulla, and pelvis. These allowed realistic modeling of a non-uniform activity distribution in the kidneys. Non-uniform uptake in the kidneys plays an important role in PRRT dosimetry (Konijnenberg et al., 2007, De Jong et al., 2004), and we wished to be able to assess the effects of reconstruction parameters on the DVH for this application.
The anatomical parameters used in the NCAT phantom for major organs were adjusted to match those of a representative patient that underwent 90Y Zevalin therapy (He et al., 2009). The activities and kinetics for all the organs except the kidneys were from this patient after a 5 mCi 111In-Zevalin injection, used as a surrogate to estimate the distribution of 90Y Zevalin. Details of the imaging procedure and organ activity estimation process are given in (He et al., 2009). The activity concentrations for the kidneys, including the cortex, medulla and pelvis, were from a different patient imaged after injection of 111In-DTPA-octreotide in a PRRT dose-planning study (Baechler et al., 2012). The activity concentrations for the renal medulla and pelvis were assumed to be the same. In RIT with Zevalin, the liver is the major dose-limiting organ; in PRRT, the radiolabeled peptide is cleared by the kidneys, and the kidney dose is significant. Of importance, the activity distribution in the kidneys is nonuniform and uptake in the renal cortex is especially important; recent dosimetric studies suggest that the renal cortex rather than the whole kidney is the dose-limiting organ (Bodei et al., 2008). The use of this hybrid activity distribution from patients undergoing two different therapies enabled us to investigate the DVHs of both liver and kidney in cases where each is dose-limiting through a single simulation study. There is some crosstalk between the organs due to partial volume effects, i.e., the spill-out of activity from one organ results in spill-in of activity to the other organ, so the results reported are not exactly representative of what would be observed in either case, but they are useful for studying the various trends and parameters affecting the DVH for both organs.
Time activity curves at 5 time points post-injection, i.e., 1, 5, 24, 72, and 144 hours, were simulated using a mono-exponential to model only the biological clearance phase. We neglected the uptake phase because in organs the uptake is rapid and the clearance phase of the time-activity curve provides the greatest dose contribution. Also, data from finely sampled early time points needed to assess the uptake kinetics were not available and are not usually obtained in RPT therapy treatment planning applications. The organ activities simulated at the 24-hour time point, the organ volumes, and the effective half-lives are listed in Table 1.
Table 1.
Organ volumes, activities, and half-lives of the simulated NCAT phantom.
| Heart | Lung | Liver | Renal Cortex | Renal Medulla | Renal Pelvis | Spleen | Marrow | Blood Vessels | Whole Body Remainder | |
|---|---|---|---|---|---|---|---|---|---|---|
| Volume (ml) | 1077 | 2198 | 1737 | 192 | 71 | 13 | 164 | 846 | 389 | 45869 |
| Activity (MBq) | 8.83 | 12.26 | 21.31 | 2.07 | 0.27 | 0.049 | 5.63 | 3.74 | 3.70 | 73.95 |
| Half- life(hours) | 36.6 | 56.3 | 84.4 | 30.1 | 26.7 | 26.7 | 57.6 | 75.2 | 32.9 | 59.8 |
A modified version of the SimSET code (Harrison et al., 1993) combined with an angular response function (ARF) based simulation of the interactions in the collimator and detector was used to simulate the projection data (Song et al., 2005, He et al., 2005). The MC simulations were performed with parameters appropriate for a GE Millennium VG/Hawkeye SPECT/CT system having a 1.5875cm (5/8 inch) thick crystal, an energy resolution of 9.5% at 140.5 KeV and medium-energy general-purpose (MEGP) collimation. Both 111In photopeaks (171 KeV and 245 KeV) were simulated with the appropriate abundances (0.90 for 171 KeV and 0.94 for 245 KeV). Separate simulations were performed for the organs and regions listed in Table 1. Low noise projection data were simulated into images with 128 transaxial and 170 axial projection bins at 120 views over 360° using a 0.442 cm projection bin size. Two 20% wide energy windows centered at 171 KeV and 245 KeV were simulated, and the resulting projections were summed. In order to reduce the effects of discretization, the NCAT phantom was discretized with a voxel size 0.221 cm, which was half of the projection bin size.
The projection data simulated from all the organs were scaled and summed according to the activity distribution in Table 1. Next, the low noise projection data were scaled to a clinical count level appropriate for a 30 minute SPECT acquisition on a dual-camera system. The average counts per axial slice for the 24 hour time point was 1.355×10⁵. Finally, the projection data were filtered with a 2D Gaussian filter having a FWHM of 0.40 cm to simulate the intrinsic resolution. Poisson noise was added to produce 50 noise realizations. The MC simulation method has been validated and used in previous studies (Song et al., 2005, He et al., 2005). One coronal slice each of the phantom, attenuation map, and the simulated projection data is shown in figure 1. Figure 2 shows an enlarged coronal slice of the nonuniform kidney model.
Figure 1.
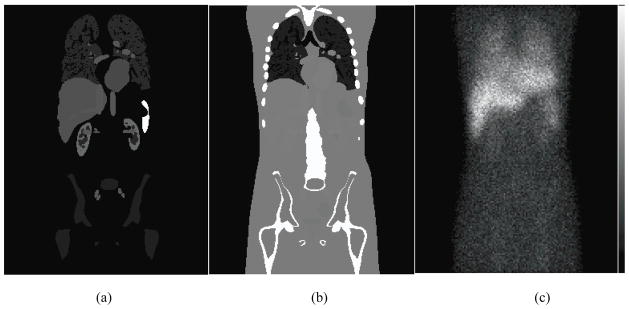
One coronal slice of the (a) phantom and (b) attenuation map, and (c) the noisy anterior projection image.
Figure 2.
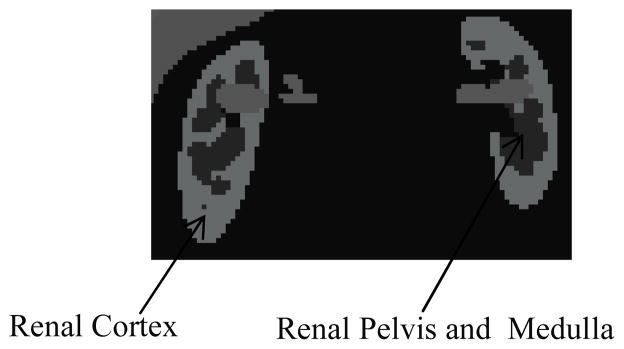
One slice of the non-uniform kidney model.
2.2 Quantitative SPECT (QSPECT) method
The QSPECT method has been previously demonstrated to provide accurate organ activity estimates. This work focused on optimizing and assessing QSPECT reconstructions in terms of DVH estimates for 3D dosimetry. The QSPECT method used was based on the iterative OS-EM algorithm with model based compensations for attenuation, scatter, and the collimator-detector response function (CDRF) (Hudson and Larkin, 1994, He et al., 2005). The abundance-weighted average of the true attenuation maps for the 171 KeV and 245 KeV photons emitted by 111In was used in the reconstruction. Scatter modeling was performed using the effective source scatter estimation (ESSE) method (Frey and Tsui, 1996). The full CDRF, including the septal penetration and scatter components, was estimated using MC simulations of a point source at various distances from the surface of the collimator.
A post-reconstruction Gaussian filter was applied to the image obtained from each iteration in order to control noise. In order to study the effects of reconstruction parameters such as iteration number and post-reconstruction filter on the dose estimates, we explored various combinations of iteration number and filter FWHM. The SPECT projections were reconstructed using up to 150 iterations of 24 subsets (unless otherwise noted). We investigated 15 FWHM values ranging from 0.5 to 5.0 voxels in increments of 0.5 voxels and from 5.0 to 10.0 voxels in increments of 1 voxel.
2.3 Dose rate and dose estimation method
After the application of the post-reconstruction filter, the SPECT images were interpolated from a voxel size of 0.442 cm to 0.221 cm using trilinear interpolation in order allow comparison with the phantom. The voxel values in the SPECT images were then converted to activities using a calibration factor that was calculated from the geometric sensitivity of the imaging system. The geometric sensitivity is defined as the number of detected geometric photons per emitted photon and was calculated by Monte Carlo simulation of a point source in air using SimSET and an ARF that modeled only the geometric response of the collimator but included scattering and partial deposition in the crystal and detector.
As the study was performed in the context of 90Y dosimetry, the activity estimates from 111In imaging were converted to 90Y activities by compensating for the difference in half-lives.
The activities estimated from the QSPECT images and the true values obtained from the phantom were each convolved with a voxel S kernel to calculate dose rate estimate images at each time point. The voxel S kernel was derived from MC simulations using the 3D-RD software package (Prideaux et al., 2007). A water-filled sphere with a diameter of 33 voxels was simulated. A single voxel source at the center of the sphere and β-emission from 90Y were simulated. Particles were tracked and the energy deposition in the source and surrounding 0.221 cm voxels was recorded. A total of 10 million β-particle emissions were simulated.
The use of voxel S kernel and convolution to estimate dose assumes a homogeneous medium. This method is less accurate at boundaries of regions with large differences in composition or density such as boundaries between soft tissue and bone or lung. This limitation is not a major one in this study because we focused on abdominal organs such as the liver and the kidneys, both of which are soft tissues and are surrounded predominantly by other soft tissues. There might be some slight errors at the upper boundaries of the liver where it is close to the lung. However, this represents only a very small proportion of the liver volume so it should have a relatively small effect on DVH estimates of the whole liver. It would have been computationally impractical to apply full 3D MC simulations to all of the combinations of iterations and filter FWHMs investigated.
We estimated dose images from the set of dose rate images as follows. Since the activity values in each voxel were quite noisy, direct exponential fits were often unstable. Thus, we numerically integrated the time versus dose rate curve in each voxel as follows. The Trapezoidal Rule was used to integrate the dose-rate data in each voxel for the intervals between the 5 simulated time points. Exponential fits were used to compute the dose estimates before the first and after the last time points. In particular, an exponential fit of the data from the 5 time points was obtained and the resulting half-life compared to the half-life for physical decay. Since a half-life longer than physical decay is indicative that the fit failed due to noise, the smaller of the fitted or physical half-life was used. This half-life was used to extrapolate the activity from time zero to the first time point and the last point to infinity. The resulting exponentials were integrated over these times and added to the results of the trapezoidal integration between the five time points. A similar integration strategy has been used in (Hobbs et al., 2011).
2.4 Histogram generation and figure of merit (FOM)
After the estimation of dose rate values at each time point, the corresponding cumulative dose-rate volume histograms (CDRVHs) for the liver, kidneys and the renal cortices were computed and plotted. The CDRVH is defined similarly to the CDVH, but the horizontal axis represents dose-rate ranges (bins). In order to make the histograms more relevant to the final estimated dose, we used a bin size for the histogram that was approximately equivalent to 0.25% of the median value of the dose/activity ratio of 90Y Zevalin for liver (Stabin, 2003) and 0.2% of a literature dose/activity ratio for 90Y-DOTATOC for the kidneys (Paganelli et al., 2001). In particular, the dose/activity ratios used were 4.8 mGy/MBq for liver and 3.3 mGy/MBq for kidney and renal cortices. The dose/activity ratio used in above publications refers to the dose absorbed by the particular organ per unit administered activity of radiopharmaceutical.
The CDRVH was computed for each combination of iteration number and FWHM of the Gaussian filter. As we generated 50 noise realizations, there were 50 histogram value estimates for each histogram bin. The CDRVH from the phantom was also computed and served as ground truth. The mean squared error (MSE) of the histogram estimate was computed for each histogram bin and then averaged over all the bins. The square root of the normalized MSE (RNMSE) was used as the FOM in the study:
| (0) |
where is the histogram value in the b-th bin for the n-th noise realization, is the histogram value in the b-th bin for the phantom, B is the total number of bins in the histogram, and N is the number of noise realizations. We sought the optimal parameters, i.e., the combination of iteration number and FWHM, that on average produced the best results, i.e., the minimum RNMSE. The bias and variance of the histogram estimates for each bin were also computed from the 50 noise realizations.
For a particular noise realization, the square root of the MSE (RMSE) of the CDRVH obtained from the reconstructed image was defined as:
| (0) |
The dose rate images that had the minimum RMSE of the CDRVH at each of the 5 time points were integrated to obtain the optimal dose distribution estimate. The CDVH was then computed from the optimal dose distribution estimates. This was performed for both the phantom and the estimates obtained from SPECT. The RMSEs of the CDVHs between the phantom and reconstruction of simulated SPECT images were computed as described above for the CDVRHs.
3. Results
3.1 Liver
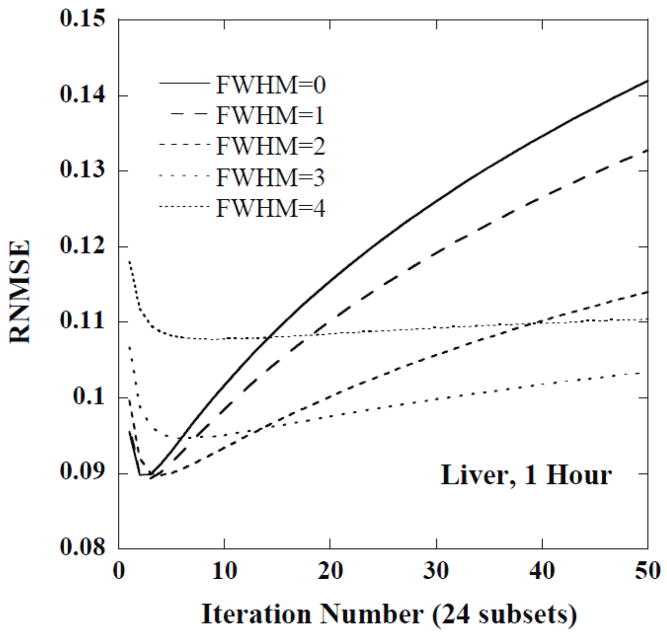
Figure 3 shows plots of the RNMSE for the CDVRH of the liver as a function of iteration number for 5 different filter FWHMs at the first time point. Notice that the minimum RNMSE was achieved for a small number of iterations and with relatively little filtering, i.e., 2–4 iterations and a FWHM of 1 voxel. For moderate iteration numbers, such as 10 to 50, a FWHM of 3 voxels was helpful in improving the fidelity of the histogram estimates. For even larger iteration numbers, stronger smoothing, e.g., a FWHM of 4 voxels, was useful. Similar trends were observed for the CDRVH at other time points.
Figure 3.
The RNMSE of CDRVH for the liver at 1 hour as a function of iteration number for various FWHMs (in units of voxels).
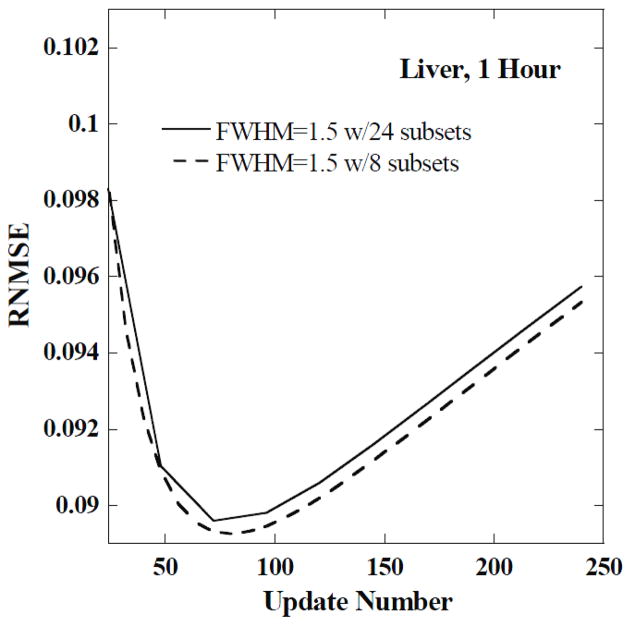
Since the lowest RNMSE was achieved for a small number of iterations, we investigated whether better results could be obtained using a smaller number of subsets with more iterations. In particular, we did an experiment using 8 subsets with 15 views in each subset to check if the minimum RNMSE would be achieved with a different number of updates (product of iterations and subsets) than possible with 24 subsets. We found that the minimum RNMSEs in both cases were very similar. As an example, in figure 4, we show a plot of RNMSE as a function of the update number for the liver at 1 hour using 8 and 24 subsets for a FWHM of 1.5 voxels. In this case, the minimum RNMSEs differed by less than 0.4% of the minimum RNMSE obtained with 24 subsets. Therefore, we adopted 24 subsets for remainder of the paper.
Figure 4.
The RNMSE of the CDRVH for the liver at 1 hour as a function of update number for a FWHM of 1.5 voxels and two different numbers of subsets.
3.2 Kidneys and renal cortices
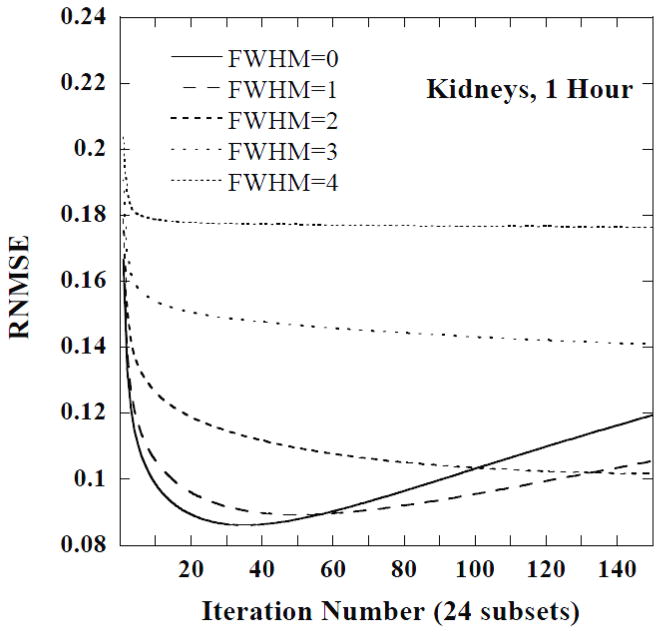
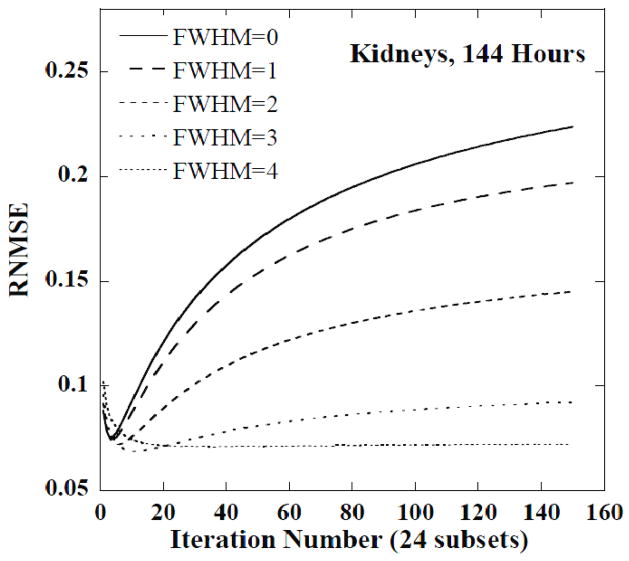
Figures 5 and 6 show plots of the RNMSE of the CDRVH for the kidneys at 1 hour and 144 hours, respectively, as a function of iteration number for 5 FWHMs. Note that the minimum RNMSE was obtained for a large number of iterations, approximately 40, and no filtering for the 1 hour time point. The later time points, and especially the last time point, required a moderate number of iterations and smoothing, e.g., 15 iterations and a FWHM of 3 voxels at 144 hours. Post-reconstruction filtering with a FWHM of 3 or 4 voxels was also helpful in stabilizing the RNMSE at 144 hours.
Figure 5.
The RNMSE of the CDRVH for kidneys at 1 hour as a function of iteration number for various FWHMs. The FWHM values are given in units of the reconstructed voxel size.
Figure 6.
The RNMSE of CDRVH for kidneys at 144 hours as a function of iteration number for various FWHMs. The FWHM values are given in units of the reconstructed voxel size.
Similar trends in the RNMSE were observed for the renal cortices as for the entire kidneys: optimal RNMSE was achieved for a large iteration number for early initial time points and a moderate iteration number and moderate smoothing for the last time point. Notice that filtering also helped stabilize the RNMSE at later time points.
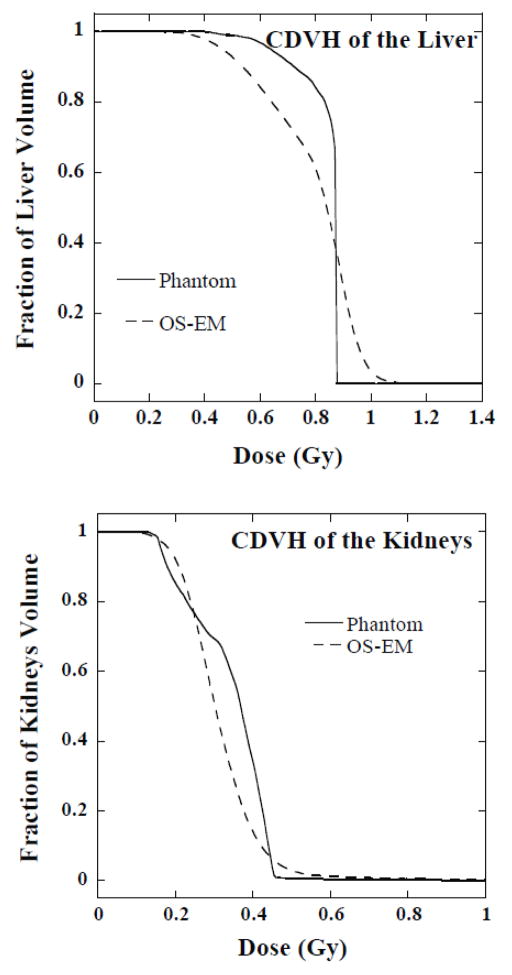
Table 2 summarizes the results and shows the optimal parameters for each organ at each time point. Figure 7 shows the CDVHs for the phantom and the OS-EM reconstructed images obtained with the optimal reconstruction and filtering parameters from one sample noise realization. In figure 7, the horizontal axis gives the dose value and the vertical axis is the fraction of the liver or kidney volume that had a dose value larger than or equal to the corresponding dose value on the horizontal axis.
Table 2.
The optimal parameters for each organ at 5 time points*
| Liver | Kidneys | Renal cortices | |
|---|---|---|---|
| 1 Hour | Iteration 3, FWHM 1.5 | Iteration 35, no post-filter | Iteration 53, no post-filter |
| 5 Hours | Iteration 3, FWHM 1.5 | Iteration 34, no post-filter | Iteration 50, no post-filter |
| 24 Hours | Iteration 3, FWHM 1.5 | Iteration 26, no post-filter | Iteration 36, no post-filter |
| 72 Hours | Iteration 2, FWHM 0.5 | Iteration 22, FWHM 1.5 | Iteration 24, FWHM 1.5 |
| 144 Hours | Iteration 2 FWHM 1.0 | Iteration 18, FWHM 3.5 | Iteration 32, FWHM 5 |
FWHMs given in units of reconstructed voxel size
Figure 7.
Comparison of CDVHs for the liver (upper panel) and kidneys (lower panel) from the phantom and OS-EM reconstructed images with the optimal parameters.
3.3 The bias and variance of the histogram estimates
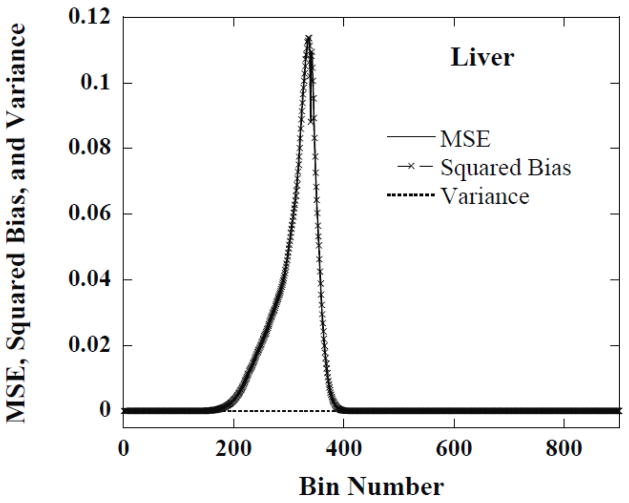
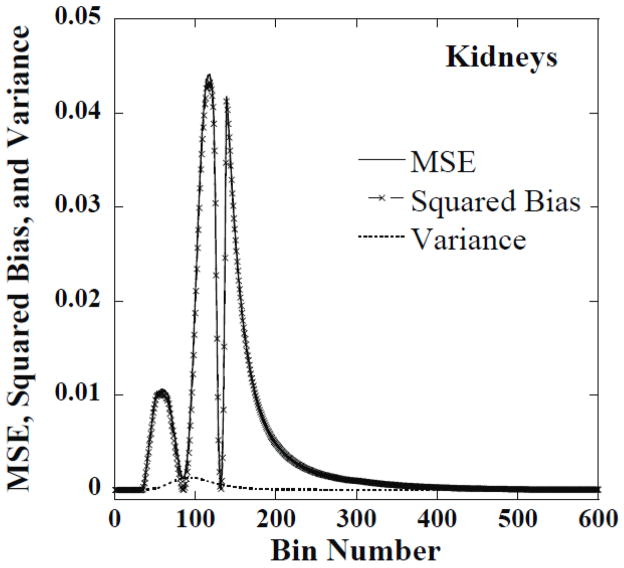
Using the histograms from the 50 noise realizations we computed the MSE, the bias and the variance for the histogram value estimate in each histogram bin. For most of the bins the bias dominated the MSE. Examples of this are shown in figures 8 and 9, respectively, for the liver and kidneys for one set of reconstruction parameters. This indicates that there was little variation in the histograms for optimal parameters across different noise realizations. This suggests that the optimal parameters for one noise realization were optimal or near-optimal for other noise realizations.
Figure 8.
The MSE, squared bias and variance of CDRVH estimates in each dose-rate bin for the liver at 1 hour obtained from reconstructed images using iteration 3 and a FWHM of 1.5 voxels.
Figure 9.
The MSE, squared bias and variance of CDRVH estimates in each dose-rate bin for kidneys at 144 hours obtained from reconstructed images using iteration 18 and a FWHM of 3.5 voxels.
The peaks in figures 8 and 9 correspond to the regions where the bias, i.e., the difference between the estimated and phantom CDRVHs, is large. The valleys correspond to regions where the estimated and phantom CDRVH curves cross. In these valleys, the bias in the estimate passes through zero and the MSE is simply equal to the variance, which is small compared to the bias in the peak regions.
4. Discussion
DVHs are useful for planning treatment and computing the TCP and NTCP. Dose distribution estimates are based on activity distribution estimates obtained from emission computed tomography (ECT) imaging, which are degraded by noise and limited spatial resolution. These image degrading factors result in errors in the histograms generated from the reconstructed images. The results of this paper show that these degradations can be reduced by selecting the optimal number of iterations and post-reconstruction filtering. However, from figure 7, we observe that there were visible residual degradations of the estimated CDVHs compared to the histograms from the phantom, even with the optimal parameters.
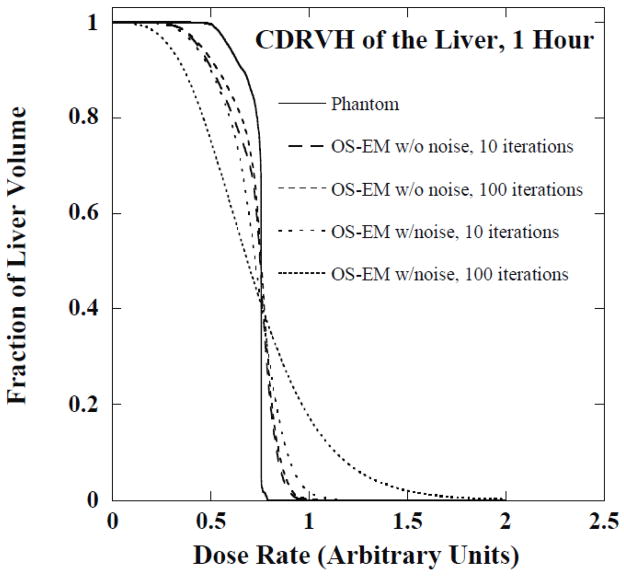
In order to investigate the importance of noise and limited spatial resolution on the CDVH errors we performed an additional simulation study. The Monte Carlo simulated projection data without added Poisson noise were reconstructed using OS-EM and histograms were generated using the same procedure described previously. Figure 10 shows the CDRVH for the liver at 1 hour obtained from the phantom and the unfiltered OS-EM reconstructed images at 10 and 100 iterations with and without Poisson noise. Note that noise was a major degrading factor and it produced distortions at both the upper and lower ends of histograms compared to the noise-free case. The CDRVH distortions at 100 iterations were substantially larger than those observed with 10 iterations due to the amplification of noise that occurs for large numbers of iterations. On the other hand, distortions of histograms at both ends were observed even for noise-free projection data. The distortions in the histograms for the noise-free case shown in figure 10 resulted from ringing artifacts due to CDR compensation for high dose rates and a combination of PVEs and ringing artifacts for low dose rates. Larger distortions for the noise-free case were observed for higher iterations in the large dose rate region (right end of the plot) because of the increased ringing artifacts, while fewer distortions were observed in the lower dose rate region of the DVH because of the reduced PVEs resulting from improved resolution recovery. The RMSE values for the histograms in figure 10 are shown in Table 3. This indicates quantitatively the importance of both effects.
Figure 10.
The CDRVH of liver at 1 hour from phantom and OS-EM reconstructed images with and without noise.
Table 3.
The RMSE of the histograms shown in figure 10.
| 10 iterations, w/o noise | 100 iterations, w/o noise | 10 iterations, w/noise | 100 iterations, w/noise | |
|---|---|---|---|---|
| RMSE | 0.0762 | 0.0739 | 0.1008 | 0.1682 |
Figure 11 shows reconstructed images from low-noise data and noisy data after a large number of iterations and no filtering and with the optimal reconstruction parameters. The ringing is evident in the noise-free images. Using a large number of iterations produced ringing (i.e., a hot rim) at the edges of the liver; using a small number of iterations or low-pass filtering reduced the ringing. Notice that noise in the image reconstructed from noisy data increased with iteration number. Using either a smaller number of iterations or a low-pass filter also reduced noise. Finally, note that while the low-pass filter and lower iteration number reduced noise and ringing effects, it resulted in greater blurring at the edge of the liver and thus increased partial volume effects.
Figure 11.

Single coronal slices of the 3D images are shown for (a) the phantom, unfiltered SPECT images reconstructed from (b) noise-free data and (c) noisy data at 100 iterations, and (d) SPECT images reconstructed with the optimal reconstruction parameters (3 iterations, FWHM 1.0 voxel) for the same noise realization.
The results for the liver and kidneys show that reconstruction parameters such as iteration number and post-reconstruction filter have a significant effect on the accuracy of estimates of CDVHs. This is quite different compared to previous work on organ dosimetry where no filtering and high iteration numbers were optimal for estimating organ activities (He et al., 2005). The differences in optimal reconstruction parameters for organ dosimetry and CDVH estimation result from differences in the nature of the dose calculations applied to the images after reconstruction. For organ dosimetry only the total organ activity matters: summing all the voxels in an organ averages out the noise and thus drastically reduces the effects of noise and ringing. Partial volume effects thus have the biggest impact for organ dosimetry, and using a large number of iterations can reduce these effects. Since summing over the region already averages out the noise, adding a low-pass filter only increases the partial volume effects. However, the CDVH depends on the value of each voxel, and thus the noise and effect of ringing in each voxel. Since a large number of iterations increases these effects and low-pass filtering reduces them, optimizing the reconstruction for the DVH requires a small number of iterations and some low-pass filtering.
Understanding the factors that degrade the CDVH and their relationship to the number of iterations can aid in understanding the optimal parameters needed for the liver and kidneys at different time points. For large organs such as the liver simulated in our study, noise and ringing artifacts were the major factors degrading the histograms. Therefore, small iteration numbers and modest post-reconstruction smoothing, which reduced both noise and ringing artifacts, led to minimum RNMSE values. However, for small organs with detailed features, such as the kidney and renal cortex, PVEs were the dominant factor degrading the histograms. As observed in figure 5 for the kidneys at 1 hour, larger iteration numbers were required in order to obtain the minimum RNMSE. These large iterations provided improved resolution and reduced PVEs. For the last two time points for the kidneys, PVEs were still important, but reduced counts in the data increased the importance of noise in degrading the histograms. Thus, the optimal parameters were a compromise between improving resolution and controlling noise. Therefore, for the last time point the optimal histograms were for a smaller iteration number and more smoothing than required for the earlier time points.
Table 2 indicates that there are different optimal parameters for different time points. This could be an issue in practice. However, we noticed that it was possible to choose one set of reconstruction parameters for all the time points and achieve near-optimal results. As an example, we computed the CDVHs for the liver and kidneys from images reconstructed using a single set of near-optimal parameters for all the 5 time points, i.e., iteration 3 and FWHM of 1.0 voxel for the liver and iteration 25 and FWHM of 1.0 voxel for the kidneys; the corresponding RMSE results are shown in Table 4 in comparison to those obtained using the optimal parameters for each time point. The difference in the RMSE for optimal and near-optimal parameters was less than 0.4% for the liver and about 4% for the kidneys in this example. This indicates that near-optimal histograms could be obtained with one single set of parameters for all the time points. Note, however, that different parameters are required for different organs in order to achieve optimal results. The choice of parameters for an organ depends on the balance of noise, ringing, and resolution. Also note that in many practical cases there will be a single dose-limiting organ and parameters for a single organ could be used for the entire image.
Table 4.
The RMSE with optimal and near-optimal parameters.
| Liver | Kidneys | |
|---|---|---|
| RMSE w/optimal parameters | 0.1094 | 0.0897 |
| RMSE w/one set of near-optimal parameters | 0.1098 (Iteration 3, FWHM 1.0 voxel) | 0.0934 (Iteration 25, FWHM 1.0 voxel) |
5. Conclusion
Dose-volume histograms in 3D dosimetry computed from activity estimates obtained from QSPECT images are corrupted by noise, PVEs and possibly ringing artifacts due to collimator-detector response compensation. We systematically investigated the effects of iteration number and post-reconstruction filter parameter on estimates of the CDRVHs and CDVHs. The results indicated that careful attention to the number of iterations and post-reconstruction filtering was important in order to obtain high quality CDRVHs and CDVHs. The optimal parameters depended on the noise-level and object of interest. Large objects with few features, such as the liver, had more accurate CDRVH and CDVH estimates and required fewer iterations and more smoothing. Small objects with fine details, such as the kidneys, required more iterations and less smoothing at early time points but more smoothing and fewer iterations at later time points when the total organ activity was lower. Development of more advanced regularization techniques that provide noise control, PVE compensation and control of the ringing resulting from CDR compensation are needed to further increase the accuracy of activity distributions used as inputs to 3D dosimetry.
Acknowledgments
This work is supported by NIH grants R01-CA109234 and R01-CA116477.
Footnotes
Disclosure
The reconstruction code used in this work has been licensed to GE Healthcare for inclusion in a commercial product. Under separate licensing agreements between the General Electric Co. and the Johns Hopkins University and the University of North Carolina at Chapel Hill and GE Healthcare, Dr. Frey is entitled to a share of royalty received by the universities on sales of products described in this article. The terms of this arrangement are being managed by the Johns Hopkins University in accordance with its conflict of interest policies.
References
- BAECHLER S, HOBBS RF, BOUBAKER A, BUCHEGGER F, HE B, FREY EC, SGOUROS G. Three-dimensional radiobiological dosimetry of kidneys for treatment planning in peptide receptor radionuclide therapy. Medical Physics. 2012;39:6118–6128. doi: 10.1118/1.4752213. [DOI] [PMC free article] [PubMed] [Google Scholar]
- BODEI L, CREMONESI M, FERRARI M, PACIFICI M, GRANA C, BARTOLOMEI M, BAIO S, SANSOVINI M, PAGANELLI G. Long-term evaluation of renal toxicity after peptide receptor radionuclide therapy with Y90-DOTATOC and Lu177-DOTATATE: the role of associated risk factors. European Journal of Nuclear Medicine and Molecular Imaging. 2008;35:1847–1856. doi: 10.1007/s00259-008-0778-1. [DOI] [PubMed] [Google Scholar]
- DE JONG M, VALKEMA R, VAN GAMEREN A, VAN BOVEN H, BEX A, VAN DE WEYER EP, BURGGRAAF JD, KÖRNER M, REUBI JC, KRENNING EP. Inhomogeneous localization of radioactivity in the human kidney after injection of [111In-DTPA]octreotide. Journal of Nuclear Medicine. 2004;45:1168–1171. [PubMed] [Google Scholar]
- DEWARAJA YK, SCHIPPER MJ, ROBERSON PL, WILDERMAN SJ, AMRO H, REGAN DD, KORAL KF, KAMINSKI MS, AVRAM AM. 131I-tositumomab radioimmunotherapy: Initial tumor dose-response results using 3-dimensional dosimetry including radiobiologic modeling. Journal of Nuclear Medicine. 2010;51:1155–1162. doi: 10.2967/jnumed.110.075176. [DOI] [PMC free article] [PubMed] [Google Scholar]
- DEWARAJA YK, WILDERMAN SJ, LJUNGBERG M, KORAL KF, ZASADNY K, KAMINISKI MS. Accurate dosimetry in 131I radionuclide therapy using patient-specific, 3-dimensional methods for SPECT reconstruction and absorbed dose calculation. Journal of Nuclear Medicine. 2005;46:840–849. [PMC free article] [PubMed] [Google Scholar]
- DRZYMALA RE, MOHAN R, BREWSTER L, CHU J, GOITEIN M, HARMS W, URIE M. Dose-volume histograms. International Journal of Radiation Oncology*Biology*Physics. 1991;21:71–78. doi: 10.1016/0360-3016(91)90168-4. [DOI] [PubMed] [Google Scholar]
- FREY EC, GILLAND KL, TSUI BM. Application of task-based measures of image quality to optimization and evaluation of three-dimensional reconstruction-based compensation methods in myocardial perfusion SPECT. IEEE Trans Med Imaging. 2002;21:1040–50. doi: 10.1109/TMI.2002.804437. [DOI] [PubMed] [Google Scholar]
- FREY EC, TSUI BMW. A new method for modeling the spatially-variant, object-dependent scatter response function in SPECT. Nuclear Science Symposium, 1996. Conference Record., 1996 IEEE; 2–9 Nov 1996; 1996. pp. 1082–1086. [Google Scholar]
- HARRISON RL, VANNOY SD, HAYNOR DR, GILLISPIE SB, KAPLAN MS, LEWELLEN TK. Preliminary Experience With The Photon History Generator Module Of A Public-domain Simulation System For Emission Tomography. Nuclear Science Symposium and Medical Imaging Conference, 1993., 1993 IEEE Conference Record; 31 Oct–6 Nov 1993; 1993. pp. 1154–1158. [Google Scholar]
- HE B, DU Y, SEGARS WP, WAHL RL, SGOUROS G, JACENE H, FREY EC. Evaluation of quantitative imaging methods for organ activity and residence time estimation using a population of phantoms having realistic variations in anatomy and uptake. Medical Physics. 2009;36:612–619. doi: 10.1118/1.3063156. [DOI] [PMC free article] [PubMed] [Google Scholar]
- HE B, DU Y, SONG X, SEGARS WP, FREY EC. A Monte Carlo and physical phantom evaluation of quantitative In-111 SPECT. Physics in Medicine and Biology. 2005;50:4169–4185. doi: 10.1088/0031-9155/50/17/018. [DOI] [PubMed] [Google Scholar]
- HE B, FREY EC. Comparison of conventional, model-based quantitative planar, and quantitative SPECT image processing methods for organ activity estimation using In-111 agents. Physics in Medicine and Biology. 2006;51:3967–3981. doi: 10.1088/0031-9155/51/16/006. [DOI] [PubMed] [Google Scholar]
- HOBBS RF, MCNUTT T, BAECHLER S, HE B, ESAIAS CE, FREY EC, LOEB DM, WAHL RL, SHOKEK O, SGOUROS G. A treatment planning method for sequentially combining radiopharmaceutical therapy and external radiation therapy. Int J Radiat Oncol Biol Phys. 2011;80:1256–62. doi: 10.1016/j.ijrobp.2010.08.022. [DOI] [PMC free article] [PubMed] [Google Scholar]
- HUDSON HM, LARKIN RS. Accelerated image reconstruction using ordered subsets of projection data. IEEE Transactions on Medical Imaging. 1994;13:601–609. doi: 10.1109/42.363108. [DOI] [PubMed] [Google Scholar]
- JUWEID ME. Radioimmunotherapy of B-cell non-Hodgkin’s lymphoma: From clinical trials to clinical practice. Journal of Nuclear Medicine. 2002;43:1507–1529. [PubMed] [Google Scholar]
- KONIJNENBERG M, MELIS M, VALKEMA R, KRENNING E, DE JONG M. Radiation Dose Distribution in Human Kidneys by Octreotides in Peptide Receptor Radionuclide Therapy. Journal of Nuclear Medicine. 2007;48:134–142. [PubMed] [Google Scholar]
- LJUNGBERG M, FREY E, SJÖGREEN K, LIU X, DEWARAJA Y, STRAND SE. 3D absorbed dose calculations based on SPECT: Evaluation for 111-In/90-Y therapy using Monte Carlo simulations. Cancer Biotherapy and Radiopharmaceuticals. 2003;18:99–107. doi: 10.1089/108497803321269377. [DOI] [PubMed] [Google Scholar]
- LJUNGBERG M, SJÖGREEN K, LIU X, FREY E, DEWARAJA Y, STRAND SE. A 3-dimensional absorbed dose calculation method based on quantitative SPECT for radionuclide therapy: Evaluation for 131I using Monte Carlo simulation. Journal of Nuclear Medicine. 2002;43:1101–1109. [PMC free article] [PubMed] [Google Scholar]
- LYMAN JT. Complication Probability as Assessed from Dose-Volume Histograms. Radiation Research Supplement. 1985;8:S13–S19. [PubMed] [Google Scholar]
- NIEMIERKO A, GOITEIN M. Calculation of normal tissue complication probability and dose-volume histogram reduction schemes for tissues with a critical element architecture. Radiotherapy and Oncology. 1991;20:166–176. doi: 10.1016/0167-8140(91)90093-v. [DOI] [PubMed] [Google Scholar]
- PAGANELLI G, ZOBOLI S, CREMONESI M, BODEI L, FERRARI M, GRANA C, BARTOLOMEI M, ORSI F, DE CICCO C, MÄCKE HR, CHINOL M, DE BRAUD F. Receptor-mediated radiotherapy with Y90-DOTA-D-Phe1-Tyr3-octreotide. European Journal of Nuclear Medicine and Molecular Imaging. 2001;28:426–434. doi: 10.1007/s002590100490. [DOI] [PubMed] [Google Scholar]
- POOL SE, KRENNING EP, KONING GA, VAN EIJCK CHJ, TEUNISSEN JJM, KAM B, VALKEMA R, KWEKKEBOOM DJ, DE JONG M. Preclinical and Clinical Studies of Peptide Receptor Radionuclide Therapy. Seminars in Nuclear Medicine. 2010;40:209–218. doi: 10.1053/j.semnuclmed.2009.12.001. [DOI] [PubMed] [Google Scholar]
- PRIDEAUX AR, SONG H, HOBBS RF, HE B, FREY EC, LADENSON PW, WAHL RL, SGOUROS G. Three-dimensional radiobiologic dosimetry: application of radiobiologic modeling to patient-specific 3-dimensional imaging-based internal dosimetry. J Nucl Med. 2007;48:1008–16. doi: 10.2967/jnumed.106.038000. [DOI] [PMC free article] [PubMed] [Google Scholar]
- PROMPERS L, BUCERIUS J, BRANS B, TEMUR Y, BERGER L, MOTTAGHY FM. Selective internal radiation therapy (SIRT) in primary or secondary liver cancer. Methods. 2011;55:253–257. doi: 10.1016/j.ymeth.2011.09.014. [DOI] [PubMed] [Google Scholar]
- SARFARAZ M, KENNEDY AS, LODGE MA, LI XA, WU X, YU CX. Radiation absorbed dose distribution in a patient treated with yttrium-90 microspheres for hepatocellular carcinoma. Medical Physics. 2004;31:2449–2453. doi: 10.1118/1.1781332. [DOI] [PubMed] [Google Scholar]
- SEGARS W, TSUI BMW. Handbook of Anatomical Models for Radiation Dosimetry. Taylor & Francis; 2009. The MCAT, NCAT, XCAT, and MOBY Computational Human and Mouse Phantoms. [Google Scholar]
- SENTHAMIZHCHELVAN S, HOBBS RF, SONG H, FREY EC, ZHANG Z, ARMOUR E, WAHL RL, LOEB DM, SGOUROS G. Tumor dosimetry and response for 153Sm-ethylenediamine tetramethylene phosphonic acid therapy of high-risk osteosarcoma. Journal of Nuclear Medicine. 2012;53:215–224. doi: 10.2967/jnumed.111.096677. [DOI] [PMC free article] [PubMed] [Google Scholar]
- SGOUROS G. Dosimetry of Internal Emitters. Journal of Nuclear Medicine. 2005;46:18S–27S. [PubMed] [Google Scholar]
- SGOUROS G, FREY E, WAHL R, HE B, PRIDEAUX A, HOBBS R. Three-Dimensional Imaging-Based Radiobiological Dosimetry. Seminars in Nuclear Medicine. 2008;38:321–334. doi: 10.1053/j.semnuclmed.2008.05.008. [DOI] [PMC free article] [PubMed] [Google Scholar]
- SONG X, SEGARS WP, DU Y, TSUI BMW, FREY EC. Fast modelling of the collimator-detector response in Monte Carlo simulation of SPECT imaging using the angular response function. Physics in Medicine and Biology. 2005;50:1791–1804. doi: 10.1088/0031-9155/50/8/011. [DOI] [PubMed] [Google Scholar]
- STABIN MG. Radiotherapy with internal emitters: What can dosimetrists offer? Cancer Biotherapy and Radiopharmaceuticals. 2003;18:611–617. doi: 10.1089/108497803322287709. [DOI] [PubMed] [Google Scholar]


