

Abstract
To explore the mechanisms controlling erythroid differentiation and development, we analyzed the genome-wide transcription dynamics occurring during the differentiation of human embryonic stem cells (HESCs) into the erythroid lineage and development of embryonic to adult erythropoiesis using high throughput sequencing technology. HESCs and erythroid cells at three developmental stages: ESER (embryonic), FLER (fetal), and PBER (adult) were analyzed. Our findings revealed that the number of expressed genes decreased during differentiation, whereas the total expression intensity increased. At each of the three transitions (HESCs–ESERs, ESERs–FLERs, and FLERs–PBERs), many differentially expressed genes were observed, which were involved in maintaining pluripotency, early erythroid specification, rapid cell growth, and cell–cell adhesion and interaction. We also discovered dynamic networks and their central nodes in each transition. Our study provides a fundamental basis for further investigation of erythroid differentiation and development, and has implications in using ESERs for transfusion product in clinical settings.
Keywords: High-throughput RNA sequencing, Erythropoiesis, Cell differentiation, Development, Gene regulatory networks
1. Introduction
Two distinct waves of erythropoiesis occur during mammalian development, namely primitive and definitive erythropoiesis. Primitive erythropoiesis originates in the yolk sac and is characterized by the transient circulation of large, nucleated erythroblasts. In contrast, definitive erythropoiesis is characterized by the continuous circulation of small, enucleated erythrocytes, and in humans it can be further divided into fetal erythropoiesis originated from the fetal liver (FL) and adult erythropoiesis contributed by the bone marrow (BM) [1–3]. The most distinctive characteristic of erythroid cells during each developmental stage is the type of hemoglobin (Hb) expressed: embryonic erythroid cells express Hb Gower 1 (ζ2ε2), Gower 2 (α2ε2), and Portland (ζ2γ2); fetal erythroid cells express HbF (α2γ2); and adult erythroid cells mainly express HbA (α2β2). Mechanisms underlying the changes in Hb composition, known as Hb switching, during ontogenesis have attracted extensive research [4], partly due to the fact that reactivating developmentally silenced fetal γ globin can alleviate symptoms associated with hemoglobinopathies, e.g., sickle cell disease and β thalassemia.
However, little is known about the similarities and differences between erythroid cells of each developmental stage beyond their Hb compositions, morphologies, and to a degree, the extent of branching in polylactosamine chain of their membrane glycoproteins [5]. The difficulties in obtaining embryonic globin-expressing erythroid cells partially contribute to the lack of information concerning the properties of these primitive cells. Recently large quantities of erythroid cells co-expressing embryonic ε and fetal γ globins have been generated from human embryonic stem cells (HESCs) and induced pluripotent stem cells (HiPSCs) by several research groups [6]. Although these cells possess morphology more similar to definitive erythroid cells than those of a primitive nature, the expression of high levels of embryonic ε globin has caused some investigators to define these cells as primitive erythroblasts [6]. Although this discrepancy has not been resolved, these HESC-and/or HiPSC-derived erythroid cells nevertheless represent erythroid cells from an earlier developmental stage than those of FL and BM and may serve as a surrogate for early erythroid lineage cells that can provide insight into the changing properties of erythroid cells during development.
In addition to shedding light on the developmental biology of erythroid cells, the investigation of HESC-derived erythroblasts (ESERs) and/or HiPSC-derived erythroid cells may be clinically relevant. ESERs and HiPSC-derived erythroblasts reportedly exhibit characteristics of cord blood (CB) in terms of their oxygen dissociation curve, G6PD activities, CO rebinding kinetics, and response to 2,3-DPG depletion [7–9]. Cell enucleation can also occur under appropriate culture conditions [5]. Given that HESCs and HiPSCs can be maintained indefinitely in vitro, they may serve as donorless sources of red blood cells (RBCs) for transfusion purposes. While the cost prohibits the replacement of conventional blood concentrates with these in vitro-cultured erythroid cells, they may be particularly useful clinically for polysensitized patients with rare blood groups for whom cryopreserved blood is presently required. French researchers have proposed that as few as 15 HiPSC lines would cover 100% requirements of all Caucasian patients with rare blood phenotypes/genotypes in France [10]. A thorough investigation of the properties of these cells is therefore warranted.
In this study, we performed the first genome-wide expression profiling comparing the transcriptomes of four populations of cultured cells: HESCs, ESERs, and FL-derived and adult mobilized peripheral blood (PB) CD34+ cell-derived erythroblasts (FLERs and PBERs, respectively). Using a series of bioinformatic approaches, we studied global gene expression patterns, identified uniquely expressed genes in each population, and mapped networks and central nodes involved in differentially expressed genes. It is not surprising to find that HESCs were distinctly different from the three erythroid populations. However, we also observed significant differences among the three erythroid populations beyond Hb-related transcripts. Our study provides rich resources for further investigation on developmental regulation of erythropoiesis.
2. Results
2.1. RNA-Seq of HESCs and erythroid cells of different developmental stages
The surface markers and differential globin expression by respective erythroid cells used in this study have been reported previously [11]. To characterize the transcriptomes of HESCs and three developmentally-distinct erythroid populations (ESERs, FLERs, and PBERs), four libraries were generated and used for RNA-Seq using the ABI SOLiD Sequencing System. Approximately 45–124million reads (50bp in length) were obtained and mapped to the human genome. Among these reads, 8–37million reads were mapped to a unique locus, whereas 2–10million reads were mapped to multiple loci (Table S1). Despite the different sequencing depths obtained for HESCs, ESERs, FLERs, and PBERs, the percentage of genes detected approached saturation for all four cell types (Fig. 1A), as similarly described in another transcriptome study [12]. Most of these reads were mapped to exons, introns, and intergenic regions, whereas a small fraction (4.3%, 4.3%, 2.8%, and 2.7% for HESCs, ESERs, FLERs, and PBERs, respectively) of them were mapped to exon–intron junctions. More reads were mapped to exons than to introns in HESCs, ESERs, and FLERs. In contrast, more reads were mapped to introns than exons in PBERs, which is consistent with another PB transcriptome dataset in our group (unpublished data), and the reasons for this remain unknown. The coverage for each run was normalized to RPKM values to facilitate quantitative comparisons between genes and runs [13].
Fig. 1.
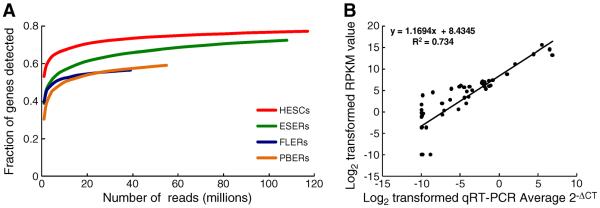
Quality analysis of RNA-Seq data. (A) Fraction of genes detected as a function of read depth. X-axis: number of reads (millions) mapped to the genome; Y-axis: the proportion of genes detected in genes from the National Center for Biotechnology Information (NCBI) database. (B) Correlation between qRT-PCR and RNA-Seq for selected genes in HESCs, ESERs, FLERs, and PBERs. The selected genes are FOXO1, SOX4, TET1, BLVRA, CAT, TXNIP, HBE, HBG1, HBB, GATA1, and KLF1.
To validate the sequencing data, we quantitated the expression of erythroid-related genes in these four cell populations using qRT-PCR. On the basis of transcript levels for FOXO1, SOX4, TET1, BLVRA, CAT, TXNIP, HBE, HBG1, HBB, GATA1, and KLF1, the logarithmic transformations of RPKM values and relative copy numbers of qRT-PCR were compared [14]. Results of the present study revealed that RNA-Seq data correlated well with qRT-PCR data (p < 0.0001; R2 = 0.734; Fig. 1B).
2.2. Distinct gene expression patterns during differentiation and development
We used hierarchical cluster analysis to sort the expressed genes in these four cell types. Genes as well as samples with similar expression patterns were clustered together. The branch length between genes (Fig. 2A, left side) or samples (Fig. 2A, top) is proportional to their similarity in expression pattern (Fig. 2A). Among the four cell types, FLERs and PBERs were clustered together, indicating that they shared similar expression patterns. Furthermore, FLERs and PBERs clustered with ESERs before they clustered with HESCs.
Fig. 2.

Gene expression dynamics during differentiation. (A) Hierarchical clustering of genes expressed in HESC, ESER, FLER, and PBER cells. Each row represents a gene, and each column represents a cell type at different stages. Expression intensities are displayed from green (low expression) to red (high expression). Lines on the top and left represent the similarity between cell types and genes, respectively. Genes and cell types with the most similar expression profiles were clustered together with the shortest branches and represented in the dendrogram to illustrate their relationship. (B) Number of genes expressed in four cell types. All: genes expressed in at least one of the four cell types; not expressed: absent relative to “All”; uniquely expressed: expressed only in one cell type. (C) The total expression intensity of genes in four cell types. X-axis: four kinds of cell types; Y-axis: the expression intensity of all genes.
In addition, genes with similar expression patterns were also clustered together. As shown in Fig. 2A, we found that the majority of clustered genes were mainly down-regulated during erythroid differentiation and development. In contrast, fewer genes were developmentally up-regulated. Furthermore, some genes were up- or down-regulated at a specific stage (Fig. 2A).
We also compared the number of expressed genes and the expression intensity across the four cell types (Figs. 2B–C). In total, 23244 transcripts were expressed in at least one of the four cell types. Among these transcripts, three non-mutually exclusive groups were identified in each cell type: “expressed,” “not expressed,” and “uniquely expressed” (transcripts expressed by only one specific cell type). In total, 22072 “expressed” genes were detected in HESCs, which was the highest among the four cell types, followed by ESERs (18847), PBERs (15900), and FLERs (15863). Similarly, the number of “uniquely expressed” transcripts was the highest in HESCs (3614), compared with 401, 65, and 59 transcripts for ESERs, FLERs, and PBERs, respectively. GO enrichment analysis showed that multicellular organismal process, signaling and system development were significantly over-represented in uniquely expressed genes in HESCs, which was consistent with the properties of stem cells. The unique genes in ESERs were enriched in immune response and membrane-related functions. There were not significantly enriched categories in unique genes in FLERs and PBERs (Table S2). In contrast to “expressed” and “uniquely expressed” transcripts, the number of “not expressed” transcripts increased dramatically with the developmental stages (944, 4182, 7198, and 7162 for HESCs, ESERs, FLERs, and PBERs, respectively; Fig. 2B).
However, despite the highest number of expressed genes in HESCs, HESCs had the lowest total expression intensity among these four cell types. The highest expression intensity was detected in ESERs, which was 2.4-fold of that in HESCs (the sum of RPKM was 736388 and 1765840 in HESCs and ESERs, respectively). From ESERs to FLERs, the total expression intensity decreased by 42.1%, while a similar intensity was found between FLERs and PBERs (the sum of RPKM values was 921604 and 1025020 in FLERs and PBERs, respectively; Fig. 2C).
2.3. Differential expression of unique classes of genes during erythroid differentiation and development
Gene expression patterns were compared for the following three pairs: HESCs vs. ESERs, ESERs vs. FLERs, and FLERs vs. PBERs. Expression intensities were calculated by logarithmic transformation of RPKM values and compared. Using a 2-fold and p ≤ 0.01 cutoff for differential expression, genes were defined as up-regulated (U), down-regulated (D), or unchanged (flat, F) in each comparison. In total, 27 gene assemblies were thus identified on the basis of differential expression status of each gene (up-regulated, down-regulated, or flat) in each of the three comparisons (Fig. 3). These 27 assemblies were further combined into nine categories as follows: UXX, DXX, FXX, XUX, XDX, XFX, XXU, XXD, and XXF, with X representing Up-regulated, Down-regulated, or Flat. Then, the gene function in each category was evaluated using GO analysis (Table 1).
Fig. 3.

Quantification of dynamic transcriptome changes during erythroid differentiation. According to gene expression intensity, 27 patterns were identified. Capital letters represent the three transcriptome changes during erythroid differentiation and development, e.g., the first letter represents changes from HESCs to ESERs, the second one represents changes from ESERs to FLERs, and the third one represents changes from FLERs to PBERs. (U, up-regulated; D, down-regulated; and F, flat or unchanged). Each line represents the gene expression dynamics. We thank Wu JQ et al. [12] for the model.
Table 1.
GO enrichment of nine gene categories during the differentiation process.
| GO description | p-Value | |
|---|---|---|
| UXX | Erythrocyte differentiation | 1.38E–12 |
| Response to stress | 2.87E–10 | |
| Immune system development | 1.75E–08 | |
| Oxygen transporter activity | 8.00E–04 | |
| Regulation of erythrocyte differentiation | 9.15E–08 | |
| Erythrocyte homeostasis | 2.36E–12 | |
| Myeloid cell differentiation | 3.70E–12 | |
| Hematopoietic or lymphoid organ development | 2.93E–09 | |
| DXX | Nervous system development | 4.47E–39 |
| Cell adhesion | 6.65E–31 | |
| Anatomical structure morphogenesis | 7.01E–35 | |
| Cell projection | 5.01E–36 | |
| Synapse | 2.03E–26 | |
| FXX | Gene expression | 3.84E–07 |
| Translation | 5.22E–06 | |
| Primary metabolic process | 4.06E–06 | |
| Cellular metabolic process | 4.09E–07 | |
| Macromolecule metabolic process | 5.22E–06 | |
| XUX | Nuclear division | 1.21E–15 |
| Intracellular | 1.68E–24 | |
| Organelle | 3.30E–13 | |
| Structure-specific DNA binding | 2.00E–04 | |
| Cell cycle | 1.26E–23 | |
| Purine nucleotide binding | 7.00E–04 | |
| XDX | Regulation of cellular process | 6.35E–13 |
| Regulation of nitrogen compound metabolic process | 7.18E–12 | |
| Kinase binding | 1.32E–06 | |
| Cytoskeletal protein binding | 1.01E–07 | |
| XFX | Cell adhesion | 6.33E–08 |
| Biological adhesion | 6.33E–08 | |
| XXU | Receptor binding | 2.15E–02 |
| Membrane | 3.90E–03 | |
| Regulation of cellular metabolic process | 8.16E–05 | |
| Membrane raft | 4.30E–03 | |
| XXD | ncRNA metabolic process | 3.46E–38 |
| Organelle | 1.84E–81 | |
| Ribonucleoprotein complex biogenesis | 7.71E–35 | |
| mRNA metabolic process | 5.38E–47 | |
| XXF | Cell adhesion | 4.79E–17 |
| Intracellular | 2.03E–22 |
U, up-regulated; D, down-regulated; F, flat (<2-fold change); X, Up-regulated, Down-regulated, or Flat. UXX was assembled from UUU, UUD, UUF, UDU, UDD, UDF, UFU, UFD and UFF The other eight categories in Table 2 were assembled similarly.
We found that genes in the UXX category were significantly enriched in immune system development, hematopoietic or lymphoid organ development, erythrocyte homeostasis, and erythrocyte differentiation, such as HBZ, GATA1, TAL1 and KLF1, coinciding with the commitment of HESCs to hematopoietic/erythroid lineage. Genes involved in cell adhesion, cell projection, anatomical structure, and the nervous system were significantly enriched among down-regulated genes in HESC vs. ESER comparison (DXX), which is consistent with the fact that ESERs are unipotent, differentiated, non-adherent cells and HESCs are pluripotent stem cells. Pluripotency genes, such as POU5F1, NANOG, and SOX2 were down-regulated in ESER compared with HESC. Genes related to primary metabolic processes, macromolecule metabolic processes, cellular metabolic processes, RNA processing and translation, and gene expression were not significantly altered in ESERs compared with HESCs (FXX), suggesting that the primary metabolic function was not affected by lineage commitment. The ESER–FLER comparison revealed that in the XUX category, genes involved in intracellular activities, cell cycle, and cell division, such as spindle and kinetochore associated complex subunit 1 (SKA1), SKA3, cyclin B1 (CCNB1), CCNA2, anaphase-promoting complex subunit 11 (ANAPC11), cell division cycle associated 2 (CDCA2), and CDCA3 were enriched. In contrast, genes involved in the regulation of cell communication and cytoskeletal protein binding and those extrinsic to membrane were enriched in XDX. Interestingly, these genes included RAS p21 protein activator 3 (RASA3) and RASA-like 1 (RASAL1), both of which suppress the RAS signaling pathway, potentially inhibiting cell proliferation. In addition, genes within this category included several regulators for G protein signaling (RGS), including RGS5, RGS6, RGS10 as well as RGS14, all of which inactivate the G protein-coupled receptor signaling pathway. Down-regulation of negative regulators of the RAS signaling pathway and G protein signaling pathway suggests that FLERs have heightened sensitivity to extracellular signals and increased proliferation potential compared with ESERs. Genes involved in cell adhesion and biological adhesion were enriched in the XFX category, indicating that the adhesion properties may not be the major determinant that distinguishes ESERs from FLERs. Comparison between fetal and adult erythroid cells revealed that genes involved in membranes and organelles were enriched in XXU and XXD, respectively, indicating structural differences between these two populations (Tables 2 and S3). Interestingly, aquaporin 1 (AQP1) was found in the XXU category. Consistent with our finding, increased expression of AQP1 has been found when comparing adult erythrocytes with fetal erythrocytes [15]. Furthermore, BCL11A and SOX6 were found to be up-regulated in PBER cells in which adult beta globin (HBB) was highly expressed whereas embryonic epsilon (HBE1) and fetal gamma (HBG1 and HBG2) globin genes were down-regulated, in agreement with the important roles of BCL11A and SOX6 in mediating hemoglobin switching during ontogenesis [16–18]. The expression levels of genes mentioned above were summarized in Table S3. In addition, of the four cell populations studied here, the FLER vs. PBER comparison has been performed at the proerythroblast stage (day 5) by Xu and colleagues [19]. Despite the differences in culture media employed and in the length of culture (day 14 in our present study), a large number of shared up-regulated and down-regulated transcripts were identified when comparing our RNA-Seq dataset to the micro-array dataset by Xu et al. (Fig. S1 and Table S4). The genes discussed above such as AQP1 and BCL11A were among the differentially expressed genes identified in both datasets.
Table 2.
Top five functions enriched in UXX, XUX, and XXU.
| ID | Score | Focus molecules | Top function |
|---|---|---|---|
| UXX | |||
| 1 | 29 | 35 | Cellular growth and proliferation, hematological system development and function, organismal injury and abnormalities |
| 2 | 24 | 33 | Endocrine system disorder, metabolic disease, dermatological diseases and conditions |
| 3 | 19 | 30 | Cellular development, hematological system development and function, hematopoiesis |
| 4 | 12 | 16 | Cell morphology, cellular compromise, genetic disorder |
| 5 | 10 | 22 | Inflammatory response, cellular movement, hematological system development and function |
| XUX | |||
| 1 | 18 | 16 | RNA post-transcriptional modification, antigen presentation, cell-to-cell signaling and interaction |
| 2 | 14 | 14 | DNA replication, recombination, and repair, molecular transport, nucleic acid metabolism |
| 3 | 12 | 18 | Cellular development, cell-mediated immune response, cellular function and maintenance |
| 4 | 10 | 16 | Cell cycle, connective tissue development and function, gene expression |
| 5 | 9 | 15 | Cellular development, cellular growth and proliferation, cell cycle |
| XXU | |||
| 1 | 26 | 30 | Cell-to-cell signaling and interaction, tissue development, cellular growth and proliferation |
| 2 | 17 | 24 | Cancer, cellular development, hair and skin development and function |
| 3 | 14 | 22 | Cellular growth and proliferation, DNA replication, recombination, and repair, cardiovascular disease |
| 4 | 13 | 21 | Cellular growth and proliferation, cellular development, connective tissue development and function |
| 5 | 13 | 15 | Cellular assembly and organization, infection mechanism, cellular compromise |
2.4. Identification of gene regulatory networks and central nodes involved in erythroid differentiation and development
Up-regulated genes in HESC–ESER, ESER–FLER, and FLER–PBER comparisons were organized into interactome networks using IPA. The top five functional networks of each of the three comparisons (Table 2) were selected and combined into a bigger network based on the IPA Knowledge Base (Fig. 4). For each network, node-edge statistics were performed to identify central nodes (Table S5). In the HESC–ESER comparison, we found 17 central nodes (Fig. 4A). RELA (also known as NFKB3) is an important factor in NFκB signaling, which is involved in the control of a variety of cellular processes, including cell survival, proliferation and immune responses [20]. RUNX1 lies downstream of Notch signaling in zebrafish, which is essential for the induction of hematopoiesis [21]. RUNX1 knockout results in a complete absence of murine definitive hematopoiesis [22] and causes abnormal morphology in primitive erythrocytes [23]. MAPK14 (P38MAPK) controls erythroblast enucleation [24]. Foxo3 is required for the regulation of oxidative stress in erythropoiesis in mice [25] and Foxo3 knockdown in K562 and TF-1 cells led to a striking reduction in globin expression (unpublished data). VEGF, which promotes erythropoiesis of HESCs [26] was also identified as a central node. Furthermore, multiple genes identified as central nodes, such as RUNX1, RELA, and STAT are involved in the fms-like tyrosine kinase-3 (FLT3) signaling pathway, which plays an important role in the survival, proliferation and self-renewal of early hematopoietic progenitors [27,28] (Fig. 5A). In the ESER–FLER comparison, we identified 5 central nodes (Fig. 4B) and many of these genes are regulators of cell proliferation. PCNA (the Proliferating Cell Nuclear Antigen) and BIRC5 (also known as Survivin), both involved in facilitating cell proliferation, were up-regulated. In contrast, negative regulators of cell cycle progression, including CDKN1A (P21, Cip1) and CDKN2A (Fig. 5B), were down-regulated. These data are consistent with our GO analysis that FLERs were actively cycling as compared to ESERs. In the FLER–PBER comparison, we identified 9 central nodes (Fig. 4C). Several of these central nodes, such as CD44, ITGB1, MAPK1 (ERK2) and MAPK3 (ERK1), are molecules involved in cell–cell interaction/adhesion/migration or its downstream pathways (Fig. 5C). CD44 has been used to separate murine [29] and human [30] erythroid precursors of different maturation stages. Integrin beta 1 (ITGB1) has been shown to be indispensable for adult mice to recover from hemolytic stress [31] and may also be important for the proliferation and survival of murine FL erythroid progenitors [32]. The implication of differential expression of these adhesion molecules in FLERs vs. PBERs is not clear but may be reflective of the different properties of erythroid niches in fetal vs. adult stages. The expression levels of these central nodes were summarized in Table S6. Deletion of any of these nodes would disturb or destroy the network. The differential expression of some of these identified central nodes was further validated using qRT-PCR and the results were in line with the RNA-Seq data (Fig. 6).
Fig. 4.

Gene networks and central nodes involved in erythroid differentiation and development. Genes involved in the three stage transitions were analyzed using Ingenuity Pathway Analysis (IPA). Orange gene symbols indicate genes that appeared in UXX, XUX, or XXU. White gene symbols indicate genes not identified in UXX, XUX, or XXU. Genes with a score N2-fold the average score of the network are defined as central nodes. (A) A gene network of 17 central nodes constructed using genes up-regulated in ESERs compared with HESCs (UXX). (B) Network analysis of up-regulated genes in FLERs vs. ESERs, with 5 central nodes (XUX). (C) A gene network constructed using genes up-regulated in PBERs vs. FLERs, with 9 central nodes (XXU).
Fig. 5.

Pathways activated in each comparison. Pathways activated in the three stage transitions containing central nodes were identified using IPA. (A) Activation of the FLT3 signaling pathway in ESER cells compared with that in HESCs. (B) Activation of cyclins and cell cycle regulation pathway in FLER cells compared with that in ESER cells. (C) Activation of ILK signaling pathway in PBER cells compared with that in FLER cells. Red and green represent up-regulated and down-regulated genes, respectively. The extent of regulation is based on the color grade. Symbols with gradient colors indicate a gene family whose members change in different degree.
Fig. 6.

The relative expression levels of selected central nodes in four cell populations as determined by qRT-PCR.
3. Discussion
Recently, studies have been conducted to analyze the dynamic changes in the transcriptome of mouse primitive erythroid progenitors from the yolk sac [33] and human adult erythroid progenitors from mobilized PB [34,35] over the course of their differentiation and terminal maturation. A host of genes with unknown functions in the terminal maturation of erythroblasts have been identified which may facilitate future functional studies of terminal erythropoiesis. In this study, a different approach was taken and comprehensive analysis was performed to compare the transcriptome of erythroblasts of different developmental stages rather than of different maturity. In addition, the transcriptome of HESCs and their erythroid progeny (ESERs) was also compared.
With the ability to self-renew indefinitely and also differentiate into cells of three germ layers, HESCs has been studied extensively to map the regulatory network contributing to their stemness [36,37]. Consistent with previous findings when comparing undifferentiated HESCs and differentiated cells [38,39], we found that HESCs expressed more genes globally than differentiated ESERs, although at lower overall expression intensity. The global transcription hyperactivity has been proposed to contribute to the plasticity of ESCs [40]. Upon differentiation, a large portion of these genes was turned off which included transcription factors critical to pluripotency, such as POU5F1, SOX2, and NANOG (Table S3). This large number of genes was replaced by fewer, yet highly expressed, erythroid/hematopoietic lineage-specific genes, such as GATA1, KLF1, and TAL1. Network analysis between these two cell types also identified factors known to be important for erythropoiesis, such as RUNX1 and MAPK14 [21,24], as well as VEGF, which promotes erythropoiesis in HESCs [26], to be the central nodes.
Since HESCs are fundamentally different from erythroid cells, it is not surprising that HESCs had a unique gene expression pattern when compared to the three erythroid populations (Fig. 2A). However, examination of the transcriptome of these three erythroid populations also revealed a large number of genes that were differentially expressed. These differences may have stemmed from the developmental stages that these erythroid cells were situated in. As PBERs clustered with FLERs before they clustered with ESERs (Fig. 2A), it indicates that ESERs were less similar to these two definitive stage erythroid populations, than PBERs and FLERs were to each other, despite the definitive morphology of ESERs [41]. This is in accordance with the finding that progeny of HESCs and HiPSCs, including neural, hepatic, and mesenchymal lineages, are developmentally immature and reflective of early human development (<6 week gestation), compared with their adult-derived counterparts [42]. Furthermore, a list of genes including IL8, several MHC class molecules, and Hb molecules have been found to be differentially expressed by HESC-derived CD34+ CD38− cells and by CD34+ CD38− cells originating from adult tissue [43]. Coincidentally, the same patterns were found when comparing the expression of these genes in ESERs to that in PBERs (Table S3). These data suggest that the progeny may retain certain gene expression signature of their corresponding precursors and/or certain developmental stage specific genes may already be primed in the multipotent progenitor/precursor stage. Finally, as several molecules involved in cell–cell interaction/adhesion/migration or its downstream pathway constituted the central nodes in FLER–PBER comparison, it underscores the potential differences in the erythroid niches at the fetal and adult stages that require further investigations.
In addition, the differences observed between the three erythroid cell groups may be due to the different degrees of maturation attained by the three erythroid populations [35]. Several cell proliferation-related genes (including CCNB1, CCNA2, and CDCA3), and membrane and organelle-related genes (such as NOP16 and GOLM1) that are known to be down-regulated during erythroid maturation [34] had notably higher expression intensity in FLERs than in ERERS or PBERs. This unique expression profile may suggest that FLERs used in this study were potentially less terminally differentiated than were ESERs or PBERs, if the gene expression patterns shift similarly during erythroid differentiation/maturation regardless of their developmental stages. Coincidentally, CD71 and CD36, two markers whose expression decreases during erythroid maturation [44], were found to be most highly expressed by FLERs as compared to ESERs and PBERs (Fig. S2). On the other hand, many genes, such as ITGB1, GGA1, TMC8, AQP1, CTNNB1, and RGS6 whose expressions remain constant during erythroid differentiation [34], yet were identified to be differentially expressed in the three erythroid populations in our study, may truly reflect developmentally-regulated genes. To better address this issue, sub-fractionating of erythroid cells from these three developmentally distinct stages into separate differentiation stages may be required.
Our study has confirmed the expression status of various well-validated critical factors for HESCs pluripotency as well as for erythroid differentiation and development. In addition, our comprehensive analyses provide important documentation of differentially expressed genes among these populations that are previously unknown. Although investigating erythropoiesis/hematopoiesis using HESCs and HiPSCs will continue to provide invaluable insights into early events of human onto-genesis, it is crucial to keep in mind, when employing them for disease modeling, that ESERs and other HESC-/HiPSC-derived progeny are developmentally immature and may not properly represent their adult counterparts. Moreover, given that the transcriptome of ESERs is substantially different from that of PBERs, the perturbance in transcription network may result in the presentation of unusual blood group pheno-types, as has previously been documented with KLF1 mutations [45]. This may have implication in the potential clinical usefulness of erythroid cells derived from HESCs or HiPSCs as blood concentrates. However, it is recently reported that erythroid cells derived from HiPSCs can reach complete terminal maturation in vivo, including the fetal to adult globin switch [46], whether the transcriptome of these HESC-/HiPSC-derived erythroid precursors, once exposed to the in vivo environment, would become more similar to their adult counterparts remain to be evaluated.
4. Materials and methods
4.1. Cell cultures and erythroid differentiation
ESERs were generated from human HESC line H1 (NIH code WA01, WiCell, Madison, WI) as described previously, with slight modifications [47]. In brief, confluent HESCs cultured on murine embryonic fibroblast feeder layers were harvested by dispase (Invitrogen, Carlsbad, CA) treatment. HESC clumps were transferred into an embryoid body formation medium composed of Iscove MEM (IMDM; Hyclone, Logan, UT), 15% ES-qualified FBS (Invitrogen), 10% protein-free hybridoma medium II (PFHM-II; Invitrogen), 300 μg/mL iron-saturated human transferrin (Sigma-Aldrich, St. Louis, MO), 50 μg/mL ascorbic acid (Sigma-Aldrich), 0.1 mM β-mercaptoethanol, 1× penicillin/streptomycin, and 2 mM l-glutamine (Mediatech, Herndon, VA). After 7 days, single cell suspensions were obtained by digesting embryoid bodies with a 1:1 mixture of dispase (1.2U/mL) and collagenase IA (10%) (Sigma-Aldrich), embryoid bodies were forced through a 21 G needle, and then were subjected to a second digestion with Accutase (Innovative Cell Technology, San Diego, CA). Next, cell suspensions were placed in an erythroid induction medium composed of Stemline hematopoietic stem cell growth and expansion medium (Sigma-Aldrich) supplemented with 2 mM l-glutamine, 1× penicillin/streptomycin, 0.1 mM MEM nonessential amino acids (all from Mediatech), 0.1 mM β-mercaptoethanol, 200 μg/mL iron-saturated transferrin, 10 μM ethanolamine, 10 μg/mL insulin (all from Sigma-Aldrich), 6 U/mL erythropoietin, 50 ng/mL stem cell factor (both from Amgen, Thousand Oakes, CA), 20 ng/mL interleukin-3, 20 ng/mL interleukin-6, 40 ng/mL insulin-like growth factor-1, 10 ng/mL vascular endothelial growth factor (all from Peprotech, Rocky Hill, NJ), 5% protein-free hybridoma medium, 1× insulin–transferrin–selenium (both from Invitrogen), and 1× EX-CYTE (Millipore, Billerica, MA). Fourteen days after culture, staining with anti-glycophorin-A antibody (DAKO, Glostrup, Denmark) revealed that >95% of cells were erythroid cells [11]. These cells were harvested for analyses.
CD34+ cells from healthy volunteer-donor mobilized PB (MPB CD34+ cells) were obtained from the NIH repository (Fred Hutchinson Cancer Research Center) and FL cells (50–100-day gestation) were obtained from the fetal tissue repository (University of Washington Birth Defects Research Laboratory), both with permission of the University of Washington Institutional Review Board. MPB CD34+ cells and dissociated FL cells were cultured in the same erythroid-inducing medium as described above to generate adult- and fetal-type erythroid cells. At the end of the culture, cell composition was determined by flow cytometry [11]. ESERs and PBERs were >90% positive for glycophorin-A [11] and were used as is for subsequent gene expression analysis. Because only ~50% of cells of FL culture expressed glycophorin-A, FLERs were enriched to over 95% purity using MACS system as per the manufacturer's instruction (Miltenyi Biotec, Auburn, CA). The surface expression of CD71 or CD36 by glycophorin-A+ erythroblasts was also analyzed by flow cytometry using Fluorescein isothiocyanate-conjugated anti-CD71 or Allophycocyanin-conjugated anti-CD36 antibodies (both from BD Biosciences, San Jose, CA). Cells were acquired using FACScalibur (BD Biosciences), and the results were analyzed with Flowjo X (Tree Star Inc., Ashland, OR). Gatings were set according to isotype controls.
4.2. RNA extraction and cDNA library preparation
Total RNA was extracted from HESC, ESER, FLER, and PBER cells using TRIzol® Reagent (Invitrogen) as per the manufacturer's instructions. HESC, ESER, and FLER cells were each derived from one batch of culture whereas two batches of PBER cultures were obtained. Using the Ribosomal RNA Depletion Kit (ABI, Carlsbad, CA), 18S rRNA and 28S rRNA were rapidly depleted from total RNA before cDNA library was constructed using the SOLiD™ Whole Transcriptome Analysis Kit (ABI).
4.3. Transcriptome sequencing
Transcriptome sequencing was conducted using the Applied Bio-systems SOLiD System according to the manufacturer's protocol, and the read length was 50 bp. The sequencing read data can be accessed in the Gene Expression Omnibus (GEO) database under the accession ID GSE32991.
4.4. Quantitative real-time PCR (qRT-PCR)
Total RNA was extracted as described above and reverse transcribed using the RevertAid™ First Strand cDNA Synthesis Kit (Fermentas, Glen Burnie, MD). qRT-PCR was performed on the CFX96 Real-Time PCR Detection System (Bio-Rad, Hercules, CA) using Maxima® SYBR Green/ROX qPCR Master Mix (Fermentas). Primers were designed using Primer 5 and PrimerBank (http://pga.mgh.harvard.edu/primerbank/index.html). Transcript levels were normalized to that of glyceraldehyde 3-phosphate dehydrogenase. The samples used for qRT-PCR were the same ones used for RNA-Seq in all groups except for PBER cells, which were obtained from a separate batch of culture.
4.5. Gene expression analysis
Corona_lite_plus (version 4.2.1) software (ABI) was used to map our sequence reads to the human reference sequence (hg18). Reads of rRNA were filtered at the beginning of read mapping, with a full length of 50bp. Subsequently, the remaining reads were mapped to the reference with lengths of 45bp and 40bp. Up to five mismatches were allowed at each mapping step. Reads mapped to unique loci and a fraction of those mapped to multiple loci (2–10) were used for further analysis.
To calculate gene expression intensity, the read counts were normalized to reads per kilobase of exon model per million mapped reads (RPKM) according to the gene length and total mapped reads [13]. To avoid background noise disturbance accompanying sequencing experiments and to ensure a reliable output, spots where RPKM was <0.01 (approximately five corresponding reads on average when the signal could not be detected using qRT-PCR) for genes in all four libraries were removed from analyses.
4.6. Differentially expressed gene analysis
For the RNA-Seq data, we used DEGseq [48] to identify differentially expressed genes (DEG) between samples based on the following criteria: p≤0.01 and fold change≥2. For the microarray data from public resource, we used geo2R on NCBI to identify DEG based on the criteria: FDR ≤ 0.05.
4.7. Cluster analysis
Logarithmic transformation to gene expression intensity was executed before clustering. Average linkage hierarchical clustering was performed in this study using Pearson distance as the distance measure between genes and samples. Computation and visualization were achieved using heatmap plus package in R.
4.8. Gene Ontology (GO) analysis
WebGestalt, a “Web-based Gene SeT AnaLysis Toolkit,” was used for GO analysis with the following parameters: “hypergenometric distribution” as statistical method, “BH” as multiple test adjustment, “top 10” as the significance level, and “2” as the minimum number of genes for a category.
4.9. Gene network analysis
Network analyses were performed using Ingenuity Pathways Analysis (IPA, Ingenuity® Systems, www.ingenuity.com). Ingenuity Knowledge Base is the largest manually curated database based on previous scientific literature [49]. From a list of genes with particular expression features, IPA produces networks according to its algorithm. The significance of the network is calculated using Fisher's exact test. In the network, the score of one node is obtained using the following equation:
where kin is the number of genes regulating the gene examined, kout is the number of genes regulated by the gene examined, and knd is the number of genes without affirmatory regulatory directions.k−in, k−out, and k−nd represent the average values of kin, kout, and knd, respectively. Genes with a ratio of score/ score− >2 and fold change>2 are defined as central nodes.
Supplementary Material
Acknowledgments
The authors thank Dr. Yuxia Jiao for critically reading the manuscript. This research was supported by the “Strategic Priority Research Program” of the Chinese Academy of Sciences, Stem Cell and Regenerative Medicine Research (XDA01040405 to X.F.); the National Key Scientific Instrument and Equipment Development Projects of China (2011YQ03013404 to X.F.); the National Basic Research Program (973 Program) (2006CB910403 to S.H.); the National Natural Science Foundation of China (31371300 to Z.Z. and 31100924 to Y.L.); and the National Institute of Health grants of United States (DK077864 to K-H.C.).
Footnotes
Supplementary data to this article can be found online at http://dx.doi.org/10.1016/j.ygeno.2013.09.005.
Conflict of interest The authors declare no competing financial interests.
References
- [1].Palis J. Ontogeny of erythropoiesis. Curr. Opin. Hematol. 2008;15:155–161. doi: 10.1097/MOH.0b013e3282f97ae1. [DOI] [PubMed] [Google Scholar]
- [2].Schechter AN. Hemoglobin research and the origins of molecular medicine. Blood. 2008;112:3927–3938. doi: 10.1182/blood-2008-04-078188. [DOI] [PMC free article] [PubMed] [Google Scholar]
- [3].Tsiftsoglou AS, Vizirianakis IS, Strouboulis J. Erythropoiesis: model systems, molecular regulators, and developmental programs. IUBMB Life. 2009;61:800–830. doi: 10.1002/iub.226. [DOI] [PubMed] [Google Scholar]
- [4].Wilber A, Nienhuis AW, Persons DA. Transcriptional regulation of fetal to adult hemoglobin switching: new therapeutic opportunities. Blood. 2011;117:3945–3953. doi: 10.1182/blood-2010-11-316893. [DOI] [PMC free article] [PubMed] [Google Scholar]
- [5].Fukuda M, Fukuda MN, Papayannopoulou T, Hakomori S. Membrane differentiation in human erythroid cells: unique profiles of cell surface glycoproteins expressed in erythroblasts in vitro from three ontogenic stages. Proc. Natl. Acad. Sci. U. S. A. 1980;77:3474–3478. doi: 10.1073/pnas.77.6.3474. [DOI] [PMC free article] [PubMed] [Google Scholar]
- [6].Chang KH, Bonig H, Papayannopoulou T. Generation and characterization of erythroid cells from human embryonic stem cells and induced pluripotent stem cells: an overview. Stem Cells Int. 2011;2011:791604. doi: 10.4061/2011/791604. [DOI] [PMC free article] [PubMed] [Google Scholar]
- [7].Ma F, Ebihara Y, Umeda K, Sakai H, Hanada S, Zhang H, Zaike Y, Tsuchida E, Nakahata T, Nakauchi H, Tsuji K. Generation of functional erythrocytes from human embryonic stem cell-derived definitive hematopoiesis. Proc. Natl. Acad. Sci. U. S. A. 2008;105:13087–13092. doi: 10.1073/pnas.0802220105. [DOI] [PMC free article] [PubMed] [Google Scholar]
- [8].Lapillonne H, Kobari L, Mazurier C, Tropel P, Giarratana MC, Zanella-Cleon I, Kiger L, Wattenhofer-Donze M, Puccio H, Hebert N, Francina A, Andreu G, Viville S, Douay L. Red blood cell generation from human induced pluripotent stem cells: perspectives for transfusion medicine. Haematologica. 2010;95:1651–1659. doi: 10.3324/haematol.2010.023556. [DOI] [PMC free article] [PubMed] [Google Scholar]
- [9].Lu SJ, Feng Q, Park JS, Vida L, Lee BS, Strausbauch M, Wettstein PJ, Honig GR, Lanza R. Biologic properties and enucleation of red blood cells from human embryonic stem cells. Blood. 2008;112:4475–4484. doi: 10.1182/blood-2008-05-157198. [DOI] [PMC free article] [PubMed] [Google Scholar]
- [10].Peyrard T, Bardiaux L, Krause C, Kobari L, Lapillonne H, Andreu G, Douay L. Banking of pluripotent adult stem cells as an unlimited source for red blood cell production: potential applications for alloimmunized patients and rare blood challenges. Transfus. Med. Rev. 2011;25:206–216. doi: 10.1016/j.tmrv.2011.01.002. [DOI] [PubMed] [Google Scholar]
- [11].Chang KH, Fang X, Wang H, Huang A, Cao H, Yang Y, Bonig H, Stamatoyannopoulos JA, Papayannopoulou T. Epigenetic modifications and chromosome conformations of the beta globin locus throughout development. Stem Cell Rev. 2013;9:397–407. doi: 10.1007/s12015-012-9355-x. [DOI] [PMC free article] [PubMed] [Google Scholar]
- [12].Wu JQ, Habegger L, Noisa P, Szekely A, Qiu C, Hutchison S, Raha D, Egholm M, Lin H, Weissman S, Cui W, Gerstein M, Snyder M. Dynamic transcriptomes during neural differentiation of human embryonic stem cells revealed by short, long, and paired-end sequencing. Proc. Natl. Acad. Sci. U. S. A. 2010;107:5254–5259. doi: 10.1073/pnas.0914114107. [DOI] [PMC free article] [PubMed] [Google Scholar]
- [13].Mortazavi A, Williams BA, McCue K, Schaeffer L, Wold B. Mapping and quantifying mammalian transcriptomes by RNA-Seq. Nat. Methods. 2008;5:621–628. doi: 10.1038/nmeth.1226. [DOI] [PubMed] [Google Scholar]
- [14].Oliver H, Orsi R, Ponnala L, Keich U, Wang W, Sun Q, Cartinhour S, Filiatrault M, Wiedmann M, Boor K. Deep RNA sequencing of L. monocytogenes reveals overlapping and extensive stationary phase and sigma B-dependent transcriptomes, including multiple highly transcribed noncoding RNAs. BMC Genomics. 2009;10:641. doi: 10.1186/1471-2164-10-641. [DOI] [PMC free article] [PubMed] [Google Scholar]
- [15].Agre P, Smith BL, Baumgarten R, Preston GM, Pressman E, Wilson P, Illum N, Anstee DJ, Lande MB, Zeidel ML. Human red cell Aquaporin CHIP. II. Expression during normal fetal development and in a novel form of congenital dyserythropoietic anemia. J. Clin. Invest. 1994;94:1050–1058. doi: 10.1172/JCI117419. [DOI] [PMC free article] [PubMed] [Google Scholar]
- [16].Xu J, Sankaran VG, Ni M, Menne TF, Puram RV, Kim W, Orkin SH. Transcriptional silencing of {gamma}-globin by BCL11A involves long-range interactions and cooperation with SOX6. Genes Dev. 2010;24:783–798. doi: 10.1101/gad.1897310. [DOI] [PMC free article] [PubMed] [Google Scholar]
- [17].Yi Z, Cohen-Barak O, Hagiwara N, Kingsley PD, Fuchs DA, Erickson DT, Epner EM, Palis J, Brilliant MH. Sox6 directly silences epsilon globin expression in de-finitive erythropoiesis. PLoS Genet. 2006;2:e14. doi: 10.1371/journal.pgen.0020014. [DOI] [PMC free article] [PubMed] [Google Scholar]
- [18].Sankaran VG, Xu J, Ragoczy T, Ippolito GC, Walkley CR, Maika SD, Fujiwara Y, Ito M, Groudine M, Bender MA, Tucker PW, Orkin SH. Developmental and species-divergent globin switching are driven by BCL11A. Nature. 2009;460:1093–1097. doi: 10.1038/nature08243. [DOI] [PMC free article] [PubMed] [Google Scholar]
- [19].Xu J, Shao Z, Glass K, Bauer DE, Pinello L, Van Handel B, Hou S, Stamatoyannopoulos JA, Mikkola HK, Yuan GC, Orkin SH. Combinatorial assembly of developmental stage-specific enhancers controls gene expression programs during human erythropoiesis. Dev. Cell. 2012;23:796–811. doi: 10.1016/j.devcel.2012.09.003. [DOI] [PMC free article] [PubMed] [Google Scholar]
- [20].Gutierrez H, Hale VA, Dolcet X, Davies A. NF-kappaB signalling regulates the growth of neural processes in the developing PNS and CNS. Development. 2005;132:1713–1726. doi: 10.1242/dev.01702. [DOI] [PubMed] [Google Scholar]
- [21].Orkin SH, Zon LI. Hematopoiesis: an evolving paradigm for stem cell biology. Cell. 2008;132:631–644. doi: 10.1016/j.cell.2008.01.025. [DOI] [PMC free article] [PubMed] [Google Scholar]
- [22].Yokomizo T, Ogawa M, Osato M, Kanno T, Yoshida H, Fujimoto T, Fraser S, Nishikawa S, Okada H, Satake M, Noda T, Ito Y. Requirement of Runx1/AML1/PEBP2 alphaB for the generation of haematopoietic cells from endothelial cells. Genes Cells. 2001;6:13–23. doi: 10.1046/j.1365-2443.2001.00393.x. [DOI] [PubMed] [Google Scholar]
- [23].Yokomizo T, Hasegawa K, Ishitobi H, Osato M, Ema M, Ito Y, Yamamoto M, Takahashi S. Runx1 is involved in primitive erythropoiesis in the mouse. Blood. 2008;111:4075–4080. doi: 10.1182/blood-2007-05-091637. [DOI] [PubMed] [Google Scholar]
- [24].Schultze SM, Mairhofer A, Li D, Cen J, Beug H, Wagner EF, Hui L. p38alpha controls erythroblast enucleation and Rb signaling in stress erythropoiesis. Cell Res. 2012;22:539–550. doi: 10.1038/cr.2011.159. [DOI] [PMC free article] [PubMed] [Google Scholar]
- [25].Marinkovic D, Zhang X, Yalcin S, Luciano JP, Brugnara C, Huber T, Ghaffari S. Foxo3 is required for the regulation of oxidative stress in erythropoiesis. J. Clin. Invest. 2007;117:2133–2144. doi: 10.1172/JCI31807. [DOI] [PMC free article] [PubMed] [Google Scholar]
- [26].Cerdan C, Rouleau A, Bhatia M. VEGF-A165 augments erythropoietic development from human embryonic stem cells. Blood. 2004;103:2504–2512. doi: 10.1182/blood-2003-07-2563. [DOI] [PubMed] [Google Scholar]
- [27].Lavagna-Sevenier C, Marchetto S, Birnbaum D, Rosnet O. FLT3 signaling in hematopoietic cells involves CBL, SHC and an unknown P115 as prominent tyrosine-phosphorylated substrates. Leukemia. 1998;12:301–310. doi: 10.1038/sj.leu.2400921. [DOI] [PubMed] [Google Scholar]
- [28].Mizuki M, Fenski R, Halfter H, Matsumura I, Schmidt R, Muller C, Gruning W, Kratz-Albers K, Serve S, Steur C, Buchner T, Kienast J, Kanakura Y, Berdel WE, Serve H. Flt3 mutations from patients with acute myeloid leukemia induce transformation of 32D cells mediated by the Ras and STAT5 pathways. Blood. 2000;96:3907–3914. [PubMed] [Google Scholar]
- [29].Chen K, Liu J, Heck S, Chasis JA, An X, Mohandas N. Resolving the distinct stages in erythroid differentiation based on dynamic changes in membrane protein expression during erythropoiesis. Proc. Natl. Acad. Sci. U. S. A. 2009;106:17413–17418. doi: 10.1073/pnas.0909296106. [DOI] [PMC free article] [PubMed] [Google Scholar]
- [30].Bhagia P, Liu J, Mannava K, Narla M, An X. Dynamics of membrane protein expression during human erythropoiesis: resolving distinct maturational stages of erythroid cells. ASH Annual Meeting Abstracts.2010. p. 811. [Google Scholar]
- [31].Ulyanova T, Jiang Y, Padilla S, Nakamoto B, Papayannopoulou T. Combinatorial and distinct roles of alpha(5) and alpha(4) integrins in stress erythropoiesis in mice. Blood. 2011;117:975–985. doi: 10.1182/blood-2010-05-283218. [DOI] [PMC free article] [PubMed] [Google Scholar]
- [32].Eshghi S, Vogelezang MG, Hynes RO, Griffith LG, Lodish HF. Alpha4beta1 integrin and erythropoietin mediate temporally distinct steps in erythropoiesis: integrins in red cell development. J. Cell Biol. 2007;177:871–880. doi: 10.1083/jcb.200702080. [DOI] [PMC free article] [PubMed] [Google Scholar]
- [33].Isern J, He Z, Fraser ST, Nowotschin S, Ferrer-Vaquer A, Moore R, Hadjantonakis AK, Schulz V, Tuck D, Gallagher PG. Single-lineage transcriptome analysis reveals key regulatory pathways in primitive erythroid progenitors in the mouse embryo. Blood. 2011;117:4924–4934. doi: 10.1182/blood-2010-10-313676. [DOI] [PMC free article] [PubMed] [Google Scholar]
- [34].Merryweather-Clarke AT, Atzberger A, Soneji S, Gray N, Clark K, Waugh C, McGowan SJ, Taylor S, Nandi AK, Wood WG, Roberts DJ, Higgs DR, Buckle VJ, Robson KJ. Global gene expression analysis of human erythroid progenitors. Blood. 2011;117:e96–e108. doi: 10.1182/blood-2010-07-290825. [DOI] [PubMed] [Google Scholar]
- [35].Li B, Ding L, Li W, Story MD, Pace BS. Characterization of the transcriptome profiles related to globin gene switching during in vitro erythroid maturation. BMC Genomics. 2012;13:153. doi: 10.1186/1471-2164-13-153. [DOI] [PMC free article] [PubMed] [Google Scholar]
- [36].Brandenberger R, Wei H, Zhang S, Lei S, Murage J, Fisk GJ, Li Y, Xu C, Fang R, Guegler K. Transcriptome characterization elucidates signaling networks that control human ES cell growth and differentiation. Nat. Biotechnol. 2004;22:707–716. doi: 10.1038/nbt971. [DOI] [PubMed] [Google Scholar]
- [37].Kolle G, Shepherd JL, Gardiner B, Kassahn KS, Cloonan N, Wood DLA, Nourbakhsh E, Taylor DF, Wani S, Chy HS. Deep-transcriptome and ribonome sequencing redefines the molecular networks of pluripotency and the extracellular space in human embryonic stem cells. Genome Res. 2011;21:2014–2025. doi: 10.1101/gr.119321.110. [DOI] [PMC free article] [PubMed] [Google Scholar]
- [38].Abeyta MJ, Clark AT, Rodriguez RT, Bodnar MS, Pera RAR, Firpo MT. Unique gene expression signatures of independently-derived human embryonic stem cell lines. Hum. Mol. Genet. 2004;13:601–608. doi: 10.1093/hmg/ddh068. [DOI] [PubMed] [Google Scholar]
- [39].Eckfeldt CE, Mendenhall EM, Verfaillie CM. The molecular repertoire of the `almighty' stem cell. Nat. Rev. Mol. Cell Biol. 2005;6:726–737. doi: 10.1038/nrm1713. [DOI] [PubMed] [Google Scholar]
- [40].Efroni S, Duttagupta R, Cheng J, Dehghani H, Hoeppner DJ, Dash C, Bazett-Jones DP, Le Grice S, McKay RDG, Buetow KH. Global transcription in pluripotent embryonic stem cells. Cell stem cell. 2008;2:437–447. doi: 10.1016/j.stem.2008.03.021. [DOI] [PMC free article] [PubMed] [Google Scholar]
- [41].Chang KH, Nelson AM, Cao H, Wang L, Nakamoto B, Ware CB, Papayannopoulou T. Definitive-like erythroid cells derived from human embryonic stem cells coexpress high levels of embryonic and fetal globins with little or no adult globin. Blood. 2006;108:1515–1523. doi: 10.1182/blood-2005-11-011874. [DOI] [PMC free article] [PubMed] [Google Scholar]
- [42].Patterson M, Chan DN, Ha I, Case D, Cui Y, Van Handel B, Mikkola HK, Lowry WE. Defining the nature of human pluripotent stem cell progeny. Cell Res. 2012;22:178–193. doi: 10.1038/cr.2011.133. [DOI] [PMC free article] [PubMed] [Google Scholar]
- [43].Lu SJ, Li F, Vida L, Honig GR. CD34+CD38− hematopoietic precursors derived from human embryonic stem cells exhibit an embryonic gene expression pattern. Blood. 2004;103:4134–4141. doi: 10.1182/blood-2003-10-3575. [DOI] [PubMed] [Google Scholar]
- [44].Hu JP, Liu J, Xue FM, Halverson G, Reid M, Guo AQ, Chen LX, Raza A, Galili N, Jaffray J, Lane J, Chasis JA, Taylor N, Mohandas N, An XL. Isolation and functional characterization of human erythroblasts at distinct stages: implications for understanding of normal and disordered erythropoiesis in vivo. Blood. 2013;121:3246–3253. doi: 10.1182/blood-2013-01-476390. [DOI] [PMC free article] [PubMed] [Google Scholar]
- [45].Singleton BK, Burton NM, Green C, Brady RL, Anstee DJ. Mutations in EKLF/KLF1 form the molecular basis of the rare blood group In(Lu) phenotype. Blood. 2008;112:2081–2088. doi: 10.1182/blood-2008-03-145672. [DOI] [PubMed] [Google Scholar]
- [46].Kobari L, Yates F, Oudrhiri N, Francina A, Kiger L, Mazurier C, Rouzbeh S, El-Nemer W, Hebert N, Giarratana MC, Francois S, Chapel A, Lapillonne H, Luton D, Bennaceur-Griscelli A, Douay L. Human induced pluripotent stem cells can reach complete terminal maturation: in vivo and in vitro evidence in the erythropoietic differentiation model. Haematologica. 2012;97:1795–1803. doi: 10.3324/haematol.2011.055566. [DOI] [PMC free article] [PubMed] [Google Scholar]
- [47].Chang KH, Nelson AM, Fields PA, Hesson JL, Ulyanova T, Cao H, Nakamoto B, Ware CB, Papayannopoulou T. Diverse hematopoietic potentials of five human embryonic stem cell lines. Exp. Cell Res. 2008;314:2930–2940. doi: 10.1016/j.yexcr.2008.07.019. [DOI] [PMC free article] [PubMed] [Google Scholar]
- [48].Wang L, Feng Z, Wang X, Wang X, Zhang X. DEGseq: an R package for identifying differentially expressed genes from RNA-Seq data. Bioinformatics. 2010;26:136–138. doi: 10.1093/bioinformatics/btp612. [DOI] [PubMed] [Google Scholar]
- [49].Calvano SE, Xiao W, Richards DR, Felciano RM, Baker HV, Cho RJ, Chen RO, Brownstein BH, Cobb JP, Tschoeke SK, Miller-Graziano C, Moldawer LL, Mindrinos MN, Davis RW, Tompkins RG, Lowry SF. A network-based analysis of systemic inflammation in humans. Nature. 2005;437:1032–1037. doi: 10.1038/nature03985. [DOI] [PubMed] [Google Scholar]
Associated Data
This section collects any data citations, data availability statements, or supplementary materials included in this article.