

Abstract
Half of all human transcription factors are zinc finger proteins and yet very little is known concerning the biological role of the majority of these factors. In particular, very few genome-wide studies of the in vivo binding of zinc finger factors have been performed. Based on in vitro studies and other methods that allow selection of high affinity-binding sites in artificial conditions, a zinc finger code has been developed that can be used to compose a putative recognition motif for a particular zinc finger factor (ZNF). Theoretically, a simple bioinformatics analysis could then predict the genomic locations of all the binding sites for that ZNF. However, it is unlikely that all of the sequences in the human genome having a good match to a predicted motif are in fact occupied in vivo (due to negative influences from repressive chromatin, nucleosomal positioning, overlap of binding sites with other factors, etc). A powerful method to identify in vivo binding sites for transcription factors on a genome-wide scale is the chromatin immunoprecipitation (ChIP) assay, followed by hybridization of the precipitated DNA to microarrays (ChIP-chip) or by high throughput DNA sequencing of the sample (ChIP-seq). Such comprehensive in vivo binding studies would not only identify target genes of a particular zinc finger factor, but also provide binding motif data that could be used to test the validity of the zinc finger code. This chapter describes in detail the steps needed to prepare ChIP samples and libraries for high throughput sequencing using the Illumina GA2 platform and includes descriptions of quality control steps necessary to ensure a successful ChIP-seq experiment.
Keywords: Zinc fingers, chromatin immunoprecipitation, ChIP-seq, next generation sequencing
1. Introduction
Half of all human transcription factors are zinc finger (ZF) proteins and yet very little is known concerning the biological role of the majority of these factors. The ZF transcription factors have evolved from a few ancestral genes, by diverging mainly in the number and sequence of their finger domains (1). Rapid expansion of the ZF family has occurred in the primate lineage and a large number of human ZF genes have no mouse ortholog, leading to speculation that ZF proteins could be important regulators of primate-specific transcription networks. If so, it is critical that we understand the DNA-binding properties of the ZF family and identify where different family members bind in the human genome. Various ZF codes have been developed that predict a binding motif for a particular ZNF (2–4). However, very few studies have performed in vivo analyses of ZNF-binding patterns and thus it is not clear if the binding codes developed using in vitro assays are physiologically relevant.
To understand the biological function of ZF transcription factors and to reveal the regulatory networks controlled by these factors, it is critical to identify all of the binding sites of a particular ZF factor that are present in the human genome. A powerful method to identify in vivo binding sites for transcription factors on a genome-wide scale is the chromatin immunoprecipitation (ChIP) assay, followed by hybridization of the precipitated DNA to microarrays (ChIP-chip) or by high throughput DNA sequencing of the sample (ChIP-seq). The ChIP assay uses formaldehyde to covalently cross-link proteins to their DNA substrates in living cells. This provides an opportunity to take a snapshot of DNA–protein interactions in a given cell type, using populations of cultured cells, subsets of cells taken at specific times of the cell cycle or development, or even cells taken directly from tissue samples. Initially, ChIP-chip was the method of choice for binding site analyses (5–10). However, multiple DNA microarrays are needed to cover the entire human genome, resulting in high costs for comprehensive studies. ChIP-seq technology, on the other hand, offers the possibility to identify transcription factor-binding sites in the entire genome in one sequencing run (11). In the beginning, ChIP samples were sequenced for the purpose of identifying binding sites after cloning individual immunoprecipitated fragments (12). Clearly this was an inefficient and costly method. Improvements in both cost and efficiency were gained when the Roche 454 DNA sequencer was used to analyze ChIP samples (13). However, 454 sequencing lacks the throughput necessary to cost-effectively identify the entire set of binding sites for a human transcription factor. In contrast, the Illumina GA2 sequencer generates over 10 times the number of DNA sequences at a fraction of the cost of sequencing with the 454 machine. It should be noted that the length of the reads from the Illumina sequencer are shorter than those obtained from the 454 machine. However, for the purposes of ChIP-seq, the short reads are sufficient to accurately map the enriched fragments to their genomic location. Applied Biosystems also produces a sequencer that provides high throughput sequencing of short tags. However, most of the published ChIP-seq papers to date have employed the Illumina system (14–17). This chapter describes in detail the steps needed to prepare ChIP samples and libraries for high throughput sequencing using the Illumina GA2 platform and includes descriptions of quality control steps necessary to ensure a successful ChIP-seq experiment (see Fig. 27.1).
Fig. 27.1.

ChIP-seq diagram summarizing experimental steps, including quality control procedures.
2. Materials
2.1. Cross-linking
Formaldehyde solution (37% w/w).
Glycine (electrophoresis grade).
Phosphate-buffered saline (PBS).
2.2. Chromatin Preparation
Protease inhibitor stock solutions (store in small aliquots at −20°C): 10 mg/mL aprotinin (in water), 10 mg/mL leupeptin (in water), 100 mM PMSF (in isopropanol).
Cell lysis buffer (store at room temperature): 5 mM PIPES pH 8, 85 mM KCl. Add igepal fresh each time to give a final concentration (f.c.) of 1% (10 μL/mL). Warm buffer in 37°C water bath and vortex briefly to help mixing of igepal. After mixing has occurred, place buffer containing igepal on ice to allow solution to cool down and then add protease inhibitors [PMSF (10 μL/mL f.c.), aprotinin (1 μL/mL f.c.), and leupeptin (1 μL/mL f.c.)].
Nuclei lysis buffer (store at room temperature): 50 mM Tris–HCl, pH 8, 10 mM EDTA, and 1% (w/v) SDS. Place buffer on ice right before use to avoid precipitation of SDS and add protease inhibitors [PMSF (10 μL/mL f.c.), aprotinin (1 μL/mL f.c.), and leupeptin (1 μL/mL f.c.)] just prior to use.
Elution buffer (store at room temperature): 50 mM NaHCO3, 1% (w/v) SDS.
DNase-free RNase A (10 mg/mL; Fermentas #EN0531).
QIAquick PCR purification kit (QIAGEN).
NanoDrop 1000 spectrophotometer is used to determine the concentration of double stranded DNA samples (see Note 1).
Type B Dounce homogenizer.
2.3. Chromatin Immunoprecipitation
Magnetic protein G beads (Cell Signaling Technology #9006) and magnetic rack (see Note 2).
Antibodies: Covance 8WG16 mouse monoclonal antibody against RNA polymerase II (Covance #MMS-1261R) is used as a positive control antibody for ChIP experiments, and normal/pre-immune control rabbit IgG (Alpha Diagnostic International #20009) is used as a negative control.
Protease inhibitor stock solutions (store in small aliquots at −20°C): 10 mg/mL aprotinin (in water), 10 mg/mL leupeptin (in water), 100 mM PMSF (in isopropanol).
IP dilution buffer (also known as RIPA buffer; store at 4°C): 50 mM Tris–HCl, pH 7.4, 150 mM NaCl, 1% (v/v) igepal, 0.25% (w/v) deoxycholic acid, 1 mM EDTA, pH 8. Add protease inhibitors [PMSF (10 μL/mL f.c.), aprotinin (1 μL/mL f.c.), and leupeptin (1 μL/mL f.c.)] just prior to use. This buffer is used to adjust the salt and SDS concentrations for the immunoprecipitation step.
IP wash buffer 1 (store at 4°C): same as IP dilution buffer, but no protease inhibitors are added.
IP wash buffer 2 (store at room temperature): 100 mM Tris–HCl, pH 9, 500 mM LiCl, 1% (v/v) igepal, 1% (w/v) deoxycholic acid.
IP wash buffer 3 (store at room temperature): 100 mM Tris–HCl, pH 9, 500 mM LiCl, 150 mM NaCl, 1% (v/v) igepal, 1% (w/v) deoxycholic acid.
Elution buffer (store at room temperature): 50 mM NaHCO3, 1% (w/v) SDS.
5 M NaCl.
DNase-free RNase A (10 mg/mL; Fermentas #EN0531).
QIAquick PCR purification kit (QIAGEN).
2.4. ChIP PCR Control
PCR reagents: 5 M betaine (stored at 4°C), 2 mM dNTP mix stored in small aliquots at −20°C, Taq polymerase such as GoTaq DNA polymerase (5 U/μL; Promega #M3005).
- Oligonucleotide primers used for positive and negative control PCR reactions for standard PCR (for primer design, see Note 3):
-
Positive control primers (to amplify a region which should be positive for binding of RNA Polymerase II):GAPDH-F: 5′-CACCGTCAAGGCTGAGAACG-3′GAPDH-R: 5′-ATACCCAAGGGAGCCACACC-3′
-
Negative control primers (to amplify a region which should be negative for binding of RNA Polymerase II):ZNF333-F: 5′-CACAGGAGAGAAGCCCTACG-3′ZNF333-R: 5′-TCGCGCACTCATACAGTTTC-3′
-
2.5. Sequencing Library
End-It DNA END Repair Kit (Epicentre #ER0720).
Klenow (3′- to 5′-exo-minus) (5,000 U/mL; NEB #M0212S).
100 mM dATP.
LigaFast DNA ligase (3 U/μL; Promega #M8221).
Oligo only kit for single end read sequencing containing genomic adapter oligo mix (100 μM) and genomic PCR primer 1.1 (25 μM) and PCR primer 2.1 (25 μM) (Illumina #FC-102-1003).
Phusion DNA polymerase (NEB #F531).
QIAquick PCR purification kit (QIAGEN) and MinElute PCR purification kit (QIAGEN).
QIAquick gel extraction kit (QIAGEN).
NanoDrop 1000 spectrophotometer is used to determine the concentration of double stranded DNA samples (see Note 1).
2.6. Pre-sequencing Control
Positive and negative control primers for qPCR (see Note 3).
SYBR-Green qPCR mix, such as SYBR Green JumpStart Taq ReadyMix for Quantitative PCR (SIGMA #S4438).
2.7. Sequencing
Sequencing reagents will be supplied by the sequencing facility.
3. Methods
3.1. Preparation of Cross-linked Cells
Cell cultures should be healthy and not density arrested prior to cross-linking. In general, 107 cells are used for a test ChIP assay and 108 cells are used per each ChIP-seq experiment. In a fume hood, add formaldehyde (37% stock) directly to tissue culture media to a final concentration of 1%. Incubate adherent cells on a gently shaking platform for 10 min at room temperature. Do not cross-link for longer periods since this may cause cells to form aggregates that do not sonicate efficiently.
Stop cross-linking reaction by adding glycine to a final concentration of 0.125 M. We use a 10× (1.25 M) stock solution. Continue to rock at room temperature for 5 min.
Pour off media; this media contains formaldehyde and should be treated as hazardous waste.
Rinse plates twice with ice-cold PBS and pour off wash solution. For 15 cm dishes, we add 20 mL of PBS per wash. Pipette gently so as not to dislodge cells. Swirl gently and discard. A few mL of PBS usually stay behind and can be used in step 5.
Using a cell scraper, transfer adherent cells from the culture dish to a 15 mL conical tube (or 50 mL tube for larger batches) on ice. Centrifuge the cross-linked cells at 430 rcf for 5 min at 4°C. Carefully aspirate supernatant so as to not lose cells. Cells may be used immediately for a chromatin preparation or snap frozen in liquid nitrogen and stored at −80°C.
3.2. Preparation of Chromatin
3.2.1. Cell Lysis and Chromatin Fragmentation
Thaw frozen cross-linked cells on ice. Resuspend cell pellet in freshly prepared ice-cold cell lysis buffer by pipetting. The final volume of cell lysis buffer should be sufficient so that there are no clumps of cells (~1 mL of Cell Lysis Buffer per 107 cells). Incubate on ice for 15 min.
Use a type B dounce homogenizer to break open the cells and release nuclei. Homogenize cells on ice with 20 strokes.
Centrifuge at 430 rcf for 5 min at 4°C.
Discard supernatant and resuspend nuclear pellet in nuclei lysis buffer. Use 200 μL of nuclei lysis buffer per 107 cells. Incubate on ice for 30 min.
Sonicate cells to achieve average chromatin length of 200–500 bp in a cold room and/or on ice (see Note 4). Larger chromatin fragments can negatively influence data quality and can lead to failure of the ChIP-seq experiment. Therefore, before processing large quantities of cells, sonication conditions should be optimized for each cell type (see Note 5 and Fig. 27.2).
Transfer sonicated samples into an Eppendorf tube and centrifuge using a microcentrifuge at 10,000 rcf for 10 min at 4°C. Carefully transfer the supernatant (sonicated chromatin) to a new tube while avoiding cell debris. Chromatin can be snap frozen in liquid nitrogen and stored at −80°C or used immediately.
Fig. 27.2.
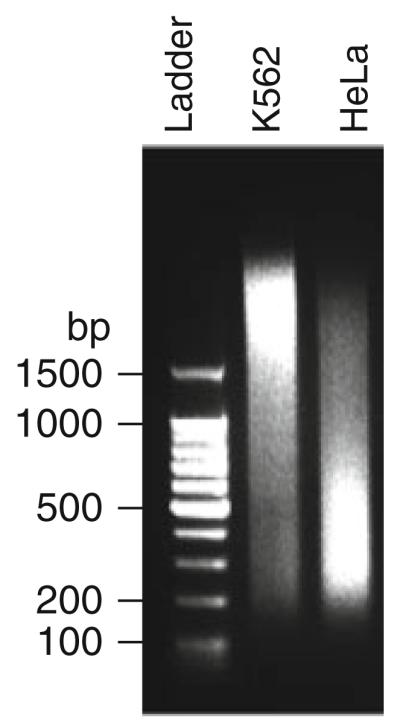
Sonicated chromatin. K562 and HeLa cells were sonicated for 30 min (30 s pulses, 1.5 min pauses in between pulses). A 100 bp ladder was used to estimate chromatin size. The optimal fragment size of 200–500 bp is observed for HeLa cells, whereas K562 cells show an average chromatin size larger than 1.5 kb. Before proceeding, the sonication conditions should be optimized for K562 cells.
3.2.2. Determination of Chromatin Size and Concentration
Take an aliquot of a chromatin sample prepared as described above. We typically use 20 μL of chromatin, which is the equivalent to 10% input from 107 cells.
Add elution buffer to a total volume of 100 μL and add 12 μL of 5 M NaCl to give a final salt concentration of 0.54 M. Boil samples in a water bath for 15 min to reverse cross-links.
Allow the sample to cool down, add 1 μL of DNase-free RNase A, and incubate for 20 min at 37°C. This step is important because the presence of RNA results in a false estimation of chromatin size.
Purify DNA using a PCR purification kit, then elute DNA in 50 μL water. Measure chromatin concentration by NanoDrop. The concentration can be used to calculate the chromatin yield. Approximately 50–100 μg of chromatin can be isolated from 107 cells.
Run 1 μg of chromatin on a 1.5% agarose gel to visualize the average size of the chromatin (see Fig. 27.2). If necessary, adjust sonication conditions by repeating steps 1–5 (e.g., add more pulses if the majority of the chromatin is bigger than 600 bp).
3.3. Chromatin Immunoprecipitation
Thaw chromatin preparation from Section 3.2.1 on ice. This can take hours depending on the volume. Measure the volume and divide chromatin as needed; 200 μL of chromatin (equivalent to 107 cells) is used per ChIP. Multiple ChIPs may need to be performed to obtain sufficient material for Illumina GA2 sequencing; the number required will vary between different antibodies. Typically 10 ChIP assays are performed for one ChIP-seq experiment (107 cells/assay; this requires 108 cells total, which is ~2 mL of chromatin).
The protein/chromatin complexes are captured using antibodies specific to the protein of interest (see Note 6). We also recommend that you include a positive and a negative control antibody to monitor the success of the ChIP experiment. An RNA polymerase II antibody is used as a positive control and normal rabbit IgG is used as a negative control. These control ChIPs are especially important when no target genes are known for the protein of interest. Therefore, in a typical experiment you will have three antibodies (against RNA polymerase II, IgG, and a ZF transcription factor). Approximately 107 cells (~200 μL of chromatin) are sufficient for the positive and negative control antibody ChIP assays because these samples will not be used for library preparation and sequencing, but will only serve as controls in PCR confirmations (see Section 3.4).
Save a 10% equivalent from 107 cells (~20 μL of chromatin); this sample is the input sample. Store the 10% input sample at −20°C until the next day when cross-links of ChIP samples are reversed.
For each ChIP from 107 cells, dilute chromatin to 1 mL with ice-cold IP dilution buffer containing protease inhibitors. When performing multiple ChIP assays of a given antibody for ChIP-seq, two ChIPs can be combined into a 2 mL tube.
Add the appropriate antibody to the samples. Although the amount of antibody should be optimized by immunoprecipitation experiments (see Note 6), typically between 1 and 5 μg of antibody is sufficient per 107 cells. For example, we use 2.4 μg of the Covance 8WG16 mouse monoclonal antibody against RNA polymerase II for 107 cells.
Incubate for 12–16 h on a rotating platform at 4°C.
Add 30 μL of magnetic protein G beads to each ChIP sample from 107 cells to capture antibody/chromatin complexes, and incubate on a rotating platform for 2 h at 4°C (see Note 7).
At room temperature, allow the beads to settle for 1 min in a magnetic separation rack. Carefully remove and discard the supernatant without disturbing the magnetic beads.
At room temperature, pool ChIPs obtained using the same antibody into one tube for washes. To pool, resuspend the beads of one tube in 1 mL of IP wash buffer 1, then add this suspension to the next tube. Repeat until all identical ChIPs are pooled into one tube. Do not discard the tubes; repeat the entire process with 0.5 mL of IP wash buffer 1 to rinse and retain as much bead material as possible.
Wash magnetic beads from the control ChIPs and pooled ChIPs two times with 1 mL of IP wash buffer 1. For each wash, take the tubes out of the magnetic rack, mix by pipetting, and collect as in step 8. Discard all wash solutions. Efficient washing is critical to reduce background. Avoid cross-contamination of samples and loss of magnetic beads.
Wash magnetic beads three times with IP wash buffer 2 (take tubes out of the magnetic rack and mix by pipetting and collect as in step 8). Discard all wash solutions.
Wash once with the higher stringency IP wash buffer 3. Discard wash solution.
Elute antibody/chromatin complexes from magnetic beads by adding 100 μL of elution buffer per tube. Shake on a vortexer for 30 min, setting 4 (on a scale of 1–10). Repeat this step for pooled ChIP samples, resulting in a total volume of 200 μL. The second elution is not necessary for ChIPs from 107 cells.
Allow beads to settle for 1 min in a magnetic separation rack. Carefully transfer the supernatant containing antibody/chromatin complexes to a fresh tube.
Add 12 μL of 5 M NaCl per 100 μL elution buffer to give a final concentration of 0.54 M NaCl.
At this point, thaw the input sample from the previous day. Bring the volume to 100 μL with elution buffer and add 12 μL of 5 M NaCl.
Incubate all samples in a 67°C water bath for 4 h to overnight to reverse the formaldehyde cross-links.
Allow samples to cool down, add 1 μL of RNaseA, and incubate at 37°C for 20 min.
Purify DNA with a PCR clean up kit, using one column per sample. Elute each sample with 50 μL of water.
3.4. ChIP Control Assays
The success of the ChIP experiment can be assessed by standard PCR using primers designed to amplify a known binding site for the positive control antibody and for the ZF protein antibody (see Note 8). IgG serves as a negative control antibody and should not show significant enrichment at any region of the genome if the IP washes were satisfactory. Examples of control ChIP experiments are shown in Fig. 27.3. Alternatively, qPCR can be used to determine ChIP enrichment. If this method is used, then the protocol outlined in Section 3.6 should be followed.
Fig. 27.3.

PCR validation of a ChIP experiment. An antibody to RNA polymerase II (Pol) is used as a positive control and normal rabbit IgG serves as a negative control. Success of the ChIP experiment is evaluated by comparing the amplified PCR fragments to dilutions of the 10% input sample. Enrichment of Pol at the active GAPDH promoter is equivalent to 0.2% of input (1:50 dilution of 10% input), while IgG shows no significant enrichment. Neither Pol nor IgG is enriched at the negative control region (3′-end of ZNF333). These results are typical for a successful RNA polymerase II ChIP experiment.
Example for a standard PCR reaction: ChIP samples from 107 cells are used undiluted, whereas ChIP samples from 108 cells are diluted 1:10 before PCR (1 μL of ChIP sample + 9 μL of water). The 10% input sample should be diluted 1:50, 1:100, and 1:200. Set up individual reactions for each set of positive and negative control primer pairs.
| 4 μL | 5× GoTaq PCR buffer |
| 4 μL | 5 M betaine |
| 2 μL | 2 mM dNTPs |
| 1 μL | 10 μM forward primer |
| 1 μL | 10 μM reverse primer |
| 1 Unit | GoTaq polymerase |
| 1.5 μL | ChIP sample or diluted input sample (1:50, 1:100, 1:200) |
| 20 μL | Total reaction volume |
Amplify using the following PCR protocol:
3 min at 95°C
35 cycles: 30 s at 95°C, 30 s at 60°C, 30 s at 72°C
5 min at 72°C
Hold at 10°C
The PCR reactions are run on a 1.5% agarose gel. Enrichment is evaluated relative to input. Strong enrichments give signals comparable to the signal obtained using the 1:50 dilution of 10% input sample (equivalent to 0.2% enrichment, see Fig. 27.3).
3.5. Preparation of the Sequencing Library
The library protocol is based on the Illumina Sample Preparation Kit for Genomic DNA with some modifications. This protocol describes the preparation of libraries from ChIP DNA that are compatible with the Illumina sequencing platforms.
3.5.1. End Repair
End repair is performed using the “End-It DNA End Repair Kit” from Epicentre. This step ensures that all DNA fragments are converted to 5′-phosphorylated blunt-ended DNA. ChIP DNA from Section 3.3 can be concentrated to 34 μL using a speed vac, but avoid over-drying since this causes loss of DNA.
| 34 μL | ChIP DNA from Section 3.3 |
| 5 μL | 10× end repair buffer |
| 5 μL | 10 mM ATP |
| 5 μL | 2.5 mM dNTP Mix |
| 1 μL | end repair enzyme mix |
| 50 | μL Total reaction volume |
Incubate at room temperature for 45 min and purify DNA using a PCR purification kit (such as QIAquick PCR purification kit). Elute in 34 μL of the kit elution buffer.
3.5.2. Addition of an ‘A’ Base to the 3′-End of DNA Fragments
Prepare 1 mM dATP aliquots from 100 mM dATP stock. Store aliquots of 11 μL at −20°C. 1 mM dATP solution should not be refrozen.
| 34 μL | DNA from Section 3.5.1 |
| 5 μL | 10× Klenow buffer |
| 10 μL | 1 mM dATP |
| 5 units | Klenow fragment (3′- to 5′-exo-minus) |
| 50 μL | Total reaction volume |
Incubate for exactly 30 min at 37°C. Purify DNA using a PCR purification kit (such as MinElute PCR purification kit). Elute in 12 μL of the kit elution buffer.
3.5.3. Ligation of Adapters to DNA Fragments
The genomic adapter oligo mix from Illumina is diluted 1:10 in water before use.
| 12 μL | DNA from Section 3.5.2 |
| 15 μL | 2× DNA ligase buffer |
| 1 μL | 1:10 dilution of genomic adapter oligo mix |
| 2 μL | LigaFast DNA ligase |
| 30 μL | Total reaction volume |
Incubate for 15 min at room temperature. Purify DNA using a PCR purification kit (such as QIAquick PCR purification kit). Elute in 25 μL of the kit elution buffer.
3.5.4. Amplification of Adapter Modified DNA Fragments and Gel Purification
| 24 μL | DNA from Step 3.5.3 |
| 25 μL | 2× Phusion DNA polymerase |
| 0.5 μL | Illumina Genomic PCR primer 1.1 |
| 0.5 μL | Illumina Genomic PCR primer 2.1 |
| 50 μL | Total reaction volume |
Amplify using the following PCR protocol:
30 s at 98°C
15 cycles: 10 s at 98°C, 30 s at 65°C, 30 s at 72°C
5 min at 72°C
Hold at 4°C
Purify and concentrate DNA using a PCR purification kit (such as MinElute PCR purification kit). Elute in 10 μL of the kit elution buffer. Run purified DNA product on a 2% agarose gel next to a 50 bp or 100 bp ladder. Excise DNA between 150 and 500 bp. This step ensures removal of unused primers and adapters and selection of proper fragment size for sequencing. Purify DNA using a gel extraction kit. Elute DNA in 30 μL of the kit elution buffer and measure DNA concentration by NanoDrop. At this point, follow instructions of the sequencing facility for sample submission.
3.6. Pre-sequencing Control Assays: Enrichment Check Using Positive/Negative Control Primers
To verify that a library has maintained a specific enrichment of ChIP target sites, perform qPCR on the ChIP-seq library using both target and negative control primer pairs (see Note 9). An input library derived from the 10% input sample serves as a control to normalize the qPCR data to determine the relative enrichment of a given target (see Note 10).
3.6.1. Prepare Input Library
Using 50–200 ng of input chromatin extract, construct an input library as described in Section 3.5.
3.6.2. Real-Time Quantitative PCR (qPCR)
Analyze the ChIP-seq library as well as an input library for reference. Prepare a master reaction mix for each library with triplicate reactions per primer set. Add extra reagents for 10% of the total number of reagents to account for loss of volume. Add 15 μL of reaction mix to each PCR reaction well.
| 2μL | 2 ng library from Section 3.5.4 and Section 3.6.1 |
| 3.5 μL | Nuclease-free H2O |
| 7.5 μL | 2× SYBR Green mix (containing polymerase) |
| 2 μL | 5 μM target primer mix |
| 20 μL | Total reaction volume |
Amplify using the following PCR protocol:
3 min at 95°C
40 cycles of 30 s at 95°C then 30 s at 60°C
Include a 70–95°C melting curve at the end of the qPCR program, reading all points or every 0.2°C.
3.6.3. Determine Enrichment
Analyze the qPCR results by first manually determining the cycle threshold for each reaction across the plate within the linear range of the amplification curve. Using Microsoft Excel, calculate the average cycle threshold for each triplicate reaction of each sample. Create a column on the spreadsheet and copy the corresponding averaged cycle thresholds for an input library and ChIP-seq library so that they are adjacent for a specific primer set inside the column. In an adjacent column use the following formula to determine the ‘relative DNA amount’ for each sample 2(max(A$1:A$6)−A1), where A$1:A$6 is the list of average sample cycle thresholds for all the samples analyzed in the column (in this example there are six samples, the first at cell A1 and so on). Divide the relative DNA amount of the ChIP-seq library by the relative DNA amount of the input library for a given primer set. The resultant quotient corresponds to the enrichment value of a target in the library over the input library. The enrichment value for a target primer set should be at least 20-fold greater than the enrichment of a negative control primer set. The enrichment value for a negative control site should be near one, signifying no enrichment for this negative control. To further account for any bias when comparing the ChIP-seq library to the input library, determine the fold enrichment using the data from the negative control primers. This is accomplished by dividing the relative DNA amount of each sample for a target primer set by the corresponding value for a negative control primer set. The resulting quotient represents a normalized DNA amount. Divide the normalized DNA amount for the ChIP-seq sample by the corresponding normalized DNA amount for the input sample to determine the fold enrichment of a target site in the ChIP-seq library (see Fig. 27.4). If the positive control primers show greater than 20-fold enrichment over the negative control primers, then the sample can be provided to a sequencing facility (e.g., http://genomecenter.ucdavis.edu/dna_technologies) for high throughput sequencing.
Fig. 27.4.

Confirmation of ChIP targets in ChIP-seq libraries. Three independent ChIP-seq libraries were prepared from K562 cells using an antibody to ZNF263 (17). The relative enrichments of a target site (COTL1) and a negative control site (CDH1) were determined by comparing qPCR signals from the ZNF263 ChIP-seq libraries to the qPCR signals from an input library. Based on the enrichment values, it would be expected that library 1 would give robust ChIP-seq peaks, library 2 would give modest ChIP-seq peaks, and library 3 would not produce peaks (see Fig. 27.5).
3.7. Library Sequencing
An estimated 10–20 million uniquely mapped tags should be sufficient to identify all binding sites for a site-specific factor (which is approximately two lanes using an Illumina GA2 machine). Ideally, these reads should come from two independent ChIP samples, with the binding sites identified in each replicate having at least a 60% overlap. After the sequencing is performed, the short tags (~25–50 nt) are mapped to the human genome, the tags that map uniquely to only one location in the genome are selected, and then the unique tags are extended to the average size of the library fragments (~200 nt) and binned into consecutive bins running the length of each chromosome. The binned data can be visualized using the UCSC browser (http://www.genome.ucsc.edu) or the Affymetrix Integrated Genome Browser (http://www.affymetrix.com/partners_programs/-programs/developer/tools/download_igb.affx) (see Fig. 27.5). Target sites can be identified using a variety of peak calling methods (14, 15, 18–22).
Fig. 27.5.

Comparison of ChIP-seq data. ChIP-seq data from three independent ZNF263 ChIP-seq libraries that were analyzed by qPCR (see Fig. 27.4) and from an input library were visualized using the Integrated Genome Browser. The positive ZNF263 target site (COTL1) is shown. The COTL1 gene is located on chromosome 16. The 5′-end starts at 83,209,170 (shown in the schematic) and the gene extends to the left and ends at 83,156,705 (not shown); all sequences are relative to the hg18 human genome data set on the UCSC browser. Unique sequencing reads (4–5 million) were analyzed for libraries 1–3, and 12 million unique sequencing reads were analyzed for the input library. The peak heights can be compared by the number of sequencing reads plotted on the y-axis. The number of reads observed at the binding site in the COTL1 promoter correlates with the qPCR enrichment data shown in Fig. 27.4.
Fig. 27.6.
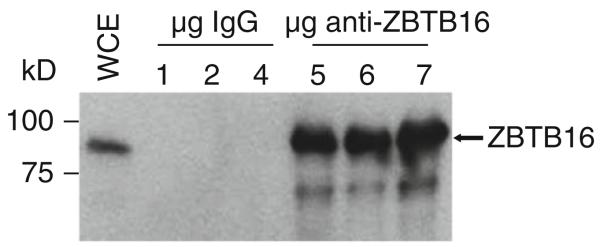
IP-western blot analysis of the zinc finger protein ZBTB16. ZBTB16 was immunoprecipitated from LNCaP nuclear extracts using 1, 2, and 4 μg of either control IgG or anti-ZBTB16 antibody. ZBTB16 protein was detected in whole cell extract (WCE) prior to immunoprecipitation and in immunoprecipitations using ZBTB16 antibody, but not IgG. Based on the success of the antibody in these standard immunoprecipitations, it is expected that the antibody would be appropriate for use in ChIP assays.
Footnotes
This instrument is invaluable for measuring low DNA concentrations (e.g., 10 ng/uL) and for small sample volumes (as little as 1 μL of sample can be measured).
Do not use magnetic beads that have been blocked with foreign DNA, such as Herring sperm or Salmon sperm DNA. This may result in sequencing of the blocking DNA, resulting in lower quality ChIP-seq data. Although protein G binds antibodies from a variety of species (rabbit, mouse, goat, etc.) with high affinity, magnetic protein A beads can be used if desired.
Use the primer design program Primer3 (23) or another suitable program to design the target and control primers, making the product length 90–150 bp. If possible, design primers for at least two targets as well as for two negative control regions.
Chromatin can be sheared by sonication or digested by micrococcal nuclease. Although both methods work well, this protocol is based on sonication. An alternative method using micrococcal nuclease is available from cell signaling technology (http://www.cellsignal.com).
We use a BioRuptor on high setting for sonication. Wear hearing protection! Volumes between 0.5 and 2 mL are sonicated in 15 mL tubes, whereas volumes between 0.1 and 0.3 mL are sonicated in 1.5 mL Eppendorf tubes. The pulse duration, intensity, and number will vary depending on the sonicator, the extent of cross-linking, and cell type. Ideally the least amount of input energy that gives satisfactory fragmentation should be used. To optimize sonication conditions, it is recommended to take 20 μL samples of chromatin in 5 min intervals. We commonly sonicate for 30 min (pulses of 30 s at setting high, with 1.5 min pauses between pulses).
Antibody efficiency can vary significantly between different batches, resulting in variation of the quality of the resultant ChIP-seq data. It is therefore important to record antibody details, such as catalog number, lot number, batch of affinity purification, etc. It is helpful to test that the antibody works in a regular immunoprecipitation (IP) first before performing a ChIP assay (see Fig. 27.6). Ideally, the test immunoprecipitation is carried out in the same buffer as the ChIP assay. After immunoprecipitation, the sample is run on an SDS-PAGE gel and western blotted using the same antibody. The major band on the blot should be the correct size of the protein of interest. Antibodies that work in a test immunoprecipitation will most likely work in a ChIP assay. This standard immunoprecipitation assay is also a good way to optimize the amount of antibody that should be used for a specific number of cells. It should also be noted that antibodies that specifically recognize only one ZF protein are difficult to develop due to the high similarity of different ZFs to each other and to the low expression level of most ZFs. If the IP-western blot does not show a single major band (or if no antibody to a particular ZF is available), then we recommend expressing a tagged version of the ZF of interest. Transient expression of the tagged ZF protein, as well as stably transfected cell lines, can be used. However, in either case, the expression level of the tagged ZF protein should be determined by western blot analysis. The ChIP assay can then be performed with a commercially available antibody specific to the tag used, such as an HA or Flag tag, that has been previously shown to work in immunoprecipitations.
This protocol is based on magnetic protein A/G beads because of their ease of use, but protein A/G agarose beads as well as StaphA cells are also commonly used to capture the antibody/protein/DNA complexes. Some antibodies only give good ChIP enrichments when used in combination with StaphA cells. A detailed StaphA ChIP protocol can be found at http://www.genomecenter.ucdavis.edu/farnham. ChIP samples obtained from StaphA cells can be used for ChIP-seq, but high enrichment of the protein of interest by the antibody and proper technique to avoid carryover of StaphA cells is critical for the success of the experiment. Carryover of StaphA cells, in combination with low ChIP enrichment, results in amplification of StaphA DNA in the library preparation step, which ultimately leads to sequencing of StaphA DNA. This can significantly lower the quality of ChIP-seq data.
Unfortunately, the in vivo binding specificities of very few ZF proteins have been characterized and therefore binding sites are not known for most members of this family. When no target gene is known for the ZF protein of interest, the RNA polymerase II ChIP sample can be used to determine if the ChIP experiment itself was successful. Enrichment of RNA polymerase II can be observed at active promoters, such as the GAPDH promoter or the promoter for the large subunit of RNA polymerase II. In contrast, RNA polymerase II should not be significantly enriched at silenced promoters or at regions outside of a core promoter region; we routinely use a primer set to the 3′-end of the ZNF333 gene as a negative control for RNA polymerase II.
Before testing the library, it is important to determine that the primers work for the SYBR Green-based real-time PCR assay. To do this, use input DNA and run a melting curve following the real-time PCR reaction conditions. View the dissociation curve to ensure that the desired amplicon was detected, as seen by a single peak.
An input library is also critical for determining a baseline genome for identification of binding sites. For each cell type, ~10–20 million sequenced tags of an input library are required. The same input library used to determine enrichment can be used for sequencing.
References
- 1.Emerson RO, Thomas JH. Adaptive evolution in zinc finger transcription factors. PLOS Genet. 2008;5:e1000325. doi: 10.1371/journal.pgen.1000325. [DOI] [PMC free article] [PubMed] [Google Scholar]
- 2.Liu J, Stormo GD. Context-dependent DNA recognition code for C2H2 zinc-finger transcription factors. Bioinformatics. 2008;24:1850–1857. doi: 10.1093/bioinformatics/btn331. [DOI] [PMC free article] [PubMed] [Google Scholar]
- 3.Cho SY, Chung M, Park M, Park S, Lee YS. ZIFIBI: prediction of DNA binding sites for zinc finger proteins. BBRC. 2008;369:845–848. doi: 10.1016/j.bbrc.2008.02.106. [DOI] [PubMed] [Google Scholar]
- 4.Segal DJ, Barbas CF., 3rd Design of novel sequence-specific DNA-binding proteins. Curr Opin Chem Biol. 1999;4:34–39. doi: 10.1016/s1367-5931(99)00048-4. [DOI] [PubMed] [Google Scholar]
- 5.Weinmann AS, Yan PS, Oberley MJ, Huang TH-M, Farnham PJ. Isolating human transcription factor targets by coupling chromatin immunoprecipitation and CpG island microarray analysis. Genes Dev. 2002;16:235–244. doi: 10.1101/gad.943102. [DOI] [PMC free article] [PubMed] [Google Scholar]
- 6.Johnson DS, Li W, Gordon DB, Bhattacharjee A, Curry B, Ghosh J, Brizuela L, Carroll JS, Brown M, Flicek P, Koch CM, Dunham I, Bieda M, et al. Systematic evaluation of variability in ChIP-chip experiments using predefined DNA targets. Genome Res. 2008;18:393–403. doi: 10.1101/gr.7080508. [DOI] [PMC free article] [PubMed] [Google Scholar]
- 7.Kirmizis A, Bartley SM, Kuzmichev A, Margueron R, Reinberg D, Green R, Farnham PJ. Silencing of human polycomb target genes is associated with methylation of histone H3 lysine 27. Genes Dev. 2004;18:1592–1605. doi: 10.1101/gad.1200204. [DOI] [PMC free article] [PubMed] [Google Scholar]
- 8.Kim TH, Barrera LO, Zheng M, Qu C, Singer MA, Richmond TA, Wu Y, Green RD, Ren B. A high-resolution map of active promoters in the human genome. Nature. 2005;436:876–880. doi: 10.1038/nature03877. [DOI] [PMC free article] [PubMed] [Google Scholar]
- 9.Cawley S, Bekiranov S, Ng HH, Kapranov P, Sekinger EA, Kampa D, Piccolboni A, Sementchenko V, Cheng J, Williams AJ, Wheeler R, Wong B, Drenkow J, Yamanaka M, Patel S, Brubaker S, Tammana H, Helt G, Struhl K, Gingeras TR. Unbiased mapping of transcription factor binding sites along human chromosomes 21 and 22 points to widespread regulation of noncoding RNAs. Cell. 2004;116:499–509. doi: 10.1016/s0092-8674(04)00127-8. [DOI] [PubMed] [Google Scholar]
- 10.Carroll JS, Liu XS, Brodsky AS, Li W, Meyer CA, Szary AJ, Eeckhoute J, Shao W, Hestermann EV, Geistlinger TR, Fox EA, Silver PA, Brown M. Chromosome-wide mapping of estrogen receptor binding reveals long-range regulation requiring the forkhead protein FoxA1. Cell. 2005;122:33–43. doi: 10.1016/j.cell.2005.05.008. [DOI] [PubMed] [Google Scholar]
- 11.Hoffman BG, Jones SJ. Genome-wide identification of DNA-protein interactions using chromatin immunoprecipitation coupled with flow cell sequencing. J Endocrinol. 2009;201:1–13. doi: 10.1677/JOE-08-0526. [DOI] [PubMed] [Google Scholar]
- 12.Weinmann AS, Bartley SM, Zhang MQ, Zhang T, Farnham PJ. The use of chromatin immunoprecipitation to clone novel E2F target promoters. Mol Cell Biol. 2001;21:6820–6832. doi: 10.1128/MCB.21.20.6820-6832.2001. [DOI] [PMC free article] [PubMed] [Google Scholar]
- 13.Loh Y-H, Wu Q, Chew J-L, Vega VB, Zhang W, Chen X, Bourque G, George J, Leong B, Liu J, Wong K-Y, Sung KW, Lee CW, Zhao XD, Chiu KP, Lipovich L, Kuznetsov VA, Robson P, Stanton LW, Wei CL, Ruan Y, Lim B, Ng HH. The Oct4 and Nanog transcription network regulates pluripotency in mouse embryonic stem cells. Nat Genet. 2006;38(4):431–440. doi: 10.1038/ng1760. on line March 5, 2006. [DOI] [PubMed] [Google Scholar]
- 14.Robertson G, Hirst M, Bainbridge M, Bilenky M, Zhao Y, Zeng T, Euskirchen G, Bernier B, Varhol R, Delaney A, Thiessen N, Griffith OL, He A, Marra M, Snyder M, Jones S. Genome-wide profiles of STAT1 DNA association using chromatin immunoprecipitation and massively parallel sequencing. Nat Methods. 2007;4:1–7. doi: 10.1038/nmeth1068. [DOI] [PubMed] [Google Scholar]
- 15.Johnson DS, Mortazavi A, Myers RM, Wold B. Genome-wide mapping of in vivo protein-DNA interactions. Science. 2007;316:1497–1502. doi: 10.1126/science.1141319. [DOI] [PubMed] [Google Scholar]
- 16.Cuddapah S, Jothi R, Schones DE, Roh T-Y, Cui K, Zhao K. Global analysis of the insulator CTCF in chromatin barrier regions reveals demarcation of active and repressive domains. Genome Res. 2009;19:24–32. doi: 10.1101/gr.082800.108. [DOI] [PMC free article] [PubMed] [Google Scholar]
- 17.Frietze S, Lan X, Jin VX, Farnham PJ. Genomic targets of the KRAB and SCAN domain-containing zinc finger protein 263. J Biol Chem. 2010;285:1393–1403. doi: 10.1074/jbc.M109.063032. [DOI] [PMC free article] [PubMed] [Google Scholar]
- 18.Blahnik KR, Dou L, O’Geen H, McPhillips T, Xu X, Cao AR, Iyengar S, Nicolet CM, Ludäscher B, Korf I, Farnham PJ. Sole-Search: an integrated analysis program for peak detection and functional annotation using ChIP-seq data. Nucleic Acids Res. 2010;38:e13. doi: 10.1093/nar/gkp1012. [DOI] [PMC free article] [PubMed] [Google Scholar]
- 19.Fejes AP, Robertson G, Bilenky M, Varhol R, Bainbridge M, Jones SJM. FindPeaks 3.1: a tool for identifying areas of enrichment from massively parallel short-read sequencing technology. Bioinformatics. 2008;24:1729–1730. doi: 10.1093/bioinformatics/btn305. [DOI] [PMC free article] [PubMed] [Google Scholar]
- 20.Xu H, Wei C-L, Lin F, Sung W-K. An HMM approach to genome-wide identification of differential histone modification sites from ChIP-seq data. Bioinformatics. 2008;24:2344–2349. doi: 10.1093/bioinformatics/btn402. [DOI] [PubMed] [Google Scholar]
- 21.Zhang Y, Liu T, Meyer CA, Eeckhoute J, Johnson DS, Bernstein BE, Nussbaum C, Myers RM, Brown M, Li W, Liu XS. Model-based analysis of ChIP-Seq (MACS) Genome Biol. 2008;9:R137. doi: 10.1186/gb-2008-9-9-r137. [DOI] [PMC free article] [PubMed] [Google Scholar]
- 22.Jothi R, Cuddapah S, Barski A, Cui K, Zhao K. Genome-wide identification of in vivo protein-DNA binding sites from ChIP-seq data. Nucleic Acids Res. 2008;36:5221–5231. doi: 10.1093/nar/gkn488. [DOI] [PMC free article] [PubMed] [Google Scholar]
- 23.Rozen S, Skaletsky HJ. Primer3 on the WWW for general users and for biologist programmers. In: Krawetz S, Misener S, editors. Bioinformatics methods and protocols: methods in molecular biology. Humana Press; Totowa: 2000. pp. 365–386. [DOI] [PubMed] [Google Scholar]