

Abstract
Neonates exposed to common neonatal intensive care unit (NICU) procedures show alterations in heart rate, blood pressure, and oxygen saturation. However, it is unclear if these physiologic changes increase adenosine triphosphate (ATP) utilization, thus potentially increasing the risk for tissue hypoxia in medically fragile neonates. Plasma uric acid is a commonly used marker of increased ATP utilization because uric acid levels increase when ATP consumption is enhanced. To examine the effect of a common NICU procedure on plasma uric acid concentration, we developed a model that allows for acute monitoring of this biochemical marker in plasma in 7- to 9-day-old rabbits. In our pilot study, we exposed neonatal rabbits to a single heel lance 2.5 hr after catheter placement. We measured uric acid concentration before and 30 min after the heel lance and compared findings to levels in control animals not exposed to the heel lance. Our pilot data shows a significant difference in uric acid concentration over time between the control and heel lance groups (46.2 ± 7.1 μM vs. 54.7 ± 5.8 μM, respectively, p = .027). Calculation of percentage change from baseline showed uric acid concentration increasing in rabbits exposed to heel lance and decreasing in control rabbits (1.5 ± 4.7% vs. –16.1 ± 4.2%, respectively, p = .03). These data suggest that this animal model can be successfully used to examine the biochemical effect of common NICU procedures, such as heel lance, on markers of ATP breakdown and purine metabolism.
Keywords: heel lance, uric acid, procedural pain, ATP metabolism
Neonates in the neonatal intensive care unit (NICU) routinely undergo painful and invasive procedures. NICU patients are exposed to an average of 12 ± 8 painful procedures per day and 141 ± 107 total procedures over a 14-day period (Carbajal et al., 2008). Invasive and painful NICU procedures are known to alter physiological homeostasis by increasing heart rate and metabolism and decreasing oxygen saturation and transcutaneous partial pressure of oxygen in arterial blood (PaO2; Pokela, 1994; Sparchott, 1997). However, it is unclear if painful procedures increase adenosine triphosphate (ATP) utilization in excess of ATP synthesis, increasing the risk for tissue hypoxia. Pilot data from our laboratory demonstrated significant alterations in purine metabolism in the plasma of premature neonates experiencing tape removal (Plank, Asmerom, Slater, Ahmed,Angeles,Boskovic et al, 2010), while a recent article by Bellieni and colleagues (2009) showed an increase in markers of oxidative stress in the plasma of premature neonates experiencing heel lance. These data suggest that common NICU procedures can lead to enhanced ATP breakdown and oxidative stress in immature neonates.
To further examine the biochemical effects of commonly performed NICU procedures, our laboratory developed a neonatal rabbit model for acute monitoring of ATP breakdown and purine metabolism. The neonatal rabbit kit is an ideal NICU model for several reasons. First, the neonatal rabbit kit has brain development similar to the premature human neonate, with a high cortical white:gray matter ratio and undeveloped cerebral white matter with undefined masses of neuroblasts (Ponti, Peretto, & Bonfanti, 2006). These similarities enable evaluation of the white matter injury commonly seen in hypoxic premature neonates. Second, unlike rats or mice, neonatal rabbits are unique in that maternal behavior is restricted and minimal, making it possible to perform procedures and obtain results that are independent of stresses related to maternal separation, feeding behavior, or interference (Denenberg, Desantis, Waite, & Thoman, 1977). Lastly, the larger size and higher plasma volume of the postnatal rabbit kit, aged 7–9 days, when compared to the postnatal rat or mouse of the same age, makes it possible to collect multiple blood samples from each animal without causing hypovolemia and significantly altering cardiovascular homeostasis. The neonatal rabbit is 5 times bigger at birth than the neonatal rat pup and 15 times larger at Day 7. Their larger size further allows for easier monitoring of heart rate, oxygen saturation, and blood pressure during procedures as well as evaluation of the effect of these procedures on organ dysfunction.
Based on the above-described characteristics, we examined the possible use of neonatal rabbits as an experimental model to measure the effect of commonly performed NICU procedures on ATP breakdown. It is well documented that when animals and humans are challenged with increased metabolic needs, they will catabolize high-energy phosphate bonds such as ATP (Buonocore, Perrone, Longini, Terzuoli, & Bracci, 2000; Johnson, Tekkanat, Schmaltz, & Fox, 1989; Maenpaa, Raivio, & Kekomaki, 1968; Plank et al., 2008; Raivio, Kekomaki, & Maenpaa, 1969; Saugstad, 1975). The degradation of ATP results in increased levels of free adenosine, which is consequently degraded to inosine and purines, hypoxanthine and xanthine, and finally to uric acid (Figure 1). In humans, an increased level of uric acid is a commonly accepted biochemical marker of hypoxia and increased ATP breakdown (Buonocore et al., 2000; Saugstad, 1975). If common NICU procedures enhance ATP and purine consumption, we would expect to see a significant increase in the concentration of markers of ATP utilization, specifically uric acid, in rabbit kits exposed toprocedures commonly performed in the NICU.
Figure 1.
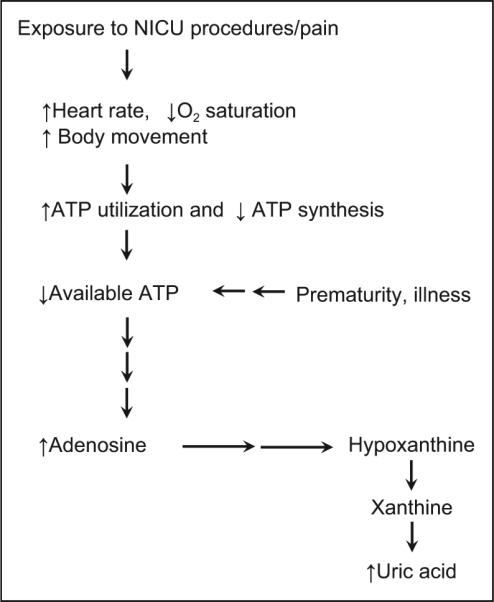
Exposure to neonatal intensive care unit (NICU) procedures/ pain leads to adenosine triphosphate (ATP) breakdown and uric acid metabolism. O2 = oxygen.
Methods
Animals
We performed all experiments in accordance with approved institutional animal care guidelines. We purchased midgestation New Zealand rabbit dams from a local vendor and allowed them to deliver naturally at term. At postnatal day of life 5, we transported the rabbit dam and kits to the animal care facility, where they were maintained under approved laboratory conditions. Animals were housed in a steel cage with a thermo-regulated litter box containing nesting material for the kits. Food and water were made available ad libitum.
Central Catheter Placement
We performed catheter placement on a warming pad and facilitated dissection using an OPMI-6 surgical microscope (Karl Zeiss Co., Germany) at approximately 10X magnification. We fashioned the catheters by inserting and gluing PE-10 tubing (Braintree, Massachusetts) into PE-50 tubing (Braintree, Massachusetts) prior to sterilization. At postnatal day of life 7–9, neonatal rabbit kits were quickly anesthetized with 3–3.5% isoflurane and then maintained by mask ventilation with 1.5–2.5% isoflurane to maximize anesthesia while minimizing cardiorespiratory depression. Once the kits were anesthetized, we made an incision in the neck to the right of the ventral midline and isolated the internal jugular vein from surrounding tissue. We made a second skin incision inferior to the left scapula and tunneled a venous catheter subcutaneously from the back incision to the neck incision. We then inserted a 25-gauge butterfly into the free end of the PE-50 tubing and filled the catheter with heparinized saline (20 units/ml). We ligated the distal internal jugular vein with 8-0 ophthalmic nylon and made a venotomy with a 25-gauge needle. We then passed the catheter antegrade through the venotomy at a predetermined distance to reside at the junction of superior vena cava and right atrium. We secured the catheter to the proximal vein using 6-0 silk after ensuring patency, filled it with heparinized saline, and locked it with gentamicin (120 microgram/ml). We closed subcutaneous tissues in a routine manner with 6-0 vicryl and maintained catheter patency by flushing with heparinized saline (10 units/ml) after each blood draw, as described below. We employed standard aseptic techniques and monitored the rabbit kits continuously for heart rate, respiratory rate, and temperature. After completing the catheterization procedures, we discontinued anesthesia. All rabbit kits recovered immediately and were observed to be active and moving freely within 15–30 min. They remained awake (unanesthetized) and active for the duration of the study.
Blood Sampling Procedure for Acute Monitoring of Plasma Uric Acid Concentration
To examine the effectiveness of this animal model in acutely measuring the effects of common NICU procedures on plasma uric acid concentration, we randomized rabbit kits to either a time-control or a heel lance group. We used data gathered from the time-control group to determine the optimal timing of the heel lance procedure in the experimental animals as described below. For all animals, we drew blood from the jugular catheter at specific time points: immediately after catheter insertion (0 hr) and at 2, 2.5, and 3 hr after insertion (Figure 2). Study conditions (lighting, noise, temperature) were similar during both time-control and heel lance procedures. Animals in the time-control group were allowed to move around the cage freely for the entire study after catheter placement; animals in the heel lance group were allowed to move freely until 2.5 hr after surgery when they were exposed to the heel lance procedure.
Figure 2.

Timeline of experimental procedures.
Heel lance procedure
Based on data gathered in the time-control animals (see “Results,” Figure 3), we exposed rabbit kits in the heel lance group to heel lance at 2.5 hr after anesthesia and catheterization (Accuchek, Roche Diagnostics, Basel, Switzerland). We used a lance depth of 2.3 mm for each heel lance procedure due to the presence of fur on the rabbit's heel and to ensure that the procedure would lead to a visible single drop of blood.
Figure 3.

Uric acid concentration time course in control rabbit kits (n = 5; mean ± SD).
Blood processing and uric acid analysis
We collected each blood sample into an EDTA tube and transported it, on ice, to a Fisher Scientific AccuSpin 1R Centrifuge (Fair Lawn, New Jersey). Samples were centrifuged for 20 min at 1500 g and 4°C. The plasma was removed, transferred to separate Eppendorf tubes and centrifuged in a Beckman Microfuge 22R centrifuge (Fullerton, California for 30 min at 18000 g, 4°C. Each supernatant, 250 μl, was then deproteinated using a Microcon centrifugal filter device (Millipore Corp., Bedford, Massachusetts) with a 10 K molecular weight cutoff by spinning the loaded device for 90 min at 14000 g and 4°C. Filtrate was removed and 200 μl were transferred to an Eppendorf tube containing 1 × 10⁻⁷ mol of 2-aminopurine as internal standard. Samples were stored at –80°C until analysis.
For measurement of uric acid, each blood sample was analyzed with a high-performance liquid chromatographer (HPLC; Waters 600E, Waters 996 PDA, Millipore Corp.) by injecting 50 μl of sample onto a Supelcosil LC-18-S 15cm × 4.6 mm, 5 μm column (SGE: Austin, Texas) with the following isocratic conditions: 50 mM ammonium formate buffer, pH 5.5, flow rate 1.0 ml/min. Uric acid and the internal standard, 2-aminopurine, were quantitated by obtaining peak areas at the appropriate retention times (2.6 and 10.9 min, respectively) and absorbance wavelengths (288 and 305, respectively). The area ratio of uric acid to 2-aminopurine was determined and converted into concentration using standard curves. Samples were analyzed in triplicate and values with a coefficient of variation less than 10% were included in the final analysis.
Statistical Analyses
We assessed assumptions of normality and equal variance. We used independent samples t-test to analyze continuous data and reported them as the mean and standard deviation (mean ± SD). We assessed repeated measures ANOVA for one between-subject factor (group) and one within-subject factor (time) to evaluate the effect of the two procedures (control vs. heel lance) on plasma uric acid concentration over time using interaction terms in the general linear model. We calculated percent change in uric acid between 0 min (baseline) and 30 min (postprocedure) values as follows:
We performed all statistical analyses using SPSS Statistics for Windows Version 19 and considered differences to be significant at p < .05.
Results
Central Catheter Placement
Using the jugular vein, we were successful in obtaining multiple blood samples from a total of 11 out of 15 rabbit kits (73% success rate), 5 of which were in the control group and 6 of which were in the heel lance group. We were not able to obtain multiple blood samples in the other four rabbits due to catheter dislodgement or failure of the line to draw, possibly due to kinking or clotting.
Stabilization of Plasma Uric Acid Concentration Post Central Catheter Placement
We measured uric acid concentrations in plasma over multiple time points to determine when this marker stabilized after jugular catheterization. We found in five control rabbit kits that uric acid values began to fall at the 2.5- and 3-hr time points, suggesting achievement of steady-state ATP metabolism (Figure 3). Thus, we determined that the 2.5-hour time point could be used to explore the effect of procedures on biochemical markers of ATP breakdown.
Effect of Heel Lance on Uric Acid Levels
We found significant differences in uric acid concentration over time between the control group and the heel lance group (54.7 ± 5.8 μM vs. 46.2 ± 7.1 μM, respectively, p = .027; Figure 4). Whereas uric acid concentration decreased over time in control rabbits, it increased over time in rabbits exposed to heel lance (repeated measures, p < .05; Figure 4). Calculation of percentage change from baseline confirmed that uric acid concentration was increasing in the heel lance group while decreasing in the control group (1.5 ± 4.7% vs. –16.1 ± 4.2%, respectively, p = .03).
Figure 4.

Differences in uric acid concentration over time in rabbits without heel lance (control group, n = 5) and rabbits subjected to heel lance (heel lance group, n = 6). *Repeated measures ANOVA.
Discussion
Our preliminary work showed that neonatal rabbits can be successfully used as a model for acutely monitoring the effects of common NICU procedures on ATP metabolism and breakdown. After collecting blood at four different time points postcatheter placement, we observed that the marker we were measuring for this pilot study, plasma uric acid levels, began decreasing at the 2.5- and 3-hr time points. This decrease was most likely due to the enzymatic conversion of uric acid to allantoin or to urinary excretion, which is to be expected in control rabbits. In the absence of enhanced ATP breakdown, plasma uric acid levels will gradually stabilize or decrease (Calderon et al., 2008). The conversion of uric acid to allantoin occurs through the action of uricase, an enzyme present in rabbits (Truszkowski & Goldmanowna, 1933; Varela-Echavarria, Montes de Oca-Luna, & Barrera-Saldana, 1988).
At the 2.5- and 3-hr mark, we noted an opposite trend in rabbits exposed to a single heel lance (Figure 4). This increase in plasma uric acid concentration suggests that this common procedure can increase ATP utilization and breakdown. It is unclear if this increase in energy needs will exacerbate hypoxia in sick premature neonates. Further studies are needed to determine if enhanced ATP utilization due to exposure to common NICU procedures induces a hypoxic response, which may lead to inflammation and organ damage (Anand, 2000; Grunau, Holsti, & Peters, 2006).
One comment regarding difficulties we encountered in the use of this animal model might be helpful for future investigators. After evaluating several potential sites for central catheter placement, we found the highest success with the internal jugular vein. Although attempts to insert catheters into the femoral vein were moderately successful, the catheters fell out or kinked when the rabbits recovered from surgery and were permitted to move around freely. We disregarded other potential catheter insertion sites, such as the ear vein or the cephalic vein, because of vessel size and high incidence of vessel collapse when a sample is being aspirated. Even with the choice of the internal jugular vein, only 11 of the 15 catheters placed remained patent and allowed for repeated blood draws.
Our pilot study shows preliminary data documenting the use of this animal model to examine the relationship between a single commonly performed NICU procedure, heel lance, and markers of ATP breakdown. The model could also be used to study the biochemical effects of a combination of NICU procedures performed sequentially, leading to an examination of the biochemical effects of repetitive pain- or nonpain-inducing procedures. The rabbit's larger size relative to rats and mice would allow the measurement of other relevant biochemical markers of hypoxia, ATP breakdown, or oxidative stress, including plasma concentrations of ATP, adenosine diphosphate (ADP), adenosine monophosphate (AMP), adenosine, malondialdehyde, or F2 isoprostane. Although not performed in this current study, future investigators could develop and validate measures of pain specific to neonatal rabbits. This would allow the examination of the relationships among biochemical markers of ATP utilization, hypoxia, and behavioral markers of pain. Because the animals survive the catheterization and blood-sampling procedure, the model could also be used to investigate the possible link between procedural pain, increased ATP utilization, and organ impairment, such as white matter injury, through magnetic resonance imaging and spectroscopy.
Relevance to Nursing Practice and Research
NICU nurses perform many painful and nonpainful procedures on the neonates in their care. Although the effects of these procedures on heart rate and oxygen saturation is clearly visible at the bedside, it is unclear whether these alterations increase ATP utilization and decrease ATP synthesis, potentially increasing the risk of tissue hypoxia in fragile neonates. Researchers have hypothesized that hypoxia from pain and stress during many weeks and months in the NICU may be one contributing factor to white matter injury. However, this link remains speculative because the mechanisms that link pain with organ damage remain elusive. Use of this model may help elucidate the relationship between single, multiple, or repetitive NICU procedures and ATP breakdown and hypoxia. Because the animals are allowed to survive after sample collection, the effect of NICU procedures on organ damage could be elucidated through multiple imaging modalities (magnetic resonance imaging and spectroscopy) or tissue assays. Data from these studies could be used to test efficacy of treatment strategies and to develop innovative nursing interventions to prevent and treat potentially adverse consequences of commonly performed NICU procedures (Derrick, Drobyshevsky, Ji, & Tan, 2007; Derrick et al., 2004) in premature neonates.
Acknowledgments
Funding
The author(s) received no financial support for the research and/or authorship of this article.
Footnotes
Declaration of Conflicting Interests
The author(s) declared no potential conflicts of interests with respect to the authorship and/or publication of this article.
References
- Anand KJS. Pain, plasticity, and premature birth: A prescription for permanent suffering? Nature Medicine. 2000;6:971–973. doi: 10.1038/79658. [DOI] [PubMed] [Google Scholar]
- Bellieni CV, Iantorno L, Perrone S, Rodriguez A, Longini M, Capitani S, Buonocore G. Even routine painful procedures can be harmful for the newborn. Pain. 2009;147:128–131. doi: 10.1016/j.pain.2009.08.025. [DOI] [PubMed] [Google Scholar]
- Buonocore G, Perrone S, Longini M, Terzuoli L, Bracci R. Total hydroperoxide and advanced oxidation protein products in preterm hypoxic babies. Pediatric Research. 2000;47:221–224. doi: 10.1203/00006450-200002000-00012. [DOI] [PubMed] [Google Scholar]
- Calderon TC, Wu W, Rawson RA, Sakala EP, Sowers LC, Boskovic DS, Angeles DM. Effect of mode of birth on purine and malondialdehyde in umbilical arterial plasma in normal term newborns. Journal of Perinatology. 2008;28:475–481. doi: 10.1038/jp.2008.29. [DOI] [PMC free article] [PubMed] [Google Scholar]
- Carbajal R, Rousset A, Danan C, Coquery S, Nolent P, Ducrocq S, Bréart G. Epidemiology and treatment of painful procedures in neonates in intensive care units. JAMA. 2008;300:60–70. doi: 10.1001/jama.300.1.60. [DOI] [PubMed] [Google Scholar]
- Denenberg VH, Desantis D, Waite S, Thoman EB. The effects of handling in infancy on behavioral states in the rabbit. Physiology & Behavior. 1977;8:553–557. doi: 10.1016/0031-9384(77)90050-6. [DOI] [PubMed] [Google Scholar]
- Derrick M, Drobyshevsky A, Ji X, Tan S. A model of cerebral palsy from fetal hypoxia-ischemia. Stroke. 2007;38:731–735. doi: 10.1161/01.STR.0000251445.94697.64. [DOI] [PubMed] [Google Scholar]
- Derrick M, Luo NL, Bregman JC, Jilling T, Ji X, Fisher K, Tan S. Preterm fetal hypoxia-ischemia causes hypertonia and motor deficits in the neonatal rabbit: A model for human cerebral palsy? Journal of Neuroscience. 2004;24:24–34. doi: 10.1523/JNEUROSCI.2816-03.2004. [DOI] [PMC free article] [PubMed] [Google Scholar]
- Grunau RE, Holsti L, Peters JWB. Long-term consequences of pain in human neonates. Seminars in Fetal & Neonatal Medicine. 2006;11:268–275. doi: 10.1016/j.siny.2006.02.007. [DOI] [PubMed] [Google Scholar]
- Johnson MA, Tekkanat K, Schmaltz SP, Fox IH. Adenosine triphosphate turnover in humans. Decreased degradation during relative hyperphosphatemia. Journal of Clinical Investigation. 1989;84:990–995. doi: 10.1172/JCI114263. [DOI] [PMC free article] [PubMed] [Google Scholar]
- Maenpaa PH, Raivio KO, Kekomaki MP. Liver adenine nucleotides: Fructose-induced depletion and its effect on protein synthesis. Science. 1968;161:1253–1254. doi: 10.1126/science.161.3847.1253. [DOI] [PubMed] [Google Scholar]
- Plank MS, Boskovic DS, Sowers LC, Angeles DM. Biochemical markers of neonatal hypoxia. Pediatric Health. 2008;2:485–501. [Google Scholar]
- Plank M, Asmerom Y, Slater L, Ahmed M, Angeles K, Boskovic D, et al. (Meeting Abstract Supplement) FASEB J. 2010:lb126. [Google Scholar]
- Pokela M-L. Pain relief can reduce hypoxemia in distressed neonates during routine treatment procedures. Pediatrics. 1994;93:379–383. [PubMed] [Google Scholar]
- Ponti G, Peretto P, Bonfanti L. A subpial, transitory germinal zone forms chains of neuronal precursors in the rabbit cerebellum. Developmental Biology. 2006;294:168–180. doi: 10.1016/j.ydbio.2006.02.037. [DOI] [PubMed] [Google Scholar]
- Raivio KO, Kekomaki MP, Maenpaa PH. Depletion of liver adenine nucleotides induced by D-fructose. Dose-dependence and specificity of the fructose effect. Biochemical Pharmacology. 1969;18:2615–2624. doi: 10.1016/0006-2952(69)90192-0. [DOI] [PubMed] [Google Scholar]
- Saugstad OD. Hypoxanthine as a measurement of hypoxia. Pediatric Research. 1975;9:158–160. doi: 10.1203/00006450-197504000-00002. [DOI] [PubMed] [Google Scholar]
- Sparchott M. Pain, distress and the newborn baby. 1st ed. Blackwell Science; Malden, MA: 1997. [Google Scholar]
- Truszkowski R, Goldmanowna C. Uricase and its action: Distribution in various animals. Biochemical Journal. 1933;27:612–614. doi: 10.1042/bj0270612. [DOI] [PMC free article] [PubMed] [Google Scholar]
- Varela-Echavarria A, Montes de Oca-Luna R, Barrera-Saldana H. Uricase protein sequences: Conserved during vertebrate evolution but absent in humans. FASEB Journal. 1988;2:3092–3096. doi: 10.1096/fasebj.2.15.3192041. [DOI] [PubMed] [Google Scholar]