

Abstract
The derivation of dopamine neurons is one of the best examples of the clinical potential of embryonic stem (ES) cells, but the long-term function of the grafted neurons has not been established. Here, we show that, after transplantation into an animal model, neurons derived from mouse ES cells survived for over 32 weeks, maintained midbrain markers, and had sustained behavioral effects. Microdialysis in grafted animals showed that dopamine (DA) release was induced by depolarization and pharmacological stimulants. Positron emission tomography measured the expression of presynaptic dopamine transporters in the graft and also showed that the number of postsynaptic DA D2 receptors was normalized in the host striatum. These data suggest that ES cell-derived neurons show DA release and reuptake and stimulate appropriate postsynaptic responses for long periods after implantation. This work supports continued interest in ES cells as a source of functional DA neurons.
Keywords: Parkinson disease, Embryonic stem cell, Transplantation, Microdialysis, Positron emission tomography Dopamine transporter
Introduction
Parkinson disease is a neurodegenerative disorder characterized by the progressive loss of dopaminergic neurons in the substantia nigra. Transplantation of dopamine (DA) neuron precursors into the striatum of patients suggests that neuronal replacement may be a feasible treatment [1]. However, two recent double-blind transplantation trials with Parkinson disease patients raise concerns about both the therapeutic benefit and disabling consequences of fetal cell grafting [2–4]. Further development of a transplantation therapy requires a consistent source of DA neurons and clear evidence of DA function in preclinical models.
Fetal human tissue is currently used as a source of DA neurons, but this supply is limited and difficult to develop as a routine technology. In principle, the controlled proliferation and differentiation of fetal precursor cells is an attractive source for cell-based therapies. Precursor cells in the fetal midbrain can expand in tissue culture and generate DA neurons that provide behavioral recovery in parkinsonian animals [5, 6]. However, these cells only proliferate for short periods in culture and do not provide sufficient numbers of DA neurons. Embryonic stem (ES) cells may overcome the limitations of fetal donor tissue by offering both extensive cell proliferation and controlled differentiation to DA neurons [7, 8]. DA neurons derived from mouse and nonhuman primate ES cells integrate and provide behavioral recovery in several experimental animal models [9–14]. More recent work shows that human ES cells also differentiate into DA neurons, but the function of these cells has not been fully established [15–20]. Indeed, little evidence exists that neurons derived from ES cells from any species survive with DA function for long periods after grafting to the adult brain.
In the present study, the stability of DA neurons derived from ES cells was analyzed in vivo with a particular focus on their dopaminergic properties. Microdialysis was used to directly measure DA and DA breakdown products generated by grafted cells. Positron emission tomography (PET) imaging was used to measure both the presynaptic dopamine transporter (DAT) and the postsynaptic D2 dopamine receptor. We found that neurons derived from mouse ES cells survive in vivo for several months, express presynaptic dopaminergic features, and influence postsynaptic DA response mechanisms in striatal host cells.
Materials and Methods
In Vitro Differentiation of ES Cells to DA Neurons
Mouse R1 ES cells were induced to differentiate into neurons with DA phenotype using a previously established five-stage protocol [8]. This method is based on the formation of EBs and further selection, proliferation, and differentiation of neural progenitors into postmitotic neurons.
Immunocytochemistry and Histological Procedures
Cultured cells were fixed for immunostaining either at the proliferation or differentiation stage in 4% paraformaldehyde/0.15% picric acid/phosphate-buffered saline. The analysis of transplanted animals was made essentially as described [10]. Briefly, 32 weeks after grating, rats were anesthetized with sodium pentobarbital and transcardially perfused with isotonic saline, followed by the fixative solution used for cultured cells. The brains were dissected, postfixed for 4 hours, cryoprotected with 30% sucrose for 24–48 hours, and then frozen in isopentane cooled by solid CO2. Cryostat sections (25 μm) were stained as floating slices. Fixed cells or brain slices were incubated with the primary antibodies overnight at 4°C. The following antibodies were used: mouse anti-engrailed-1 (En-1), 1:10 (Developmental Studies Hybridoma Bank, Iowa City, IA, http://www.uiowa.edu/~dshbwww); rabbit anti-Lmx1b, 1:5,000 (gift from C. Birchmeier); goat anti-Foxa2, 1:50 (Santa Cruz Biotechnology Inc., Santa Cruz, CA, http://www.scbt.com); rabbit anti-tyrosine hydroxylase (TH), 1:400 (Pel-Freez, Rogers, AK, http://www.invitrogen.com); mouse anti-TH, 1:1,000 (Sigma-Aldrich, St. Louis, http://www.sigmaaldrich.com); mouse anti-Hu, 1:50 (Molecular Probes, Eugene, OR, http://www.invitrogen.com/); rabbit anti-Ptx3, 1:1,000 (gift from J. P. Burbach); rabbit anti-retinaldehyde dehydrogenase 1 (RALDH1), 1:100 (gift from G. Duester); mouse anti-calbindin, 1:3,000 (Sigma); and rat anti-DAT, 1:5,000 (Chemicon, Temecula, CA, http://www.chemicon.com). Appropriate fluorescent-tagged secondary antibodies (Molecular Probes) and 4′-6-diamidino-2-phenylindole nuclear counterstain (Sigma) were used for visualization. We used a Zeiss 510 confocal microscope to make optical sections of the cells after staining (Carl Zeiss, Jena, Germany, http://www.zeiss.com). Cells were counted in vitro by systematic sampling of 20× fields. Twenty fields were counted per tissue culture well, and four wells were analyzed for each condition in three independent differentiation experiments. TH+ somata in grafted animals were counted in every third section on 20× fields (n = 5). Only clearly stained cells with visible dendrites were scored as positive neurons.
Grafting and Implantation of Microdialysis Probe Holders
All experimental procedures conformed to the Guide for Care and Use of Laboratory Animals and were approved by the Animal Care and Use Committee of the National Institute of Neurological Disorders and Stroke. Taconic Farms (Germanton, NY, http://www.taconic.com) provided adult female Sprague-Dawley rats (170–190 g) with unilateral 6-hydroxy-dopamine (6-OHDA) lesions. A total of 8 μg of 6-OHDA was infused in 4 μl over 4 minutes into the nigrostriatal pathway. The animals were housed in a temperature-controlled environment with a 12-hour light-dark cycle for at least 1 week before the experiments began. Standard rat chow and distilled water were supplied ad libitum. ES-cell-derived neurons were trypsinized at day 2–3 of differentiation stage and resuspended at 80,000 viable cells per microliter after vital trypan blue exclusion counting. Animals were anesthetized with isoflurane, and two grafts were implanted by injecting 3 μl of the cell suspension into the lesioned striatum at the following coordinates: anteroposterior (AP) = +0.3 mm (first graft) and −0.3 mm (second graft), mediolateral (ML) = −3.0 mm, and dorsoventral (DV) = −6.0 mm relative to bregma and the skull, with the tooth bar set at 0.0 mm. We deposited 0.5 μl of cell suspension (grafted) or medium without cells (sham), waited 1 minute, advanced the syringe 0.5 mm dorsally, and injected 0.5 μl. This procedure was repeated five times to deposit cells over a distance of 2.5 mm in the dorsoventral axis. Implanted cells totalled 480,000 per animal—that is, a number that we previously showed to promote behavioral recovery [10]. We then implanted microdialysis probe holders bilaterally with stereotaxic coordinates AP = 0.0 mm, ML = ±3.0 mm, and DV = −2.0 mm and secured them with acrylic cement. Small screws were introduced into the skull, taking care of not damaging the brain, to provide support to the cement, which covered the probe holders and closed the wound completely. Sham and grafted subjects were immunosuppressed with cyclosporine A during the length of the experiment (Neoral; Novartis International, Basel, Switzerland, http://www.novartis.com; 10 mg/kg per day, intraperitoneally) starting 24 hours before grafting [10].
Rotational Behavior
Stereotypic rotational behavior was assessed (Rota Count-8; Columbus Instruments, Columbus, OH, http://www.colinst.com) for 70 minutes after injection of amphetamine (2.5 mg/kg, subcutaneous; Sigma). Asymmetry scores are expressed as net 360° turns per minute. Rotations were measured before and after cell grafting. Animals with stable scores of >6 ipsilateral turns per minute after lesion were used further. Spontaneous rotational test was performed as described [21].
Microdialysis Experiments
Twelve weeks after implantation surgery, 4-mm long microdialysis probes (CMA Microdialysis, Solna, Sweden, http://www.microdialysis.se) were introduced in both striata to measure extracellular monoamine concentrations. In vitro recovery experiments with the dialysis membranes had values of 18%, 15%, 17%, and 11% for DA, 3,4-dihydroxyphenylacetic acid (DOPAC), homovanillic acid, and 5-hydroxyindole acetic acid (5-HIAA), respectively. The probes were perfused with artificial cerebrospinal fluid at 2 μl per minute, and fractions were collected every 10 minutes. Monoamines were stabilized by adding a solution containing 0.1 N perchloric acid, 0.02% EDTA, and 1% ethanol, which was kept at 4°C, frozen in dry ice, and then stored at −80°C until measurement. Extracellular DA increases were obtained through chemical depolarization (isosmotic solution with 100 mM potassium chloride), DA uptake blockade (50 μM nomifensine), and reversal of DA uptake (30 μM amphetamine). Dialysate samples were quantified for monoamine content by high-performance liquid chromatography (HPLC) with electrochemical detection (GBC Scientific Equipment, Hubbardston, MA, http://www.gbcsci.com). No recovery correction was performed.
2β-Carbomethoxy-3β-(4-chlorophenyl)-8-(2-fluoroethyl)nortropane Imaging
PET DAT scans were performed at NIH 24–28 weeks following ES-cell transplantation. Animals were anesthetized with 1.5%–2.0% isoflurane, and body temperature was maintained at 36.5°C–37.0°C. The Advanced Technology Laboratory Animal Scanner PET device has an aperture of 11.8-cm diameter and a 2-cm axial field-of-view [22]. Each animal was positioned prone in the PET scanner so that striatum and cerebellum were within the field of view. Images were reconstructed by three-dimensional ordered subset expectation maximization algorithm (three iterations), achieving a 1.65-mm full-width at half-maximum resolution at the center [23–25]. The reconstructed voxel size was 0.56 × 0.56 × 1.125 mm. Coronal images were created for subsequent data analysis. Image data were not corrected for attenuation or scatter, which was relatively minor because of the rat’s small head.
2β-Carbomethoxy-3β-(4-chlorophenyl)-8-(2-fluoroethyl)nortropane ([18F]FECNT) was prepared as previously described [26, 27] with the principal modification being that the intermediate 1-[18F]fluoro-2-tosyloxyethane was purified by semipreparative HPLC (acetonitrile/water gradient; Waters Corporation, Milford, Massachusetts, http://www.waters.com; RP18 XTerra column 7.8 mm × 300 mm) and isolated in acetonitrile via solid phase extraction. The 18F-labeled alkylating agent was then reacted with 0.75 mg of 2β-carbomethoxy-3-β-(4-chlorophenyl)nortropane. The alkylation reaction was performed in an open, heated vessel (110°C, 10 minutes), and the acetonitrile solvent (originally ~1.2 ml) was concentrated to less than 0.1 ml by a low flow of helium gas (10 milliliters per minute) that was bubbled into the solution. A second HPLC purification on the semipreparative column using an acetonitrile/10 mM NH3 gradient afforded [18F]FECNT of high chemical and radiochemical purity. Specific activity at the time of injection ranged from 42.6 GBq/μmol (1.2 Ci/μmol) to 235.6 GBq/μmol (6.4 Ci/μmol) with a mean ± SD of 126.5 ± 75.7 GBq/μmol (3.4 ± 2.0 Ci/μmol).
To establish the methodology with [18F]FECNT, we used three groups of naïve rats that underwent one of the following procedures: (a) five animals received a bolus injection of 15–34 MBq per hour [18F]FECNT and were scanned for 120~180 minutes using 24 or 27 frames of increasing duration (6 × 20 seconds, 5 × 1 minutes, 4 × 2 minutes, 3 × 5 minutes, 3 × 10 minutes, 3–6 × 20 minutes); (b) five animals received 32–63 MBq per hour [18F]FECNT as a constant infusion for 240 minutes (30 frames: 6 × 20 seconds, 5 × 1 minutes, 4 × 2 minutes, 3 × 5 minutes, 3 × 10 minutes, 9 × 20 minutes), during which serial blood samples (25 μl) were collected every 20 minutes via a femoral artery catheter; (c) four animals were injected subcutaneously with methylphenidate (10 mg/kg) at the midpoint of constant infusion that was the junction of two 100-minute acquisitions (46 frames: 6 × 20 seconds, 5 × 1 minutes, 4 × 2 minutes, 3 × 5 minutes, 3 × 10 minutes, 2 × 20 minutes and 6 × 20 seconds, 5 × 1 minutes, 4 × 2 minutes, 3 × 5 minutes, 3 × 10 minutes, 2 × 20 minutes).
For 6-OHDA-lesioned rats, [18F]FECNT was administered as a constant infusion of 26–37 MBq per hour and a volume of 0.45–0.75 milliliters per hour. Rats with 6-OHDA lesions were uniformly scanned for 240 minutes, and a blood sample (50 μl) was collected from a lateral saphenous vein between 180 and 190 minutes after starting the infusion. Blood samples were centrifuged at 1,800g for 3 minutes. Plasma samples (50–80 μl) were mixed with 300 μl of acetonitrile containing UV-standard of FECNT followed by the addition of 100 μl of distilled water and mixed well. Radioactivity in this mixture was measured to calculate the concentration of total radioactivity (i.e., parent tracer plus metabolites) in plasma. Deproteinized plasma samples were then centrifuged at 9,400g for 4 minutes to remove the denatured proteins. To correct plasma parent concentrations for the presence of radiometabolites, the supernatant was analyzed with reversed phase HPLC on Novapak C18 column (Waters Corporation) with a radial compression module RCM-100 and a mobile phase of MeOH:H2O:Et3N (80:19.9:0.1) at a flow rate of 1.5 milliliters per minute. Recovery was always >90%. All radioactivity measurements were decay-corrected to the time of injection (T1/2 = 110 minutes). We found that the concentrations of parent [18F]FECNT in plasma were similar in femoral arterial and saphenous venous samples (unpublished data).
We recently reported that a radiolabeled metabolite of [18F]FECNT accumulates in rat brain and confounds the ability to quantify DAT [28]. The radiometabolite results from N-dealkylation and is an 18F-labeled two-carbon fragment, which rapidly converts from fluoroethanol to fluoroacetylaldehyde to fluoroacetic acid. The latter is charged and accumulates in brain. As described in Results, we developed a method of constant infusion of [18F]FECNT for the current study to provide reliable quantitation of the density of DAT in rodent brain. In brief, after constant infusion of the radiotracer, the concentration of parent radiotracer in plasma as well as specific binding in brain (defined as activity in striatum minus that in cerebellum) becomes stable. The ratio of specific binding in brain to the plasma radiotracer concentration is distribution volume, which is proportional to density (Bmax) of DAT [29].
[11C]Raclopride Imaging
After DAT imaging at NIH, the animals were transported to Brookhaven National Laboratory for PET DA D2 receptor scans that were performed 30–32 weeks after ES-cell transplantation. Rats were anesthetized intraperitoneally with ketamine (100 mg/kg)/xylazine (10 mg/kg) and placed in a stereotaxic head holder in a prone position on the Concorde microPET R4 scanner bed (Concorde Microsystems, Knoxville, TN). Animals were then injected via tail vein catheter with a mean dose of 1.56 nmol/kg [11C]raclopride (6.5 ± 3.0 MBq for grafted and 5.5 ± 2.8 MBq for sham; specific radioactivity was 81–170 GBq/μmol and injected volumes were <500 μl). [11C]raclopride binding in the microPET R4 has been previously demonstrated as a reproducible and suitable method to study the D2 receptor availability in the rodent brain [30, 31]. The microPET R4 scanner has a 12-cm animal port with an image field of view of ~11.5 cm. Total acquisition time was 60 minutes (24 frames: 6 × 10 seconds, 3 × 20 seconds, 8 × 1 minute, 4 × 5 minutes, 3 × 10 minutes), and data were acquired in fully dimensional mode with maximum axial acceptance angle (± 28°). Images were reconstructed using fast iterative image reconstruction (FORE) rebinning [32] followed by two-dimensional filtered back-projection with a ramp cutoff at Nyquist frequency. Using the rat stereotaxic atlas [33] and the Hardarian glands as reference points, the coronal planes of the striatum and cerebellum were identified as slices 6 and 16, respectively, caudal to the Hardarian glands (slice thickness, 1.2 mm) [30, 32–34].
Image Analysis
To define brain anatomic structures, magnetic resonance imaging (MRI) images were acquired using a 7T horizontal small animal MRI system (Bruker BioSpin, Billerica, MA, http://www.bruker-biospin.com) with a spin echo sequence (repetition time [TR] = 1,500 milliseconds, echo time [TE] = 10.29 milliseconds) from naïve rats with a similar body weight. PET images were analyzed with PMOD v2.4 (pixel-wise modeling computer software; PMOD Technologies Ltd., Zurich, Switzerland, http://www.pmod.com). Coregistration (FMRIB Software Library [FSL] Library, Oxford, http://www.fmrib.ox.ac.uk/fsl) of PET with the MRI images facilitated the placement of regions of interest over striatum and cerebellum. In the images of both [18F]FECNT and [11C]raclopride, the right striatum (nonlesioned side) was typically delineated on 3–4 different coronal planes, from which a central single image plane was chosen for analyzing regions of interest so as to minimize axial partial-volume effects [31]. The regions of interest (~22–28 mm3) followed the anatomical contour of the right striatum in the MRI image (Fig. 5D) and/or the stereotaxic rat brain atlas [33]. To be symmetrical, each template of the right striatum was copied and pasted/mirrored to the left striatum, with slight manual adjustment of placement according to anatomical references.
Figure 5.

Recovery on dopamine transporter binding after grafting of 6-hydroxy-dopamine lesioned animals performed 24–28 weeks after transplantation. (A): A naïve rat showed bilaterally symmetrical uptake of 2β-carbomethoxy-3β-(4-chlorophenyl)-8-(2-fluoroethyl)nortropane ([18F]FECNT) in striata following constant infusion of the radiotracer. (B): A hemiparkinsonian rat receiving sham treatment displayed negligible uptake in the lesioned striatum. (C): Embryonic stem (ES)-cell transplantation partially restored uptake of [18F]FECNT in the lesioned striatum of a hemiparkinsonian rat. (D): Positron emission tomography (PET) and magnetic resonance imaging images of hemiparkinsonian rat with ES-cell transplantation into the left striatum were coregistered to define anatomic structures. (E): ES-cell transplantation increased the ratio of activity in lesioned/nonlesioned striatum determined by PET imaging with [18F]FECNT. The ratio was greatly reduced in hemiparkinsonian rats that had either no intervention (n = 4) or sham treatment (n = 5). This reduced ratio significantly recovered after transplanting ES-cells into the lesioned striatum of hemiparkinsonian rats (n = 5; *, p < .01 by a two-tailed Student’s t test compared with rats receiving the sham treatment). The horizontal line on each group shows the mean value.
DAT binding of [18F]FECNT was quantified as an equilibrium distribution volume that was calculated as the stable level of specific binding in the brain divided by the stable plasma concentration of radiotracer [29, 35]. Specific binding was defined as the uptake in striatum minus that in cerebellum. D2 receptor binding of [11C]raclopride was analyzed with a multilinear reference tissue model [25].
Statistical Analysis
Each group of data passed a normality test before it was analyzed with parametric statistics. An unpaired two-tailed Student’s t test was used to assess group differences; a paired two-tailed Student’s t test was performed to make comparisons between bilateral striata. Significance was considered when p < .05 or p < .01.
Results
Expression of Midbrain-Specific Markers in Precursors and Differentiated Neurons
Mouse ES cells were differentiated following a five-stage protocol that allows efficient differentiation of DA neurons [8, 10]. Markers of regional identity such as En1, Pax2, and Otx2 showed that this method generated proliferating neural precursors with mid- and hindbrain phenotypes. The mid/hindbrain boundary region and the mesencephalic floor plate act as organizing centers regulating neuronal differentiation by the production of fibroblast growth factor (FGF)-8 and sonic hedgehog (Shh) [36]. The differentiation of ES cells into DA precursors was regulated by these signals and, thus, provided additional evidence that the in vitro generated cells mimic aspects of normal midbrain development. The five stages of the differentiation protocol are: (a) proliferating ES cells; (b) differentiating ES cell aggregates, EBs; (c) nestin-positive cells that migrate from the EBs under minimal growth conditions; (d) a proliferative step when these central nervous system precursor cells expand in number in the presence of FGF-8 and Shh; and (e) a differentiation step when neurons are generated. At (d), many cells expressing the transcription factors En1, Lmx1b, and Foxa2 were observed (Fig. 1A, 1B). Approximately 40% of the total cells expressed En1, a gene that has an important role in midbrain progenitors (Fig. 1B) [37]. Of the cells, 8% coexpressed all three genes (Fig. 1B). Cell autonomous expression of Lmx1b and Foxa2 are thought to be essential for the differentiation of DA neurons and the floor plate [38, 39]. During normal development, Foxa2+ floor plate cells directly generate the Lmx1b-positive DA neurons [40] (R. Kittappa, W. Chang, and R.D.G. McKay, unpublished observations). The coexpression of Foxa2 and Lmx1b suggests that this precursor cell type is also present in ES-derived En1+ populations (Fig. 1A, 1B). The presence of En1+, Foxa2−, Lmx1b+ cells was not expected from in vivo studies and might reflect short term regulation of the expression of the Foxa2 protein rather than a cell of a different fate [41]. These data show that 30% of the cells express En1 in combination with Foxa2 and Lmx1b, genes expressed in the ventral midbrain.
Figure 1.

Expression pattern of midbrain-related markers by progenitors and differentiated neurons generated from embryonic stem cells. (A): Triple immunocytochemical labeling for En1, Lmx1b, and Foxa2 in progenitor cells (day 4, stage IV). (B): Different cell populations expressing different combinations of genes were observed at this stage. The results are shown as mean ± SEM. (C): Triple immunocytochemical labeling in differentiated dopamine neurons (day 10, stage V). TH+ cells express neuronal marker Hu. Foxa2 expression is maintained in differentiated TH+ neurons. En1 is expressed in TH+ neurons, and Ptx3 expression emerges in most of them. Few TH+ neurons expressed calbindin, which did not colocalized with the Ptx3 gene. A fraction of TH+ neurons (42% ± 1%) expressed RALDH1 protein. Some TH± also coexpressed DAT. Scale = 20 μm. Abbreviations: DAPI, 4,6-diamidino-2-phenylindole; DAT, dopamine transporter; TH, tyrosine hydroxylase.
In the final step, this protocol generates neurons from neural precursors. After 10 days of differentiation in stage V, the gene expression profile of the differentiated neurons was assessed. All tyrosine hydroxylase positive (TH+) cells expressed the neuronal marker Hu (Fig. 1C). Approximately 11% ± 1% of Hu+ cells were also TH+. This result is consistent with previous data suggesting that, without genetic manipulation, a small proportion of neurons acquire the dopaminergic fate [8, 10]. Foxa2 is also expressed in mature DA neurons (R. Kittappa, W. Chang, and R.D.G. McKay, unpublished data) and 30% ± 3% of the Foxa2± neurons generated in vitro coexpressed TH (Fig. 1C). En1 was coexpressed in all TH+ neurons, as has been observed in differentiated adult DA neurons and in DA neurons generated in the lab (Fig. 1C) [37, 10]. Ptx3 is a transcription factor specifically expressed in DA neurons [42]. Ptx3 was coexpressed in the great majority of TH+ neurons (99% ± 1%; Fig. 1C). Calbindin is expressed in the dorsal part of the sub-stantia nigra pars compacta and the ventral tegmental area of rats [43]. Only a small proportion (1% ± 0.1%) of the TH+ neurons coexpressed calbindin in vitro (Fig. 1C). RALDH1 is also a specific marker of DA neurons in the ventral part of the substantia nigra pars compacta [44, 45]. In ES cell-derived neurons, 42% ± 1% of TH+ cells express RALDH1 (Fig. 1C). The DAT is critical to appropriate neurotransmitter recycling [46, 47]. DAT was expressed by TH+ cells after longer times of in vitro differentiation (20 days in stage V, Fig. 1C). Calretinin expression is found in the substantia nigra pars compacta and the ventral tegmental area. Calretinin+ cells were observed in stage V, but none of them coexpressed TH (data not shown). These data suggest that TH+ neurons derived from ES cells have patterns of gene expression characteristic of dopaminergic cells in the ventral midbrain.
In this study, the mouse ES cells were not genetically manipulated, and simple differentiation conditions for DA neurons were employed. The presence of neurons coexpressing TH and other markers of the ventral DA cell in the substantia nigra suggests that ES cells may generate the DA neuron type at most risk in Parkinson disease [48]. Other types of neurons are also present. A clear example is the small proportion of serotonin+ neurons that may represent hindbrain monoaminergic cells, as we have previously noted [10]. This analysis of gene expression raised the question of whether the transplanted population of cells had sufficient DA neurons of the ventral pars compacta type to be effective in the lesioned striatum.
Long-Term Sustained Behavioral Recovery Induced by Partial Restoration of DA Striatal Terminal Field
Neurons derived from the same batch as characterized above were grafted into the striatum of 6-OHDA lesioned animals. The behavior of transplanted animals was measured for up to 32 weeks after the surgery as a first measure of long-term survival of functional grafted neurons. Four weeks after implantation into the dorsal striatum, the grafts caused an abrupt change of amphetamine-induced rotational behavior (Fig. 2A). The kinetics of the behavioral recovery was comparable to that in our previous study [10]. In contrast, a gradual change in behavior has been reported when no specific in vitro steps were used to control ES cell differentiation prior to grafting [9]. With the exception of a slight change at 12 weeks after grafting that is coincident with the placement of a microdialysis probe and a possible disruption of dopaminergic terminals, this behavioral change was stable for 32 weeks. Nonpharmacological evaluation of rotational behavior was also performed until 14 weeks after transplantation, thus demonstrating significant recovery (supplemental online Fig. 1).
Figure 2.

Behavioral recovery after embryonic stem (ES)-cell-derived dopamine (DA) neuron grafting, phenotype of grafted DA neurons, and restoration of DA terminal field in 6-hydroxy-dopamine lesioned striatum by grafted cells. (A): Grafting of ES cells caused significant recovery of amphetamine-induced rotational behavior. The results are shown as mean ± SEM (n = 5; *, p < .01; #, p < .05 by a two-tailed Student’s t test compared with rats receiving sham treatment). (B): Double immunocytochemical staining of grafted DA neurons performed at the endpoint of the experiment (i.e., 32 weeks after transplantation). Donor origin of grafted DA neurons was confirmed by colabeling with the mouse-specific antigen M2. Some TH+ neurons coexpressed RALDH1, and we also found TH+/calbindin+ neurons. Double-positive neurons for TH and calretinin were present, as well as TH−/calretinin+ cells. Scale = 20 μm. (C): ES cell-derived DA neurons partially restored TH and RALDH1 immunoreactivity in the lesioned side. TH (green) immunostaining is shown for the grafted (left, C1) and nonlesioned (right, C2) sides, and RALDH1 (red) is shown for the grafted (C3) and nonlesioned (C4) sides. DAPI staining is shown in blue. Scale = 1 mm. Abbreviations: DAPI, 4,6-diamidino-2-phenylindole; [18F]FECNT, 2β-carbomethoxy-3β-(4-chlorophenyl)-8-(2-fluoroethyl)nortropane; TH, tyrosine hydroxylase.
ES cell-derived progeny in the host brains were identified with the mouse-specific M2 antibody, allowing clear identification of the graft (Fig. 2B). TH+ cells with elaborate dendritic processes were observed. The maintenance of the midbrain phenotype in grafted TH+ neurons was assessed by the expression of some midbrain-related markers. Grafted TH+ neurons expressed RALDH1 and calbindin (Fig. 2B). Differently from the in vitro situation, we found that some TH+ neurons in the graft expressed calretinin (Fig. 2B). The grafts projected a dense extension of TH+ processes into the dorsolateral striatum (Fig. 2C1). RALDH1 immunostaining identified projections in a similar distribution to TH in the dorsal striatum (Fig. 2C3). On the nonlesioned side of the brain, RALDH1-positive processes from the DA neurons of the ventral substantia nigra projected to the dorsolateral striatum, as previously reported (Fig. 2C4) [44]. At 32 weeks, 5,385 ± 4,638 (mean ± SEM) TH+ cells were found in lesioned striatum of grafted animals. Thus, grafted DA neurons survived in large numbers for 32 weeks, maintained midbrain markers, extended strong RALDH1 projection to the dorsolateral striatum, and regulated behavior.
DA Release and Monoamine Levels in Grafted Animals
Microdialysis was used to monitor DA production by the grafted cells. Extracellular monoamine levels were measured simultaneously in the lesioned and nonlesioned striata of sham and grafted animals. Baseline DA levels were elevated on both sides of the brain after grafting, although only in the grafted side reached statistical significance when comparison was performed against both striata of sham animals (Table 1). In contrast to DA itself, the metabolites DOPAC and HVA showed right/left asymmetry. Grafting caused a partial restoration of DOPAC and HVA concentrations to about 10% of basal levels (Table 1). The level of the 5-HT metabolite, 5-HIAA, was not altered by the lesion to the DA neurons. A significantly higher level was found in the grafted striatum either as a consequence of 5HT-positive neurons in the graft as we have shown [10] or due to sprouting of intrinsic serotonergic afferents to striatum induced by grafted DA cells [49, 50]. The cause and consequence of bilaterally elevated basal DA levels are not known, but these data demonstrate that DA and its metabolites are elevated in grafted animals.
Table 1.
Basal levels of monoamines in perfusates from striatum of sham and grafted animals in lesioned and nonlesioned sides
| Treatment side | Sham (nM)
|
Grafted (nM)
|
||
|---|---|---|---|---|
| Left lesioned | Right nonlesioned | Left lesioned | Right nonlesioned | |
| DA | 0.76 ± 0.10 | 0.78 ± 0.06 | 2.18 ± 0.16a | 2.05 ± 0.69 |
|
| ||||
| DOPAC | 4.26 ± 2.07b | 3105 ± 707 | 233 ± 44a | 2861 ± 734 |
|
| ||||
| HVA | 3.87 ± 2.53b | 2283 ± 437 | 240 ± 41a | 2110 ± 421 |
|
| ||||
| 5-HIAA | 115 ± 35 | 127 ± 38 | 362 ± 78a | 204 ± 55 |
Data (mean ± SEM) are averaged from three baseline samples (paired Student’s t test).
p < .01 left grafted vs. left and right sham sides.
p < .01 left sham vs. right sham.
Abbreviations: DA, dopamine; DOPAC, 3,4-dihydroxyphenylacetic acid; HIAA, hydroxyindole acetic acid; HVA, homovanillic acid.
Extracellular DA levels were measured following three pharmacological challenges: (a) depolarization induced by K+ ions, (b) inhibition of DAT reuptake with nomifensine, and (c) administration of amphetamine, which causes the release of DA via DAT [51]. Perfusion of isosmotic 100 mM K+, 50 μM nomifensine, and 30 μM amphetamine each caused increased DA levels in the nonlesioned striata (Fig. 3A). On the lesioned side of sham animals, treatment evoked no change in DA levels, establishing that the lesions were virtually complete (Fig. 3B). Although DA levels were much lower than those in nonlesioned sides, the ES cell-derived neurons responded to the three treatments (Fig. 3B). Significant differences were found between sham and grafted groups after K+-induced depolarization and nomifensine perfusion. In the case of amphetamine, the differences did not reach statistical significance, perhaps due to the variability of the graft response. In both grafted and nonlesioned sides, DOPAC and HVA values decreased after high potassium and amphetamine stimulation, as has been previously shown in grafts of DA neurons derived from fetal midbrain (Fig. 3C) [52]. These measurements show that depolarization and DAT blockade elevate extracellular DA levels.
Figure 3.
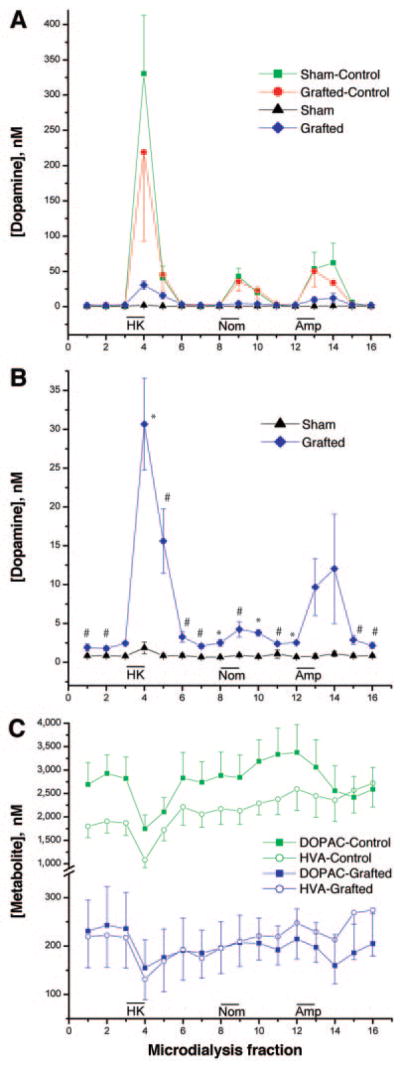
Effect of embryonic stem cell-derived dopamine (DA) neuron graft on monoamine levels studied in vivo by microdialysis performed 12 weeks after grafting. (A): Time-course on DA concentration level after 100 mM K+ isosmotic medium, 50 μM nomifensine, and 30 μM amphetamine in the lesioned and nonlesioned sides of sham and grafted animals. (B): Time-course on DA level shown in (A) for lesioned sides in grafted and sham groups is shown at bigger scale. (C): Time-course of DOPAC and HVA concentrations for nonlesioned sides of both sham and grafted animals and for the lesioned side that received DA neurons. The results are shown as mean ± SEM (n = 5; *, p < .01; #, p < .05 by a two-tailed Student’s t test compared with rats receiving the sham treatment). Abbreviations: DOPAC, 3,4-dihydroxyphenylacetic acid; HK, high potassium; HVA, homovanillic acid.
[18F]FECNT Imaging Showed Partial Recovery of DA Terminals in the Lesioned Striatum Following Transplantation
PET provides a useful noninvasive measure of PD-related changes associated with disease severity [53, 54]. PET imaging has been used to monitor the function of grafted human fetal DA neurons [2, 55–57]. We developed a method that was independent of cerebral blood flow to measure the abundance of the presynaptic DAT in the striatum of rats using the recently developed radiotracer [18F]FECNT [26, 27]. We found that [18F]FECNT generates a radiolabeled two-carbon fragment that accumulates in rat brain [28]. The levels of this radiometabolite were measured following injection of the radiotracer (Fig. 4A). The radioactive signal in the cerebellum was stable after approximately 30 minutes. In contrast, the striatum with a high density of DAT showed a stronger signal that declines as the ligand dissociates from the transporter.
Figure 4.

Dynamic positron emission tomography imaging in naïve rats with [18F]FECNT. (A): Approximately 30 minutes after bolus injection of [18F]FECNT (n = 5), activity in cerebellum was stable despite declining concentrations in striatum. (B): After approximately 150 minutes of constant infusion of [18F]FECNT (n = 5), activities in striatum and cerebellum increased in a linear and parallel manner. Specific binding was operationally defined as the difference between striatum and cerebellum and, therefore, became stable after approximately 150 minutes. The plasma concentration of [18F]FECNT separated from radiometabolites (upper curve) after ~170 minutes of infusion was also obtained. The y-axis on left is for brain measurements and is expressed as percentage of the activity infused per hour. The y-axis on right is the plasma measurements of the concentration of [18F]FECNT and is expressed as a percentage of the constant infusion: ([plasma [18F]FECNT dpm/ml]/activity [mCi] infused per hour) × 100. (C): The difference in time activity curves between striatum and cerebellum was confirmed to be specific binding, since methylphenidate displaced [18F]FECNT in striatum to background levels in cerebellum (n = 4). Abbreviations: CBL, cerebellum; [18F]FECNT, 2β-carbomethoxy-3β-(4-chlorophenyl)-8-(2-fluoroethyl)nortropane; h, hour; min, minutes; SPEC, specific binding; STR, striatum.
These observations led us to administer [18F]FECNT as a constant infusion to achieve steady state levels of parent radiotracer in plasma and equilibrium levels of receptor binding in brain. Following constant infusion of [18F]FECNT, radioactivity in both striatum and cerebellum increased for at least 240 minutes, but the subtraction (STR – CBL) of these two signals was stable after approximately 120 minutes (Fig. 4B). Specific binding was defined as the difference between uptake in striatum and cerebellum. This specific uptake reached equilibrium levels by 150 minutes. The slopes of the fitted lines were only 5.6% ± 4.6% per hour, expressed as the mean ± SD of the absolute value of slope relative to the value at 150 minutes (n = 5 rats). Measurements of arterial blood samples showed plasma [18F]FECNT reached steady-state after approximately 150 minutes constant infusion (Fig. 4B). Plasma concentrations of the parent tracer separated from radiometabolites of individual rats after 150 minutes of constant infusion were fitted linearly. The slopes of these fitted lines were 3.7% ± 5.6% per hour, expressed as the mean of the absolute values. Injection of methylphenidate displaced the specifically bound signal in the striatum to background levels providing additional support for the specific measurement of DAT in the striatum (Fig. 4C).
Distribution volume is a time- and blood flow-independent parameter that is linearly proportional to receptor density [35]. The constant infusion paradigm allowed a relatively simple calculation of distribution volume as the mean specific binding (= striatum minus cerebellum) from 150 to 210 minutes divided by the plasma radiotracer concentration at 180–190 minutes. The nonlesioned side (right) of the striatum preserved robust uptake of the tracer (Fig. 5B), similar to concentrations seen in naïve animals (Fig. 5A). In contrast, uptake in the lesioned (left) striatum of sham rats, measured as the ratio of the lesioned/nonlesioned, was reduced by >90% (Fig. 5B, 5E). The tracer uptake was not significantly different in rats receiving the sham procedures (5% ± 3%) compared to no-intervention lesioned animals (4% ± 3%; Fig. 5E). In contrast, tracer uptake was partially restored to 38% ± 17% of controls in the lesioned striatum after grafting (Fig. 5C, 5E; p < .01).
Specific binding of [18F]FECNT in the lesioned and transplanted striatum (Fig. 6B) was higher than that of sham animals (Fig. 6A). The distribution volumes of the nonlesioned striata were similar in sham and transplanted rats (Fig. 6C). In contrast, the distribution volumes of the lesioned striata were significantly increased by transplantation (Fig. 6C; 6.71 ± 1.7 vs. 1.15 ± 0.23, p < .01, mean ± SEM). Distribution volume measurements correct for potential blood flow changes in the lesioned striata and show that grafting is associated with long-term expression of DAT.
Figure 6.

Recovery on 2β-carbomethoxy-3β-(4-chlorophenyl)-8-(2-fluoroethyl)nortropane ([18F]FECNT)-specific binding after grafting of 6-hydroxy-dopamine lesioned animals. Time activity curves following constant infusion of [18F]FECNT in rats with (A) sham treatment and (B) embryonic stem (ES) cell transplantation. After 120–150 minutes of constant infusion, uptake in both striatum and cerebellum ascended linearly, and specific binding (SPEC = STR – CBL) became stable. Specific binding in the lesioned striatum displayed a minimal level in rats receiving sham treatment ([A]; n = 5) but increased to approximately one-third the level of nonlesioned striatum after ES cell transplantation ([B]; n = 5). The y-axis is expressed as percentage of the activity infused per hour. Results are shown as mean ± SEM. (C): Distribution volumes of [18F]FECNT-specific binding in striata of hemiparkinsonian rats. The distribution volumes of the nonlesioned striata were similar in sham (n = 5) and ES cell transplanted (n = 5) animals. In contrast, the distribution volumes of the lesioned striata were significantly higher in transplanted than in sham animals (6.71 ± 1.7 vs. 1.15 ± 0.23; *, p < .01 by a two-tailed Student’s t test compared with rats receiving the sham treatment). The horizontal line on each group shows the mean value. Abbreviations: CBL, cerebellum; h, hour; min, minutes; SPEC, specific binding; STR, striatum.
[11C]Raclopride Imaging Indicated Normalization of Upregulated Postsynaptic D2 Receptors
PET imaging was also performed with [11C]raclopride, which binds to D2 dopamine receptors that are present postsynaptically on a subset of striatal medium spiny neurons. Treatment with 6-OHDA caused asymmetrical uptake of [11C]raclopride, consistent with increased density of D2 receptors on the side of the lesion [58]. The binding potential of [11C]raclopride increased significantly in sham animals when left and right striata were compared (2.01 ± 0.28 vs. 1.52 ± 0.34, p < .01, n = 4, mean ± SEM). Transplantation normalized D2 receptors so that the uptake of [11C]raclopride was similar in both striata (1.51 ± 0.18 vs. 1.50 ± 0.08, n = 5, mean ± SEM) and significantly different to left side of sham animals (p = .01; supplemental online Fig. 2). These data suggest that grafted neurons act on host target cells to correct the supersensitive increase in DA D2 receptors.
Discussion
To validate ES cells as a suitable source of DA neurons for cell-based therapy in Parkinson disease, it is important that the neurons maintain DA neurotransmitter functions for prolonged periods. In previous studies, we have used electrophysiological and behavioral tools to characterize grafted neurons [10]. However, the electrophysiological approach may be subject to a bias due to the choice of specific neurons for recording, and the behavioral measures are indirect tests of neuronal function. In this work, we have defined long-term dopamine function in grafted animals. The expression of En1, Lmx1b, and Foxa2 characterizes neural progenitor cells generated from ES cells as midbrain cells. After further in vitro differentiation, many TH+ neurons maintained the midbrain phenotype defined by expression of En1, Foxa2, Ptx3, and RALDH1. These results extend our previous observations by showing that ES cells without genetic modification generate neurons that sustain dopamine functions for long periods after grafting.
The ES cell-derived DA neurons restored the terminal axonal field in the dorsolateral striatum and expressed the midbrain markers calbindin, calretinin, and RALDH1, suggesting that at least a proportion of the grafted TH+ neurons maintain this specific midbrain phenotype following transplantation. Retinoic acid modulates the level of striatal DA receptors [59–61] and retinoic receptor mutant mice show locomotor defects that can be related to decreased levels of DA receptors [62]. Future work should more fully characterize the DA neurons in the graft to determine if RALDH1-positive cells specifically project to the host and analyze the role of retinoic acid on pre-and postsynaptic functions.
Previous studies show that the effect of grafted primary cells on behavior requires the continued presence of DA neurons [63]. The behavioral data reported here show that transplanted animals have altered behavior for 7 months. Microdialysis suggests that the grafted cells have activity-dependent release and a high affinity reuptake system for dopamine. The elevated baseline DA level compared to the partial recovery of stimulated DA release point to autoregulatory mechanisms that maintain a normal DA tone despite the inadequate restoration of dopaminergic synapses. A similar phenomenon has been observed in studies of grafted fetal nigral tissue [64–66]. A candidate to control baseline DA level is the DAT. PET chemistry confirms the expression of the DAT; however, post-translational modifications regulate DAT function and may explain the elevated DA level in the presence of DAT [51, 67].
The PET study supports the utility of DAT imaging as a noninvasive in vivo marker for the survival of grafted DA neurons. [18F]FECNT was previously used in monkeys [26], healthy human subjects, and patients with Parkinson disease [27] with a high ratio of specific to nonspecific uptake. Contrary to prior reports [26], [18F]FECNT showed significant accumulation of a polar radiometabolite in rat brain [28]. Because of the time-dependent changes in both parent and radiometabolite in brain following a typical bolus injection, no single time point could be a priori selected to measure DAT density. For example, Figure 4A shows that the ratio of striatum to cerebellum continuously declined after about 30 minutes. At what time does this ratio of specific to nonspecific uptake reflect DAT density? In the current study, we administered [18F]FECNT as a constant infusion and obtained temporally stable levels of specific binding in striatum as well as the concentration of parent radiotracer in plasma. Distribution volume is the ratio at equilibrium of specific binding in brain to the concentration of drug in plasma, and it is usually regarded as the “gold standard” measurement of in vivo receptor density. A simple left/right ratio of activity in lesioned to nonlesioned striata can be used to measure DAT levels (Fig. 5E). However, this ratio cannot distinguish whether the lesion or transplant caused any changes to the control side of the brain. Distribution volume can accomplish this comparison, and we report that DAT densities were the same in nonlesioned striata of sham and transplanted animals.
DAT imaging in rodents has been used to monitor fetal mesencephalic [68] and ES-cell transplantation [9]. The latter study used [11C]CFT, a close chemical analog of [18F]FECNT, and found that, at 9 weeks after transplantation, the grafted striata of animals with behavioral improvement reached approximately 75%–90% of DAT levels in the contralateral/nonlesioned side [9]. We report DAT levels of only approximately 40% in the graft with wide variation from ~15%–55%. The difference between these two studies may be caused by the development of teratomas in the previous study and altered blood flow. In animals grafted with the multistep protocol, no teratomas were found, and this is a prerequisite for the long survival times studied here. Our results show that significant behavioral recovery occurs when approximately 40% of DA terminals are restored.
The level of D2 receptor expression on striatal neurons was measured by [11C]raclopride PET imaging. Suppression of up-regulated postsynaptic D2 receptors by fetal DA grafts has been shown in parkinsonian rats [69–71] and in a Parkinson disease patient 10 years after fetal transplantation [55]. Our data show that D2 receptor densities may be normalized throughout the striatum despite the partial restoration of DA fibers found in the grafted animals. Efficient uptake of DA has been shown in primary grafted DA neurons [65, 72, 73], but other studies report diffusion of extracellular DA that may elevate DA tone over nonreinnervated areas [74–76]. The elevated baseline DA we report in grafted animals may account for the normalization of D2 receptor binding. Recent work shows that DA denervation leads to rapid changes in spine density in striatopallidal medium spiny neurons [77]. It will be interesting to analyze other features of postsynaptic neurons, including spine density in grafted animals.
In summary, the data presented here show that both pre- and postsynaptic functions can be restored by grafting DA neurons derived from ES cells. The immortal nature of ES cells will allow genetic manipulations to more precisely define the mechanisms regulating the survival and function of DA neurons. This feature will be particularly valuable for cell-therapy studies with human ES cells.
Acknowledgments
We thank Dr. Raja Kittappa and Dr. Sachiko Murase for valuable advice and discussion and Jeeva Munasinghe (NINDS) for his technical help with acquiring rat MRI images. We are grateful to Carmen Birchmeier (Max-Delbruck-Center of Molecular Medicine, Berlin, Germany), J. Peter Burbach (Rudolph Magnus Institute of Neuroscience, Utrech, The Netherlands), and Greg Duester (Burnham Institute, La Jolla, California) for their gifts of antibodies. I.V. was a Pew Latin American Fellow during his stay at NIH and had partial support from DGAPA, UNAM (IN226703). This work was supported in part by the Intramural Program of NIMH (project Z01-MH-002795-04). J.A.R.-G. is currently affiliated with the Laboratorio de Investigaciones Biomédicas, Hospital Universitario Virgen del Rocío, Seville, Spain; J.-Q.L. is currently affiliated with the Department of Pathology & Lab Medicine, Foothills Medical Centre, Calgary, Canada; I.V. is currently affiliated with the Instituto de Fisiología Celular, Universidad Nacional Autónoma de México, Mexico City, Mexico.
Footnotes
Disclosure of Potential Conflicts of Interest
The authors indicate no potential conflicts of interest.
References
- 1.Lindvall O, Bjorklund A. Cell therapy in Parkinson’s disease. NeuroRx. 2004;1:382–393. doi: 10.1602/neurorx.1.4.382. [DOI] [PMC free article] [PubMed] [Google Scholar]
- 2.Freed CR, Greene PE, Breeze RE, et al. Transplantation of embryonic dopamine neurons for severe Parkinson’s disease. N Engl J Med. 2001;344:710–719. doi: 10.1056/NEJM200103083441002. [DOI] [PubMed] [Google Scholar]
- 3.Olanow CW, Goetz CG, Kordower JH, et al. A double-blind controlled trial of bilateral fetal nigral transplantation in Parkinson’s disease. Ann Neurol. 2003;54:403–414. doi: 10.1002/ana.10720. [DOI] [PubMed] [Google Scholar]
- 4.Hagell P, Piccini P, Bjorklund A, et al. Dyskinesias following neural transplantation in Parkinson’s disease. Nat Neurosci. 2002;5:627–628. doi: 10.1038/nn863. [DOI] [PubMed] [Google Scholar]
- 5.Studer L, Tabar V, McKay RD. Transplantation of expanded mesencephalic precursors leads to recovery in parkinsonian rats. Nat Neurosci. 1998;1:290–295. doi: 10.1038/1105. [DOI] [PubMed] [Google Scholar]
- 6.Sanchez-Pernaute R, Studer L, Bankiewicz KS, et al. In vitro generation and transplantation of precursor-derived human dopamine neurons. J Neurosci Res. 2001;65:284–288. doi: 10.1002/jnr.1152. [DOI] [PubMed] [Google Scholar]
- 7.Kawasaki H, Mizuseki K, Nishikawa S, et al. Induction of midbrain dopaminergic neurons from ES cells by stromal cell-derived inducing activity. Neuron. 2000;28:31–40. doi: 10.1016/s0896-6273(00)00083-0. [DOI] [PubMed] [Google Scholar]
- 8.Lee SH, Lumelsky N, Studer L, et al. Efficient generation of midbrain and hindbrain neurons from mouse embryonic stem cells. Nat Biotechnol. 2000;18:675–679. doi: 10.1038/76536. [DOI] [PubMed] [Google Scholar]
- 9.Bjorklund LM, Sanchez-Pernaute R, Chung S, et al. Embryonic stem cells develop into functional dopaminergic neurons after transplantation in a Parkinson rat model. Proc Natl Acad Sci U S A. 2002;99:2344–2349. doi: 10.1073/pnas.022438099. [DOI] [PMC free article] [PubMed] [Google Scholar]
- 10.Kim JH, Auerbach JM, Rodriguez-Gomez JA, et al. Dopamine neurons derived from embryonic stem cells function in an animal model of Parkinson’s disease. Nature. 2002;418:50–56. doi: 10.1038/nature00900. [DOI] [PubMed] [Google Scholar]
- 11.Barberi T, Klivenyi P, Calingasan NY, et al. Neural subtype specification of fertilization and nuclear transfer embryonic stem cells and application in parkinsonian mice. Nat Biotechnol. 2003;21:1200–1207. doi: 10.1038/nbt870. [DOI] [PubMed] [Google Scholar]
- 12.Takagi Y, Takahashi J, Saiki H, et al. Dopaminergic neurons generated from monkey embryonic stem cells function in a Parkinson primate model. J Clin Invest. 2005;115:102–109. doi: 10.1172/JCI21137. [DOI] [PMC free article] [PubMed] [Google Scholar]
- 13.Sanchez-Pernaute R, Studer L, Ferrari D, et al. Long-term survival of dopamine neurons derived from parthenogenetic primate embryonic stem cells (Cyno1) after transplantation. Stem Cells. 2005;23:914–922. doi: 10.1634/stemcells.2004-0172. [DOI] [PMC free article] [PubMed] [Google Scholar]
- 14.Kim DW, Chung S, Hwang M, et al. Stromal cell-derived inducing activity, nurr1, and signaling molecules synergistically induce dopaminergic neurons from mouse embryonic stem cells. Stem Cells. 2006;24:557–567. doi: 10.1634/stemcells.2005-0233. [DOI] [PMC free article] [PubMed] [Google Scholar]
- 15.Zeng X, Cai J, Chen J, et al. Dopaminergic differentiation of human embryonic stem cells. Stem Cells. 2004;22:925–940. doi: 10.1634/stemcells.22-6-925. [DOI] [PubMed] [Google Scholar]
- 16.Ben-Hur T, Idelson M, Khaner H, et al. Transplantation of human embryonic stem cell-derived neural progenitors improves behavioral deficit in Parkinsonian rats. Stem Cells. 2004;22:1246–1255. doi: 10.1634/stemcells.2004-0094. [DOI] [PubMed] [Google Scholar]
- 17.Park CH, Minn YK, Lee JY, et al. In vitro and in vivo analyses of human embryonic stem cell-derived dopamine neurons. J Neurochem. 2005;92:1265–1276. doi: 10.1111/j.1471-4159.2004.03006.x. [DOI] [PubMed] [Google Scholar]
- 18.Yan Y, Yang D, Zarnowska ED, et al. Directed differentiation of dopaminergic neuronal subtypes from human embryonic stem cells. Stem Cells. 2005;23:781–790. doi: 10.1634/stemcells.2004-0365. [DOI] [PMC free article] [PubMed] [Google Scholar]
- 19.Brederlau A, Correia AS, Anisimov SV, et al. Transplantation of human embryonic stem cell-derived cells to a rat model of Parkinson’s disease: Effect of in vitro differentiation on graft survival and teratoma formation. Stem Cells. 2006;24:1433–1440. doi: 10.1634/stemcells.2005-0393. [DOI] [PubMed] [Google Scholar]
- 20.Roy NS, Cleren C, Singh SK, et al. Functional engraftment of human ES cell-derived dopaminergic neurons enriched by coculture with telomerase-immortalized midbrain astrocytes. Nat Med. 2006;12:1259–1268. doi: 10.1038/nm1495. [DOI] [PubMed] [Google Scholar]
- 21.Nikkhah G, Duan WM, Knappe U, et al. Restoration of complex sensorimotor behavior and skilled forelimb use by a modified nigral cell suspension transplantation approach in the rat Parkinson model. Neuroscience. 1993;56:33–43. doi: 10.1016/0306-4522(93)90559-x. [DOI] [PubMed] [Google Scholar]
- 22.Seidel J, Vaquero J, Green M. Resolution uniformity and sensitivity of the NIH ATLAS small animal PET scanner: Comparison to simulated LSO scanners without depth-of-interaction capability. IEEE Trans Nucl Sci. 2003;50:1347–1350. [Google Scholar]
- 23.Johnson CA, Seidel J, Vaquero JJ, et al. Exact positioning for OSEM reconstructions on the ATLAS depth-of-interaction small animal scanner. Mol Imaging Biol. 2002;4:S22. [Google Scholar]
- 24.Liow J, Seidel J, Johnson CA, et al. A single slice rebinning/2D exact positioning OSEM reconstruction for the NIH ATLAS small animal PET scanner. J Nucl Med. 2003;44:163P. [Google Scholar]
- 25.Ichise M, Liow JS, Lu JQ, et al. Linearized reference tissue parametric imaging methods: Application to [11C]DASB positron emission tomography studies of the serotonin transporter in human brain. J Cereb Blood Flow Metab. 2003;23:1096–1112. doi: 10.1097/01.WCB.0000085441.37552.CA. [DOI] [PubMed] [Google Scholar]
- 26.Goodman MM, Kilts CD, Keil R, et al. 18F-labeled FECNT: A selective radioligand for PET imaging of brain dopamine transporters. Nucl Med Biol. 2000;27:1–12. doi: 10.1016/s0969-8051(99)00080-3. [DOI] [PubMed] [Google Scholar]
- 27.Davis MR, Votaw JR, Bremner JD, et al. Initial human PET imaging studies with the dopamine transporter ligand 18F-FECNT. J Nucl Med. 2003;44:855–861. [PubMed] [Google Scholar]
- 28.Zoghbi SS, Shetty HU, Ichise M, et al. PET Imaging of the Dopamine Transporter with 18F-FECNT: A Polar Radiometabolite Confounds Brain Radioligand Measurements. J Nucl Med. 2006;47:520–527. [PubMed] [Google Scholar]
- 29.Laruelle M, Abi-Dargham A, al-Tikriti MS, et al. SPECT quantification of [123I]iomazenil binding to benzodiazepine receptors in nonhuman primates: II. Equilibrium analysis of constant infusion experiments and correlation with in vitro parameters. J Cereb Blood Flow Metab. 1994;14:453–465. doi: 10.1038/jcbfm.1994.56. [DOI] [PubMed] [Google Scholar]
- 30.Thanos PK, Taintor NB, Alexoff D, et al. In vivo comparative imaging of dopamine D2 knockout and wild-type mice with 11C-raclopride and microPET. J Nucl Med. 2002;43:1570–1577. [PubMed] [Google Scholar]
- 31.Alexoff DL, Vaska P, Marsteller D, et al. Reproducibility of 11C-raclopride binding in the rat brain measured with the microPET R4: Effects of scatter correction and tracer specific activity. J Nucl Med. 2003;44:815–822. [PubMed] [Google Scholar]
- 32.Matej S, Karp JS, Lewitt RM, et al. Performance of the Fourier rebinning algorithm for PET with large acceptance angles. Phys Med Biol. 1998;43:787–795. doi: 10.1088/0031-9155/43/4/008. [DOI] [PubMed] [Google Scholar]
- 33.Paxinos G, Watson C. The Rat Brain in Stereotaxic Coordinates. 4. New York: Academic Press; 1998. [Google Scholar]
- 34.Lammertsma AA, Bench CJ, Hume SP, et al. Comparison of methods for analysis of clinical [11C]raclopride studies. J Cereb Blood Flow Metab. 1996;16:42–52. doi: 10.1097/00004647-199601000-00005. [DOI] [PubMed] [Google Scholar]
- 35.Lassen NA. Neuroreceptor quantitation in vivo by the steady-state principle using constant infusion or bolus injection of radioactive tracers. J Cereb Blood Flow Metab. 1992;12:709–716. doi: 10.1038/jcbfm.1992.101. [DOI] [PubMed] [Google Scholar]
- 36.Ye W, Shimamura K, Rubenstein JL, et al. FGF and Shh signals control dopaminergic and serotonergic cell fate in the anterior neural plate. Cell. 1998;93:755–766. doi: 10.1016/s0092-8674(00)81437-3. [DOI] [PubMed] [Google Scholar]
- 37.Simon HH, Saueressig H, Wurst W, et al. Fate of midbrain dopaminergic neurons controlled by the engrailed genes. J Neurosci. 2001;21:3126–3134. doi: 10.1523/JNEUROSCI.21-09-03126.2001. [DOI] [PMC free article] [PubMed] [Google Scholar]
- 38.Smidt MP, Asbreuk CH, Cox JJ, et al. A second independent pathway for development of mesencephalic dopaminergic neurons requires Lmx1b. Nat Neurosci. 2000;3:337–341. doi: 10.1038/73902. [DOI] [PubMed] [Google Scholar]
- 39.Ruiz i Altaba A, Prezioso VR, Darnell JE, et al. Sequential expression of HNF-3 beta and HNF-3 alpha by embryonic organizing centers: the dorsal lip/node, notochord and floor plate. Mech Dev. 1993;44:91–108. doi: 10.1016/0925-4773(93)90060-b. [DOI] [PubMed] [Google Scholar]
- 40.Andersson E, Tryggvason U, Deng Q, et al. Identification of intrinsic determinants of midbrain dopamine neurons. Cell. 2006;124:393–405. doi: 10.1016/j.cell.2005.10.037. [DOI] [PubMed] [Google Scholar]
- 41.Wolfrum C, Besser D, Luca E, et al. Insulin regulates the activity of forkhead transcription factor Hnf-3beta/Foxa-2 by Akt-mediated phosphorylation and nuclear/cytosolic localization. Proc Natl Acad Sci U S A. 2003;100:11624–11629. doi: 10.1073/pnas.1931483100. [DOI] [PMC free article] [PubMed] [Google Scholar]
- 42.Smidt MP, van Schaick HS, Lanctot C, et al. A homeodomain gene Ptx3 has highly restricted brain expression in mesencephalic dopaminergic neurons. Proc Natl Acad Sci U S A. 1997;94:13305–13310. doi: 10.1073/pnas.94.24.13305. [DOI] [PMC free article] [PubMed] [Google Scholar]
- 43.Gerfen CR, Herkenham M, Thibault J. The neostriatal mosaic: II. Patch-and matrix-directed mesostriatal dopaminergic and non-dopaminergic systems. J Neurosci. 1987;7:3915–3934. doi: 10.1523/JNEUROSCI.07-12-03915.1987. [DOI] [PMC free article] [PubMed] [Google Scholar]
- 44.McCaffery P, Drager UC. High levels of a retinoic acid-generating dehydrogenase in the meso-telencephalic dopamine system. Proc Natl Acad Sci U S A. 1994;91:7772–7776. doi: 10.1073/pnas.91.16.7772. [DOI] [PMC free article] [PubMed] [Google Scholar]
- 45.Chung S, Hedlund E, Hwang M, et al. The homeodomain transcription factor Pitx3 facilitates differentiation of mouse embryonic stem cells into AHD2-expressing dopaminergic neurons. Mol Cell Neurosci. 2005;28:241–252. doi: 10.1016/j.mcn.2004.09.008. [DOI] [PubMed] [Google Scholar]
- 46.Amara SG, Kuhar MJ. Neurotransmitter transporters: Recent progress. Annu Rev Neurosci. 1993;16:73–93. doi: 10.1146/annurev.ne.16.030193.000445. [DOI] [PubMed] [Google Scholar]
- 47.Giros B, Caron MG. Molecular characterization of the dopamine transporter. Trends Pharmacol Sci. 1993;14:43–49. doi: 10.1016/0165-6147(93)90029-j. [DOI] [PubMed] [Google Scholar]
- 48.Jellinger KA. The pathology of Parkinson’s disease. Adv Neurol. 2001;86:55–72. [PubMed] [Google Scholar]
- 49.Takeuchi Y, Sawada T, Blunt S, et al. Serotonergic sprouting in the neostriatum after intrastriatal transplantation of fetal ventral mesencephalon. Brain Res. 1991;551:171–177. doi: 10.1016/0006-8993(91)90930-t. [DOI] [PubMed] [Google Scholar]
- 50.Wright AK, Arbuthnott GW, Dunnett SB. Serotonin hyperinnervation after foetal nigra or raphe transplantation in the neostriatum of adult rats. Neurosci Lett. 1991;128:281–284. doi: 10.1016/0304-3940(91)90280-7. [DOI] [PubMed] [Google Scholar]
- 51.Khoshbouei H, Sen N, Guptaroy B, et al. N-terminal phosphorylation of the dopamine transporter is required for amphetamine-induced efflux. PLoS Biol. 2004;2:E78. doi: 10.1371/journal.pbio.0020078. [DOI] [PMC free article] [PubMed] [Google Scholar]
- 52.Zetterstrom T, Sharp T, Collin AK, et al. In vivo measurement of extracellular dopamine and DOPAC in rat striatum after various dopamine-releasing drugs; implications for the origin of extracellular DOPAC. Eur J Pharmacol. 1988;148:327–334. doi: 10.1016/0014-2999(88)90110-0. [DOI] [PubMed] [Google Scholar]
- 53.Brooks DJ, Frey KA, Marek KL, et al. Assessment of neuroimaging techniques as biomarkers of the progression of Parkinson’s disease. Exp Neurol. 2003;184 (suppl 1):S68–S79. doi: 10.1016/j.expneurol.2003.08.008. [DOI] [PubMed] [Google Scholar]
- 54.Piccini P, Whone A. Functional brain imaging in the differential diagnosis of Parkinson’s disease. Lancet Neurol. 2004;3:284–290. doi: 10.1016/S1474-4422(04)00736-7. [DOI] [PubMed] [Google Scholar]
- 55.Piccini P, Brooks DJ, Bjorklund A, et al. Dopamine release from nigral transplants visualized in vivo in a Parkinson’s patient. Nat Neurosci. 1999;2:1137–1140. doi: 10.1038/16060. [DOI] [PubMed] [Google Scholar]
- 56.Nakamura T, Dhawan V, Chaly T, et al. Blinded positron emission tomography study of dopamine cell implantation for Parkinson’s disease. Ann Neurol. 2001;50:181–187. doi: 10.1002/ana.1075. [DOI] [PubMed] [Google Scholar]
- 57.Bjorklund A, Dunnett SB, Brundin P, et al. Neural transplantation for the treatment of Parkinson’s disease. Lancet Neurol. 2003;2:437–445. doi: 10.1016/s1474-4422(03)00442-3. [DOI] [PubMed] [Google Scholar]
- 58.Hume SP, Opacka-Juffry J, Myers R, et al. Effect of L-dopa and 6-hydroxydopamine lesioning on [11C]raclopride binding in rat striatum, quantified using PET. Synapse. 1995;21:45–53. doi: 10.1002/syn.890210107. [DOI] [PubMed] [Google Scholar]
- 59.Farooqui SM. Induction of adenylate cyclase sensitive dopamine D2-receptors in retinoic acid induced differentiated human neuroblastoma SHSY-5Y cells. Life Sci. 1994;55:1887–1893. doi: 10.1016/0024-3205(94)00520-6. [DOI] [PubMed] [Google Scholar]
- 60.Samad TA, Krezel W, Chambon P, et al. Regulation of dopaminergic pathways by retinoids: activation of the D2 receptor promoter by members of the retinoic acid receptor-retinoid X receptor family. Proc Natl Acad Sci U S A. 1997;94:14349–14354. doi: 10.1073/pnas.94.26.14349. [DOI] [PMC free article] [PubMed] [Google Scholar]
- 61.Valdenaire O, Maus-Moatti M, Vincent JD, et al. Retinoic acid regulates the developmental expression of dopamine D2 receptor in rat striatal primary cultures. J Neurochem. 1998;71:929–936. doi: 10.1046/j.1471-4159.1998.71030929.x. [DOI] [PubMed] [Google Scholar]
- 62.Krezel W, Ghyselinck N, Samad TA, et al. Impaired locomotion and dopamine signaling in retinoid receptor mutant mice. Science. 1998;279:863–867. doi: 10.1126/science.279.5352.863. [DOI] [PubMed] [Google Scholar]
- 63.Dunnett SB, Hernandez TD, Summerfield A, et al. Graft-derived recovery from 6-OHDA lesions: Specificity of ventral mesencephalic graft tissues. Exp Brain Res. 1988;71:411–424. doi: 10.1007/BF00247501. [DOI] [PubMed] [Google Scholar]
- 64.Zetterstrom T, Brundin P, Gage FH, et al. In vivo measurement of spontaneous release and metabolism of dopamine from intrastriatal nigral grafts using intracerebral dialysis. Brain Res. 1986;362:344–349. doi: 10.1016/0006-8993(86)90460-9. [DOI] [PubMed] [Google Scholar]
- 65.Strecker RE, Sharp T, Brundin P, et al. Autoregulation of dopamine release and metabolism by intrastriatal nigral grafts as revealed by intracerebral dialysis. Neuroscience. 1987;22:169–178. doi: 10.1016/0306-4522(87)90207-7. [DOI] [PubMed] [Google Scholar]
- 66.Rioux L, Gaudin DP, Bui LK, et al. Correlation of functional recovery after a 6-hydroxydopamine lesion with survival of grafted fetal neurons and release of dopamine in the striatum of the rat. Neuroscience. 1991;40:123–131. doi: 10.1016/0306-4522(91)90179-r. [DOI] [PubMed] [Google Scholar]
- 67.Gnegy ME, Khoshbouei H, Berg KA, et al. Intracellular Ca2+ regulates amphetamine-induced dopamine efflux and currents mediated by the human dopamine transporter. Mol Pharmacol. 2004;66:137–143. doi: 10.1124/mol.66.1.137. [DOI] [PubMed] [Google Scholar]
- 68.Inaji M, Yoshizaki T, Okauchi T, et al. In vivo PET measurements with [11C]PE2I to evaluate fetal mesencephalic transplantations to unilateral 6-OHDA-lesioned rats. Cell Transplant. 2005;14:655–663. doi: 10.3727/000000005783982684. [DOI] [PubMed] [Google Scholar]
- 69.Freed WJ, Ko GN, Niehoff DL, et al. Normalization of spiroperidol binding in the denervated rat striatum by homologous grafts of substantia nigra. Science. 1983;222:937–939. doi: 10.1126/science.6635666. [DOI] [PubMed] [Google Scholar]
- 70.Dawson TM, Dawson VL, Gage FH, et al. Functional recovery of supersensitive dopamine receptors after intrastriatal grafts of fetal substantia nigra. Exp Neurol. 1991;111:282–292. doi: 10.1016/0014-4886(91)90095-t. [DOI] [PubMed] [Google Scholar]
- 71.Rioux L, Gaudin DP, Gagnon C, et al. Decrease of behavioral and biochemical denervation supersensitivity of rat striatum by nigral transplants. Neuroscience. 1991;44:75–83. doi: 10.1016/0306-4522(91)90251-i. [DOI] [PubMed] [Google Scholar]
- 72.Kalen P, Nilsson OG, Cenci MA, et al. Intracerebral microdialysis as a tool to monitor transmitter release from grafted cholinergic and monoaminergic neurons. J Neurosci Methods. 1990;34:107–115. doi: 10.1016/0165-0270(90)90048-k. [DOI] [PubMed] [Google Scholar]
- 73.Wang Y, Wang SD, Lin SZ, et al. Restoration of dopamine overflow and clearance from the 6-hydroxydopamine lesioned rat striatum reinnervated by fetal mesencephalic grafts. J Pharmacol Exp Ther. 1994;270:814–821. [PubMed] [Google Scholar]
- 74.Stromberg I, van Horne C, Bygdeman M, et al. Function of intraventricular human mesencephalic xenografts in immunosuppressed rats: An electrophysiological and neurochemical analysis. Exp Neurol. 1991;112:140–152. doi: 10.1016/0014-4886(91)90064-j. [DOI] [PubMed] [Google Scholar]
- 75.Cragg SJ, Clarke DJ, Greenfield SA. Real-time dynamics of dopamine released from neuronal transplants in experimental Parkinson’s disease. Exp Neurol. 2000;164:145–153. doi: 10.1006/exnr.2000.7420. [DOI] [PubMed] [Google Scholar]
- 76.Stromberg I, Kehr J, Andbjer B, et al. Fetal ventral mesencephalic grafts functionally reduce the dopamine D2 receptor supersensitivity in partially dopamine reinnervated host striatum. Exp Neurol. 2000;164:154–165. doi: 10.1006/exnr.2000.7421. [DOI] [PubMed] [Google Scholar]
- 77.Day M, Wang Z, Ding J, et al. Selective elimination of glutamatergic synapses on striatopallidal neurons in Parkinson disease models. Nat Neurosci. 2006;9:251–259. doi: 10.1038/nn1632. [DOI] [PubMed] [Google Scholar]