Abstract
An imbalance in tryptophan (TRP) metabolites is associated with several neurological and inflammatory disorders. Therefore, analytical methods allowing for simultaneous quantification of TRP and its major metabolites would be highly desirable, and may be valuable as potential biomarkers. We have developed a HPLC method for concurrent quantitative determination of tryptophan, serotonin, 5-hydroxyindoleacetic acid, kynurenine, and kynurenic acid in tissue and fluids. The method utilizes the intrinsic spectroscopic properties of TRP and its metabolites that enable UV absorbance and fluorescence detection by HPLC, without additional labeling. The origin of the peaks related to analytes of interest was confirmed by UV–Vis spectral patterns using a PDA detector and mass spectrometry. The developed methods were validated in rabbit fetal brain and amniotic fluid at gestational day 29. Results are in excellent agreement with those reported in the literature for the same regions. This method allows for rapid quantification of tryptophan and four of its major metabolites concurrently. A change in the relative ratios of these metabolites can provide important insights in predicting the presence and progression of neuroinflammation in disorders such as cerebral palsy, autism, multiple sclerosis, Alzheimer disease, and schizophrenia.
Keywords: Kynurenine pathway, Serotonin, Kynurenic acid, Tryptophan metabolites, HPLC
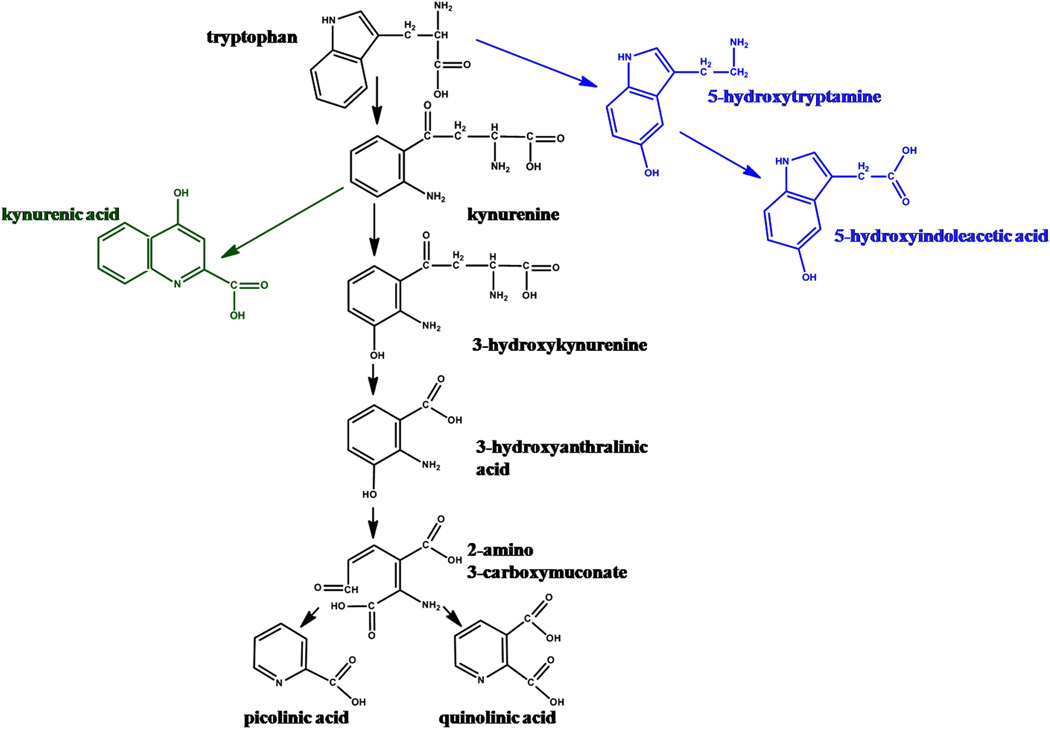
Tryptophan (TRP)1 is an essential amino acid necessary for protein biosynthesis and is also a precursor for metabolites such as serotonin, melatonin, and kynurenine. It is metabolized via several pathways, the major ones being the kynurenine and serotonin pathways (Scheme 1). A relative imbalance in TRP metabolites can cause neuronal damage and impairment of multiple behavioral, physiological, and neurological functions [1–3]. Serotonin is an important neurotransmitter, modulating numerous behavioral and physiological functions such as sleep, mood, appetite, learning, and memory [4]. Recent study has demonstrated decreased levels of cortical serotonin in neonatal rabbits with cerebral palsy induced by maternal-fetal inflammation [5]. 5-Hydroxyindoleacetic acid, the immediate metabolite of serotonin, is used as a biomarker in the diagnosis of malignant carcinoid, phenylketonuria, and migraine [6]. However, tryptophan is mainly metabolized via the kynurenine pathway (KP) by a cascade of enzymatic reactions involving the creation of multiple neuroactive species (Scheme 1). The KP is composed of two branches, leading to the formation of (1) kynurenic acid (KYNA) and (2) picolinic and quinolinic acids. Kynurenic acid is an N-methyl-D-aspartate receptor antagonist and is considered to be neuroprotective [2]. Higher concentrations of KYNA were found in the cerebrospinal fluid of patients with schizophrenia compared to age-matched healthy patients [2,7]. There is also evidence that elevated concentrations of KYNA can disrupt the learning and cognitive abilities in Alzheimer disease and result in impaired synaptogenesis when elevated in the developing brain [8,9]. Other kynurenine metabolites, including 3-hydroxykynurenine and quinolinic acid, are considered to be neurotoxic [1].
Scheme 1.
Schematic depiction of the major tryptophan metabolic pathways.
To date, a number of methods for analysis of TRP and its metabolites have been developed, mostly based on liquid or gas chromatography with various detection modalities, such as mass spectrometry, UV absorbance, and fluorescent, electrochemical, and evaporative light scattering [10–21]. Analysis by LC–MS or GC–MS involves synthesis of deuterated standards, somewhat complicated sample preparation procedures, and relatively sophisticated equipment. However, multiple species can be analyzed with high sensitivity at the femtomolar level, which is very useful when a small amount of sample is available, such as samples of cerebral spinal fluid or from neonatal and pediatric patients [13].
The goal of this study was to develop a simple and rapid HPLC method for the concurrent detection and quantification of tryptophan and its major metabolites, serotonin, 5-hydroxyindoleacetic acid, kynurenine, and kynurenic acid. The developed method was assessed for accuracy, linearity, limit of detection, and reproducibility. Feasibility of using this method was demonstrated in tissue obtained from rabbit fetal brains (gestation day 29) and amniotic fluid. In comparison with other published methods, the present method has the advantage of simultaneous detection and robust quantification of TRP and four of its metabolites using rather simple sample preparation and HPLC setup equipped with two pumps and photodiode array (PDA) and fluorescence detectors for quantification of analytes in tissue and body fluids. However, the HPLC system can be simplified to the use of one pump and one detector, since isocratic elution was used and the results obtained based on absorbance and fluorescence are in good agreement. Run time and elution conditions can be adjusted according to the analytes of interest.
Materials and methods
Materials and reagents
TRP, serotonin (5-HT), 5-hydroxyindoleacetic acid (5-HIAA), kynurenine (KYN), KYNA, acetonitrile (ACN), trifluoroacetic acid (TFA), acetic acid (AA), and chloroform were purchased from Sigma-Aldrich. TSK-Gel ODS-80 Ts (250 × 4.6 mm i.d., 5 µm) and TSK gel guard column were bought from Tosoh Bioscience LLC. Purified water with resistivity of 18.2 M (symbol) cm−1 obtained using a Branstead Nanopure Diamond Lab water purification system was used in all the experiments. All other reagents and HPLC solvents were used as received without further purification.
Preparation of brain and amniotic fluid samples
All procedures were approved by the institutional animal care and use committee. New Zealand White rabbits with timed pregnancies (Charles River Laboratories International, Wilmington, MA, USA) were used. Amniotic fluid and fetal brains were collected on gestation day 29. Samples were snap-frozen on dry ice and stored at −80 °C for quantification study.
Brain tissue
For brain sample preparation, the periventricular region (PVR) was microdissected and ~200 mg tissue was homogenized in 1 ml of deionized water. Resulting suspensions were extensively vortexed and centrifuged at 21,130g (15,000 rpm) for 10 min using a 5424 R Eppendorf centrifuge (Eppendorf, Hauppauge, NY, USA). Then, 1 ml of the supernatant was collected and vortexed with 3 ml of chloroform to extract fatty acids and lipids. Obtained mixtures were then centrifuged at 3007g (4000 rpm) for 10 min using a Thermo Electron CR3i multifunction centrifuge (Thermo Fisher Scientific, Pittsburgh, PA, USA). The aqueous fraction (0.8 ml) was mixed with acetonitrile (3 ml) for protein precipitation. Resulting samples were left in ice for 30 min for protein coagulation, followed by centrifugation at 3007g (4000 rpm) for 10 min at 4 °C. The supernatant was divided into three aliquots of 1.2 ml each and lyophilized. For HPLC analysis, residues were dissolved in 1 ml of the mobile phase (0.14% TFA in H2O:ACN 90:10 v/v) and three injections of 200 µl for each sample were performed. Samples were obtained from six fetuses and amniotic sacs that were from three different mothers for analysis.
Amniotic fluid
For each sample 250 µl of amniotic fluid was collected and centrifuged at 21,130g (15,000 rpm) for 10 min using a 5424 R Eppendorf centrifuge. Two hundred microliters of the supernatant was mixed with 800 µl of deionized water, followed by vortexing and sonication, and the same procedure described for brain was applied.
HPLC analysis
All processed samples were analyzed using a Waters 1525 binary HPLC separation module (Waters Corp., Milford, MA, USA), equipped with an in-line degasser AF, a 717 Plus autosampler (kept at 4 °C), a 2998 PDA detector, and a 2475 multiwavelength fluorescence detector, controlled by Empower software. Isocratic separations were run on TSK-Gel ODS-80 Ts (250 × 4.6 mm i.d., 5 µm) and TSK-Gel guard columns with 0.1% TFA in H2O:ACN (90:10 v/v) and 0.1% AA in H2O:ACN (90:10 v/v) at a flow rate of 0.8 and 0.6 ml/min, respectively. Triplicate injections of 200 µl for each biological sample were performed. Elution was simultaneously monitored by a PDA detector (collecting UV–Vis spectra from 190 to 800 nm, which can provide chromatograms at the desired wavelength in this range) as well as a fluorescence detector having three channels set as follows: channel 1—excitation at 297 nm and emission at 344 nm for detection of TRP, 5-HT, and 5-HIAA; channel 2—excitation at 330 nm and emission at 390 nm for detection of KYNA; channel 3—excitation at 364 nm and emission at 480 nm for detection of KYN. The calibration curves and the limits of detection (LOD) for each analyte were obtained by injecting various amounts of the studied metabolites (ranging from 1 pg to 1 µg) into the HPLC and used as reference calibration curves for their quantification in the brain tissue (PVR) and amniotic fluid samples obtained from rabbit fetus (gestation day 29).
UV–Vis spectroscopy
UV–Vis spectra of TRP, 5-HT, 5-HIAA, KYN, and KYNA were recorded in water:acetonitrile (90:10 v/v) and 0.14% TFA at a concentration of 1 µg/ml using a Cary 50 Bio UV–visible light spectrophotometer (Varian, Palo Alto, CA, USA).
Fluorescence spectroscopy
Fluorescence spectra of all analytes were recorded in a solution of water:acetonitrile (90:10 v/v) and 0.14% TFA at a concentration of 1 µg/ml, using a Shimadzu RF-5301 spectrofluorimeter (Shimadzu, Columbia, MD, USA).
Mass spectrometry
MS/MS spectra for each metabolite of interest were collected using an API5000 triple-quadrupole mass spectrometer (AB Sciex, Framingham, MA, USA). Stock solutions of TRP, 5-HT, 5-HIAA, KYN, and KYNA at a concentration of 0.5 µg/ml in mobile phase (H2O:ACN 50:50 v/v, 0.1% acetic acid) were used to optimize the detection condition for each analyte. The conditions for each analyte were determined individually and are shown in Table 1. Two fragments were selected for each analyte, a primary and a confirmatory peak. These fragments were confirmed by determining the precursor ion of each peak. ChemDraw (PerkinElmer, Cambridge, MA, USA) was used to determine the structure of the resultant fragments. The optimized method for each analyte was used in all subsequent analyses.
Table 1.
Conditions for mass spectroscopy analysis of TRP metabolites.
| Parameter | Compound |
||||
|---|---|---|---|---|---|
| TRP | KYN | KYNA | 5-HIAA | 5-HT | |
| Polarity | Positive | Positive | Positive | Positive | Positive |
| Mass (Da) | 205.1 | 209.2 | 190.2 | 192.1 | 177.2 |
| Declustering potential | 36 | 61 | 31 | 41 | 51 |
| Collision energy | 11 | 33 | 25 | 25 | 39 |
| Collision exit potential | 12 | 18 | 16 | 12 | 16 |
Once all fragmentation patterns and optimizations were performed for all five analytes, the impact of the brain tissue homogenate (prepared as described above) matrix was investigated. To confirm the assignment of the HPLC chromatograms, fractions were analyzed using this MS/MS method. To accomplish this, HPLC fractions corresponding to the peak for each analyte were collected and then evaporated, reconstituted in mobile phase, and analyzed using the previously optimized methods.
Statistical analysis
Results were analyzed with mean standard deviation value and evaluated statistically by the Student t test. All calculations were performed using Microsoft Excel software. Significance was determined as p < 0.05.
Results and discussion
Method development
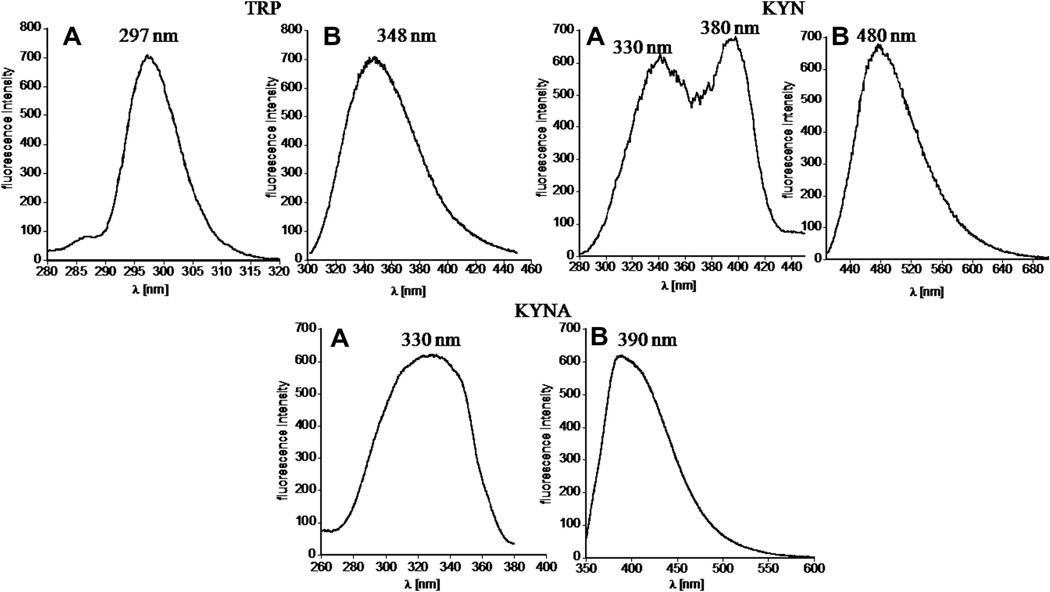
The chromatographic system consisted of two solvent delivery pumps, an autosampler, and PDA and multiwavelength fluorescence detectors. Elution was monitored by both detectors simultaneously. The spectroscopic properties of TRP, 5-HT, 5-HIAA, KYN, and KYNA for quantification by the above-described HPLC system were evaluated, and the UV–visible and florescence spectra were acquired using 0.1% TFA aqueous solution containing acetonitrile (ranging from 0 to 30% v/v) at a concentration of 1 µg/ml. TRP and its metabolites demonstrate intrinsic fluorescence and strong UV absorbance with high extinction coefficient values. The representative spectra of TRP, KYN, and KYNA are shown in Figs. 1 and 2. The summary of spectroscopic results is shown in Table 2. The analyzed compounds demonstrate three discrete absorbance maxima in the ultraviolet range (Fig. 1 and Supplementary Fig. 1S). As expected, TRP, 5-HT, and 5-HIAA, having indole-like moieties, exhibit UV–Vis spectra with maxima of absorbance at the same wavelength. Additionally, they can be excited between 290 and 320 nm, with emission from 300 to 400 nm. Therefore, if appropriately separated by HPLC, absorbance at 220 or 280 nm could be used for their concurrent detection. KYN and KYNA have different structures and exhibit quite distinct fluorescence properties, but partially overlapping UV pattern with absorbance maxima in the long ultraviolet range, 36 nm apart. KYN can be excited in the range of 300–400 nm (exhibiting two distinct maxima at 330 and 380 nm) with maximum of emission at 480 nm. The excitation and emission maxima for KYNA were observed at 330 and 390 nm, respectively. Spectroscopic patterns of all analytes are in good agreement with previous literature [22–24].
Fig. 1.
UV–Vis spectra of tryptophan, kynurenine, and kynurenic acid showing high extinction coefficient values of their characteristic peaks. 5-HT and 5-HIAA exhibit UV–Vis patterns similar to that of TRP (see Supplementary material).
Fig. 2.
Fluorescence spectra of tryptophan, kynurenine, and kynurenic acid indicating that they exhibit intrinsic fluorescence. Spectra (A) represent excitation and (B) represent emission values of respective metabolites. 5-HT and 5-HIAA possess fluorescence properties like TRP (data not shown).
Table 2.
Spectroscopic and chromatographic properties of tryptophan and its major metabolites.
| Analyte | λmax of ex (nm) | λmax of em (nm) | λmax of abs (nm) | Extinction coefficient (dm3 mol−1 cm−1) | LOD (mol) | S/N | RT (min) |
|---|---|---|---|---|---|---|---|
| TRP | 297 | 348 | 220 | 2.94 × 10⁴ | 5.36 × 10⁻¹² | 2.19 | 30.8 |
| 280 | 7.82 × 10³ | 4.89 × 10⁻¹⁴ | 2.13 | ||||
| 300sh | 6.45 × 10³ | ||||||
| 5-HT | 297 | 348 | 220 | 3.25 × 10⁴ | 5.84 × 10⁻¹² | 2.55 | 7.91 |
| 280 | 5.51 × 10³ | 1.13 × 10⁻¹³ | 2.06 | ||||
| 300sh | 4.68 × 10³ | ||||||
| 5-HIAA | 297 | 348 | 220 | 2.65 × 10⁴ | 6.64 × 10⁻¹² | 2.45 | 17.6 |
| 280 | 6.36 × 10³ | 8.25 × 10⁻¹⁴(fl) | 2.15 | ||||
| 300sh | 5.46 × 10³ | ||||||
| KYN | 364 | 480 | 226 | 2.44 × 10⁴ | 4.8 × 10⁻¹² | 2.17 | 12.1 |
| 254 | 9.5 × 10³ | 1.20 × 10⁻¹² | 2.05 | ||||
| 364 | 5.05 × 10³ | ||||||
| KYNA | 330 | 390 | 216 | 2.95 × 10⁴ | 3.28 × 10⁻¹² | 2.14 | 21.6 |
| 242 | 3.92 × 10⁴ | 1.13 × 10⁻¹³ | 2.18 | ||||
| 330 | 6.79 × 10³ | 2.24 |
TRP, tryptophan; 5-HT, serotonin; 5-HIAA, 5-hydroxyindoleacetic acid; KYN, kynurenine; KYNA, kynurenic acid; λmax of ex, wavelength of excitation maximum; λmax of em, wavelength of emission maximum; λmax of abs, wavelength of absorbance maximum; sh, shoulder; fl, by fluorescence; LOD, limit of detection represented in number of moles injected on the column observed for absorbance used for quantification of given analyte (top values) and fluorescence; S/N, signal-to-noise ratio; RT, retention time.
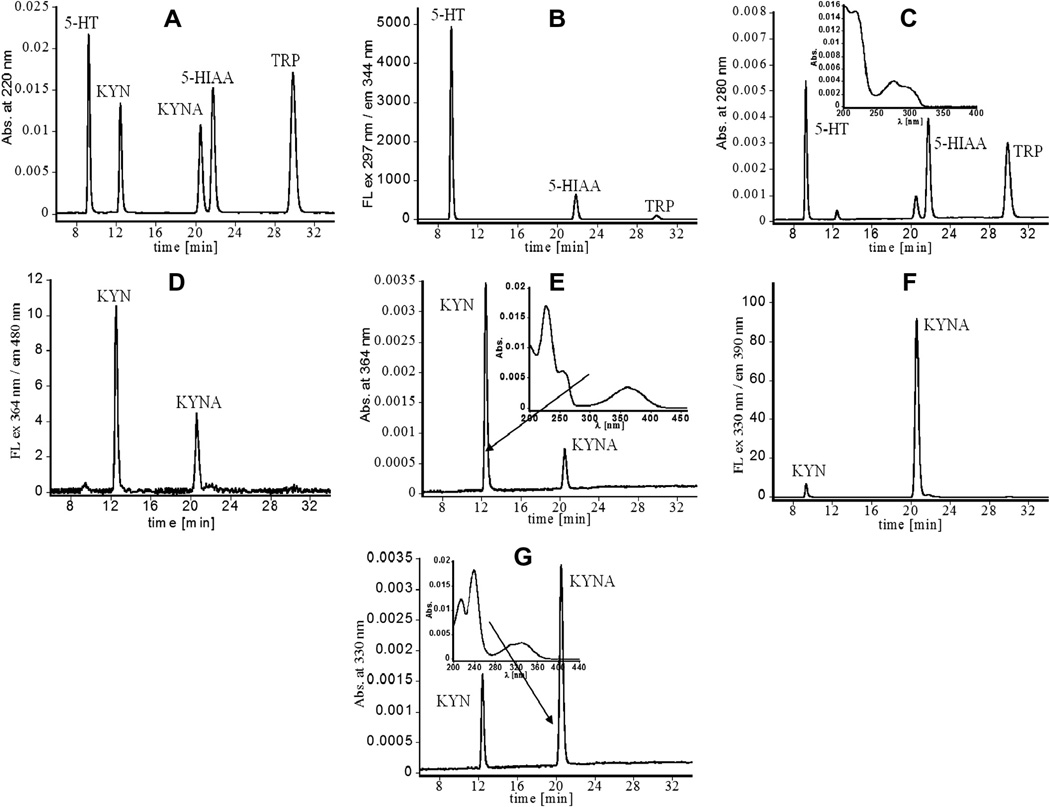
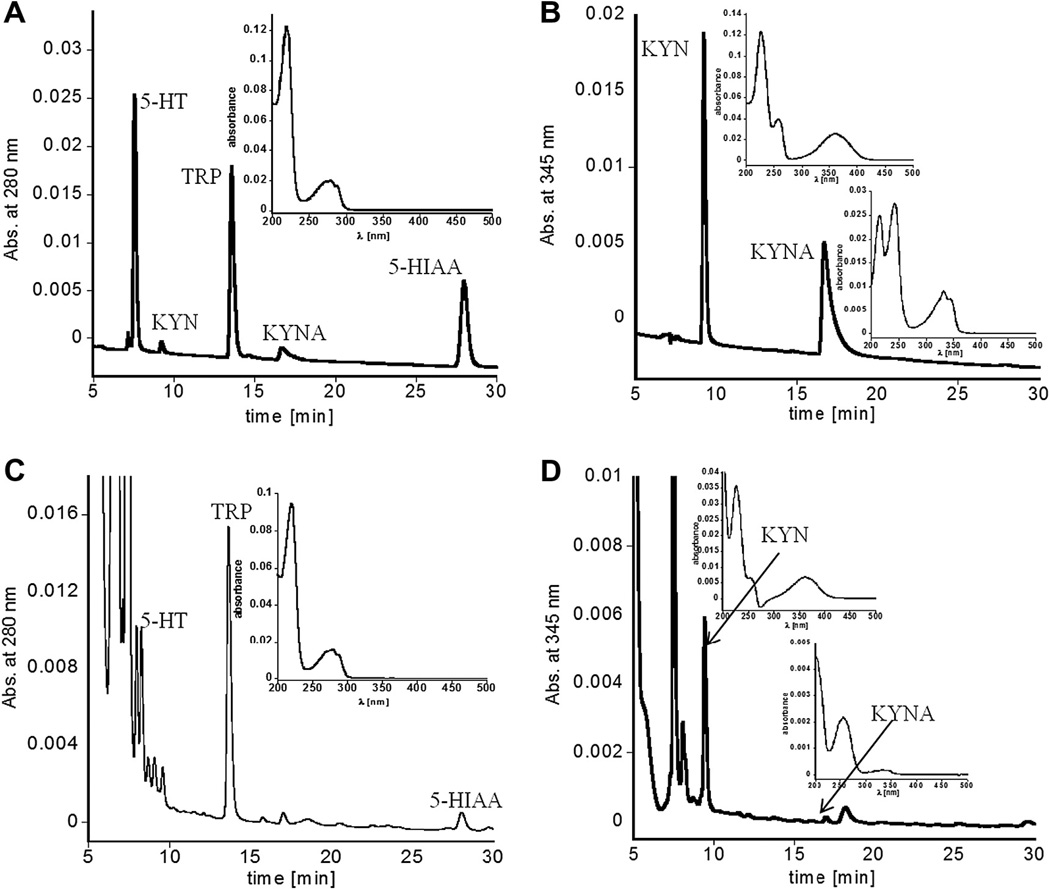
The spectroscopic properties of TRP and its main metabolites allowed for the development of a robust HPLC method for their quantification based on dual UV absorbance and fluorescence detection. To optimize conditions for the HPLC separation of tryptophan and its major metabolites, a standard mixture containing TRP, 5-HT, 5-HIAA, KYN, and KYNA at aconcentration of 1 µg/ml each was analyzed. The injection volume of 100 µl (0.1 µg of each analyte injected onto the column), with a mobile phase composed of varying ratios of H2O:ACN (ranging from 0 to 30% v/v) with 0.1% TFA and varying flow rate, was tested. Appreciable baseline separation of all analytes and relatively short retention times were achieved with the mobile phase 0.1% TFA in H2O:ACN 90:10 v/v and the isocratic flow rate of 0.8 ml/min at room temperature (Fig. 3 and Supplementary Fig. 1S). UV–Vis spectra of all analytes collected using a spectrophotometer and PDA detector are in good agreement, indicating appropriate peak assignment. Chromatographic analysis of the standard mixture was completed within 35 min. Increased content of acetonitrile in mobile phase resulted in decreased resolution and partial separation of KYN and 5-HT as well as KYNA and 5-HIAA (data not shown), which increased the probability of coelution of analyzed compounds with other endogenous species. Spectroscopic and chromatographic properties of TRP and its studied metabolites obtained using 0.1% TFA in H2O:ACN (90:10 v/v) as solvent and mobile phase are shown in Table 2. The analytes can be simultaneously detected using absorbance at 220 nm (Fig. 3A), since they absorb light with similar intensity at this wavelength. KYN and KYNA do not strongly absorb at 280 nm and their peaks in the chromatogram at this wavelength significantly decrease (Fig. 3B). However, TRP, 5-HT, and 5-HIAA still exhibit relatively strong signals and absorbance at 280 nm was selected for their quantification because the baseline at this wavelength is more stable compared to 220 nm and provided satisfactory sensitivity. Additionally, they can be seen in the fluorescence chromatogram with the highest intensity for 5-HT (Fig. 3C). TRP, 5-HT, and 5-HIAA cannot be detected under conditions optimized for KYN and KYNA, even though they are present in the sample (Figs. 3D – G). As demonstrated in these chromatograms, using conditions optimized for kynurenine, its peaks dominate over signals related to KYNA. On the other hand, applying the KYNA-specific detection, the peaks related to KYN significantly diminish. Further, each analyte was used as an external standard to acquire the calibration curves, showing excellent linearity (n = 3, R2 = 0.999) across a wide concentration range (including physiological levels). Results obtained for each analyte were then used to build a library for peak matching and peak purity function. This enabled the assessment of the limit of detection, which reached relatively low values for both UV absorbance and fluorescence (Table 2). The calibration curves were constructed based on peak areas.
Fig. 3.
HPLC chromatograms obtained for standard mixture containing TRP, 5-HT, 5-HIAA, KYN, and KYNA at concentration of 1 µg/ml. The injection volume was 100 µl. (A) Chromatogram acquired with absorbance at 220 nm. (B) Chromatogram obtained using excitation at 297 nm and emission at 344 nm. (C) Chromatogram recorded with absorbance at 280 nm and UV-Vis pattern recorded under peaks related to 5-HT, 5-HIAA and TRP. (D) Chromatogram observed with excitation at 364 nm and emission at 480 nm. (E) Chromatogram registered with absorbance at 364 nm and UV-Vis spectrum observed within signal related to KYN. (F) Chromatogram acquired with excitation at 330 nm and emission at 390 nm. (G) Chromatogram derived with absorbance at 330 nm and UV-Vis spectrum registered for KYNA.
To test the reproducibility of the method, a standard solution containing all analyzed compounds at concentrations of 1 µg/ml was aliquotted into 30 samples, which were stored at −20°C. Intra- and interday variations were evaluated by measuring these aliquots on 10 consecutive days, using 3 freshly thawed samples every day. Each sample was analyzed in triplicate. No statistically significant differences (p > 0.05) for daily and day-to-day analysis in terms of peak areas were observed and retention times for 5-HT, KYN, 5-HIAA, KYNA, and TRP were 7.91, 12.1, 17.6, 21.6, and 30.8, respectively.
Analysis of biological specimens
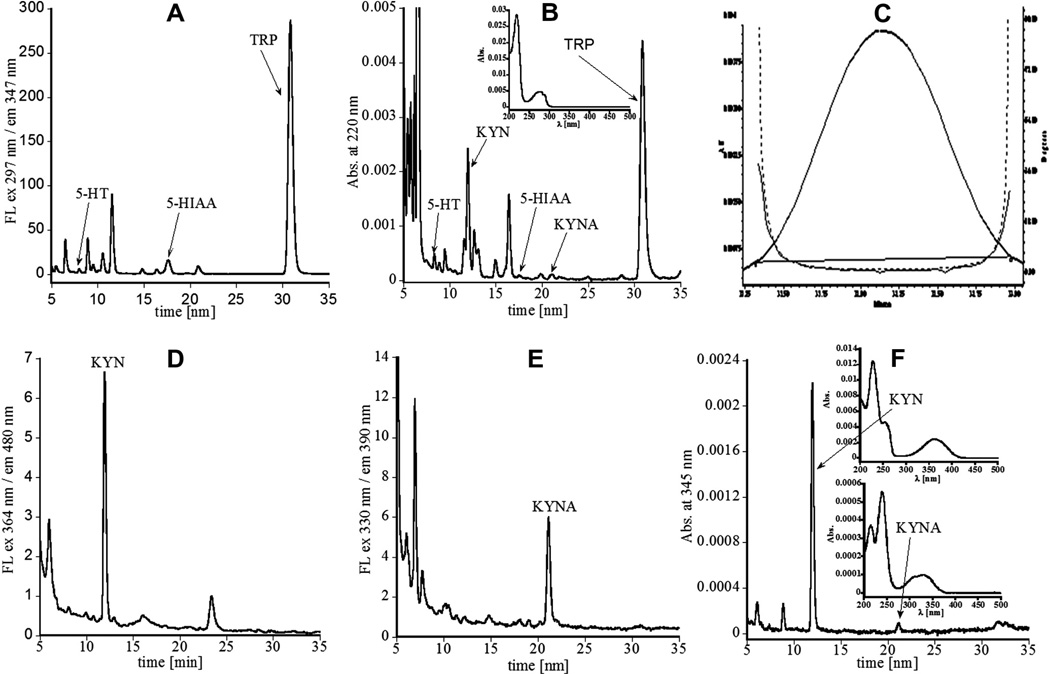
The developed method was validated by analyzing the PVR of the fetal brain and amniotic fluid samples obtained from pregnant rabbits at gestation day 29 (Table 3). We selected three mothers, and samples were collected from two littermates from each mother to test variations between littermates and nonlittermates. In total, six samples for PVR and amniotic fluid were collected, which were analyzed in triplicate, using both UV absorbance and fluorescence. To evaluate the procedure for sample preparation and external calibration, five standard solutions containing all analytes (without tissue) at a concentration of 1 µg/ml were subjected to the applied extraction protocol and HPLC analysis. Recovery for each compound was satisfactory, and measured concentrations of TRP, 5-HT, 5-HIAA, KYN, and KYNA were 0.96 ± 0.01 (coefficient of variation (CV) = 1.1%), 0.95 ± 0.03 (CV = 1.6%), 0.97 ± 0.02 (CV = 1%), 0.96 ± 0.01 (CV = 1.4%), and 0.95 ± 0.02 µg/ml (CV = 1.1%), respectively. Subsequently, PVR brain tissue and amniotic fluid samples were analyzed. Fig. 4 presents typical chromatograms, observed for brain samples, along with examples of peak purity and spectral patterns corresponding to TRP, KYN, and KYNA. Similar chromatographic profiles were also observed for amniotic fluid. All analytes can be clearly seen in chromatograms obtained based on UV absorbance and fluorescence. To elute all compounds present in the samples after 35 min of each run, gradient elution was applied and the column was rinsed with 100% ACN with 0.1% TFA for 20 min and equilibrated for 15 min with H2O:ACN 90%:10% (v/v), having 0.1% TFA. Additionally, 200 µl of the mobile phase was injected between samples.
Table 3.
Concentrations of TRP and its major metabolites in brain PVR and amniotic fluid of rabbit fetuses at gestation day 29.
| Analyte | Periventricular region |
Amniotic fluid |
||||
|---|---|---|---|---|---|---|
| Measured by fluorescence | Measured by absorbance | p | Measured by fluorescence | Measured by absorbance | p | |
| TRP | 5.50 ×10⁻⁸± 2.59 ×10⁻⁸ | 5.36 ×10⁻⁸± 2.43 ×10⁻⁸ | 0.43 | 5.40 ×10⁻⁸± 1.23 ×10⁻⁹ | 5.17 ×10⁻⁸± 1.27 ×10⁻⁹ | 0.29 |
| TRP average | (5.43 ±2.51) × 10−8 | (5.29 ± 0.13) × 10−8 | ||||
| KYN | 5.30×10⁻⁹±1.61 ×10⁻⁹ | 4.78 ×10⁻⁹± 1.70 × 10⁻⁹ | 0.17 | 1.73 ×10⁻⁸± 3.21 ×10⁻⁹ | 1.64 ×10⁻⁸± 2.28 ×10⁻⁹ | 0.15 |
| KYN average | (5.04 ± 1.65) × 10−9 | (1.68 ± 0.23) × 10−8 | ||||
| KYNA | 6.43×10⁻¹¹ ±9.69×10⁻¹² | 7.12×10⁻¹¹ ±1.65× 10⁻¹¹ | 0.15 | 7.82 ×10⁻⁹± 1.29 ×10⁻¹⁰ | 6.58 ×10⁻⁹± 9.58 ×10⁻¹⁰ | 0.08 |
| KYNA average | (6.77 ± 1.81) × 10−11 | (7.21 ± 0.11) × 10−9 | ||||
| 5-HT | 4.01 ×10⁻¹⁰±1.91 ×10⁻¹⁰ | 3.85 × 10⁻¹⁰± 1.05 ×10⁻¹⁰ | 0.13 | 2.39×10⁻¹⁰±6.38 × 10⁻¹¹ | 2.85 ×10⁻¹⁰± 5.41 ×10⁻¹¹ | 0.07 |
| 5-HT average | (3.93 ± 1.48) × 10−10 | (2.61 ± 0.3) × 10−10 | ||||
| 5-HIAA | 6.92 ×10⁻¹⁰±2.60×10⁻¹⁰ | 8.29 ×10⁻¹⁰± 2.88 ×10⁻¹⁰ | 0.11 | 6.52 × 10⁻¹⁰± 7.96 × 10⁻¹¹ | 5.85 ×10⁻¹⁰± 5.41 ×10⁻¹¹ | 0.13 |
| 5-HIAA average | (8.10 ± 2.84) × 10−10 | (7.21 ± 0.67) × 10−10 | ||||
Data are expressed in mol/g wet tissue for PVR and mol/ml for amniotic fluid. The p value was obtained based on t test.
Fig. 4.
Representative HPLC chromatograms used for determination of tryptophan and its major metabolites in the periventricular region tissue samples obtained from rabbit fetus brain (gestation day 29). (A) Fluorescence detection with excitation at 297 nm and emission at 347 nm (used for quantification of TRP, 5-HT, and 5-HIAA). (B) Detection at absorbance of 220 nm (used to show peaks associated with all analytes of interest); inset, UV–Vis spectrum corresponding to the peak related to TRP, perfectly matching its spectral pattern (see Figs. 1 and 3C for 5-HT, and for 5-HIAA similar spectra were obtained, data not shown). (C) Example of the purity peak for analysis of TRP; since purity line (solid line) is below or matching threshold (dotted line), the peak is considered to be pure: purity angle 1.238 and purity threshold 1.458. (D) Fluorescence detection with excitation at 364 nm and emission at 480 nm (used for quantification of KYN). (E) Fluorescence detection with excitation at 330 nm and emission at 390 nm (used for quantification of KYNA). (F) Detection at absorbance of 345 nm (used to simultaneously present peaks related to KYN and KYNA, although they were quantified using absorbance at 364 and 330 nm, respectively); insets, UV–Vis spectra corresponding to peaks related to KYN and KYNA perfectly matching their spectral pattern (please see Figs. 1 and 3 and Supplementary Fig. 1S).
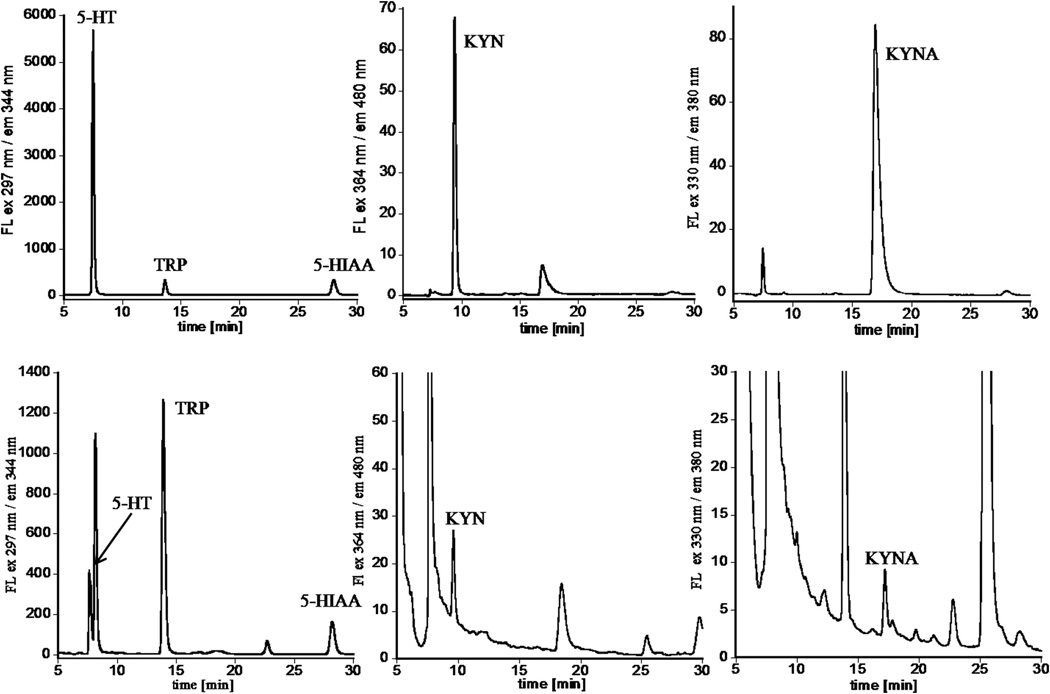
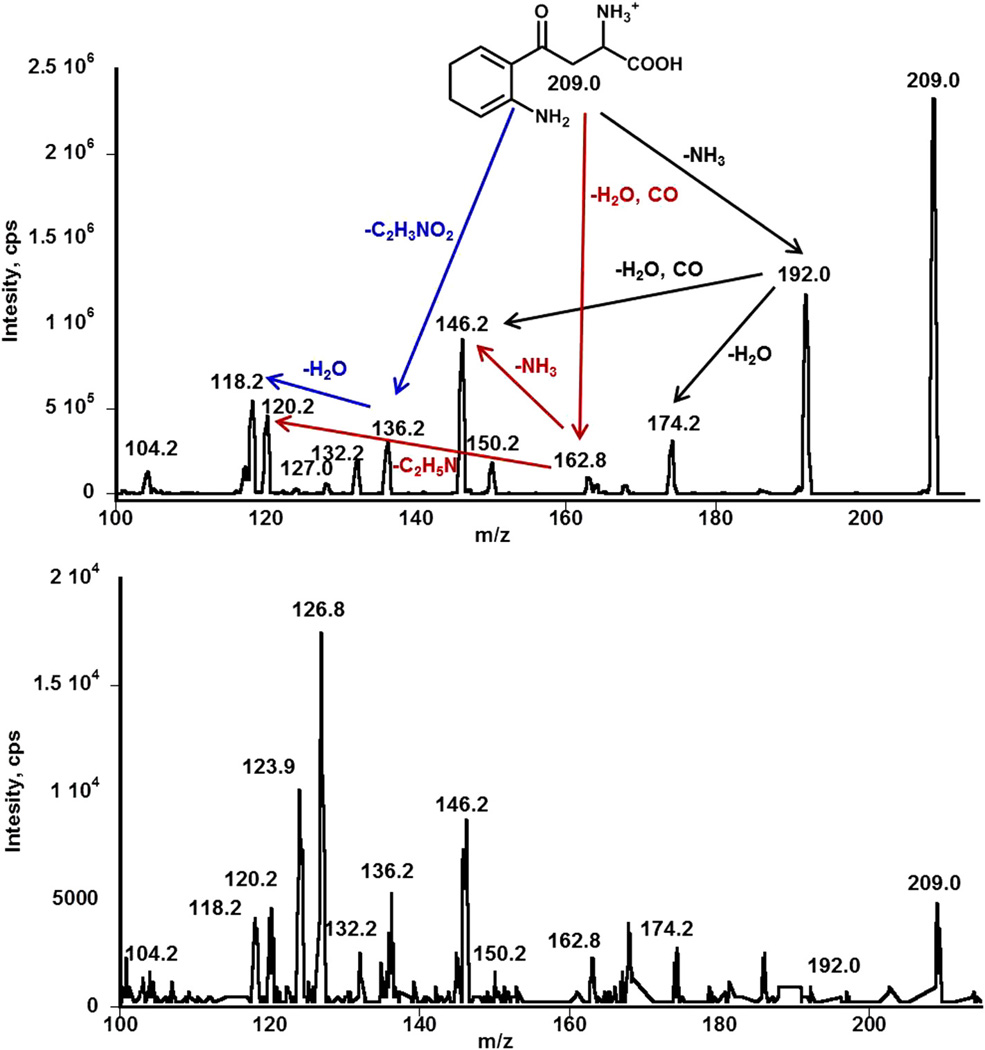
We have confirmed peak assignment by collecting fractions under each signal of interest during HPLC analysis of brain samples and running mass spectrometry, which promoted a change in mobile phase, and trifluoroacetic acid was substituted by acetic acid. This change was primarily to avoid introducing low-pH samples into the mass spectrometer. In this scenario TFA was substituted by acetic acid, and an additional HPLC method for analysis of TRP, 5-HT, 5-HIAA, KYN, and KYNA was developed based on the above-described procedure (Figs. 5 and 6). Replacement of TFA by acetic acid and a decrease in the flow rate by 0.2 ml/min changed elution times of each analyte, and tailing of the peak related to KYNA was observed. However, LOD, recovery, and concentrations of all analytes in the brain and amniotic fluid measured using both mobile phases remained similar. During brain sample analysis, fractions related to each analyte of interest were collected, evaporated using a Speed-Vac concentrator, redissolved in mobile phase (H2O:ACN 50:50 v/v, 0.1% acetic acid), and analyzed by mass spectrometry (Fig. 7, Supplementary Fig. 2S, and Table 4). Spectra of each fraction show a protonated molecular ion [M+H]+ of the expected compound at m/z 205.1, 176.8, 191.8, 209.0, and 190.2 for TRP, 5-HT, 5-HIAA, KYN, and KYNA, respectively, as well as their anticipated fragmentation ions. All compounds, and their fragments, show sequential elimination, NH3, H2O, CO, typically observed for amino acids. Fragmentation patterns of each analyte are in excellent agreement with the reported literature, and the spectroscopic analysis confirmed the proper peak assignment in the HPLC chromatograms [25–27].
Fig. 5.
HPLC chromatograms of standard mixture containing TRP, 5-HT, 5-HIAA, KYN, and KYNA (A) obtained with absorbance at 280 nm (used to quantify TRP, 5-HT, 5-HIAA) and (B) obtained with absorbance at 345 nm (used to show KYN and KYNA simultaneously; however, they were quantified using their λmax values in this region at 364 and 330 nm, respectively). (C and D) A brain sample was used to collect fractions for mass spectrometry analysis derived at 280 and 345 nm.
Fig. 6.
Representative fluorescence HPLC chromatograms of standard mixture containing TRP, 5-HT, 5-HIAA, KYN, and KYNA obtained using a multi-λ fluorescence detector with channels optimized for detection of all analytes (top), and brain extract recorded under the same conditions (bottom). Results indicate that peaks related to each analyte of interest could be detected in a brain sample within one HPLC run.
Fig. 7.
MS/MS spectra of kynurenine standard (top) and the fraction collected under peak related to KYN during HPLC analysis in the brain sample presented in Figs. 5 and 6 (bottom). The fragmentation pattern of kynurenine is in excellent agreement with a previous report [25]. The presence of ions related to kynurenine and its fragments in the spectrum recorded for brain sample indicates appropriate assignment of peak related KYN in the HPLC chromatogram.
Table 4.
Summary of the MS/MS analysis.
| Analyte | Formula | MW | m/z | Observed MS/MS fragments m/z |
|---|---|---|---|---|
| TRP | C11H12N2O2 | 204.2 | 205.1 | 188.0, 159.2, 146.2, 144.2, 132.2, 118.1 |
| 5-HT | C10H12N2O | 176.2 | 176.8 | 160.2, 149.4, 143.2, 136.0, 117.2 |
| 5-HIAA | C10H9NO3 | 191.2 | 191.8 | 173.8, 168.8, 151.2, 147.0, 124.2, 106 |
| KYN | C10H12N2O3 | 208.2 | 209.0 | 192, 174.2, 146.2, 136.2, 120.2, 118.2 |
| KYNA | C10H7NO3 | 189.2 | 190.2 | 172.0, 167.0, 162.2, 149.0, 144.0, 122.0, 116.0, 103.8 |
Despite the rather facile extraction procedure, signals related to each compound of interest were recorded at their optimized detection condition without interfering peaks. This observation was confirmed by the peak purity analysis, taking into account the spectral pattern corresponding to a given peak and mass spectrometry. The concentrations of analyzed compounds in the brain and amniotic fluid samples were calculated using peak areas and equations derived from linear regressions. The mean concentrations of all compounds of interest calculated based on analysis of 12 measurements (3 per sample) for each metabolite and the two above-described HPLC methods are reported in Table 3. The CV values for littermates were ~15% and for nonlittermates ~25% for all analytes. We also evaluated precision and recovery. Five PVR samples were split into two parts: one part was homogenized in deionized water containing known amounts of all analytes and the other part in pure water without addition of any analyte. The signal intensities of metabolites increased proportional to their externally elevated concentrations. High efficiency of recovery for all analyzed compounds was observed: 98% CV = 2.7% for TRP; 102% CV = 4.1% for 5-HT; 96% CV = 3.5% for 5-HIAA; 99% CV = 4.6% for KYN; 97% CV = 3.6% for KYNA. Measured levels of all analytes in the brain samples are in good agreement with values reported in the literature [28–34]. There are few publications reporting concentration of TRP and its metabolites in amniotic fluid; however, our results seem to be consistent with results reported for other animals and humans [33,34].
To our knowledge, kynurenine has not been determined in biological samples based on its native fluorescence. It is worth pointing out that there is controversy regarding the fluorescence of kynurenine. It was reported to be nonfluorescent [35], or to be a weak emitter with excitation around 365 nm and an emission maximum at 480 nm, whose intensity logarithmically increases with decreasing solvent polarity and emission maximum shifts toward blue [23]. Our results confirmed that KYN possesses intrinsic fluorescence and demonstrated that it can be used for its HPLC analysis with a quite low limit of detection reaching 1.2 pmol injected on the column in the HPLC system used. However, typically, only UV absorbance at ~360 nm has been used for quantification of KYN [7,11]. Under the conditions used in the present method, UV absorbance LOD for KYN is four times higher compared to LOD observed using fluorescence. For kynurenic acid quantification either pre- or postcolumn modification with Zn2+ cations is usually applied to form a highly fluorescent Zn2+–KYNA chelate [20,17]. Depending on elution conditions, an LOD of 0.05 nmol/ml can be achieved, which is very useful when small amounts of samples are available. However, the present method with relatively higher LOD (1.13 nmol/ml) for KYNA allows for its quantification in brain and amniotic fluid samples. TRP is typically quantified by means of its native florescence, but 5-HT and 5-HIAA have usually been determined by electrochemical detection with LOD comparable to our findings based on their fluorescence [33,36].
Limitations of this method include the requirement of a relatively larger amount of samples, and run time for each analysis is somewhat long compared to technologies based on mass spectrometry. Since this paper includes method development, we used multiple characterization modalities to validate the methods. Once validated, the protocols can include just one method of detection. In addition, one needs to be careful during sample preparation, since contamination may lead to coelution of compounds, which is difficult to detect with HPLC and may lead to inaccurate quantification of analyte. However, application of the PDA detector and peak purity function indicated that the signals related to all analytes of interest originated from single molecules.
In summary, the concentrations of TRP, 5-HT, 5-HIAA, KYN, and KYNA in the brain and amniotic fluid were quantified using HPLC methods developed based on their intrinsic spectroscopic properties and dual detection. The assignments of metabolite peaks from HPLC were further confirmed by mass spectrometry. Results obtained based on UV absorbance and fluorescence are in good agreement. The simple sample preparation protocol provides excellent reproducibility, and an external standard curve can be used for quantification with satisfactory precision and accuracy. The methods were also successfully adopted for quantification of the same analytes in human and non-human primate serum (data not shown), indicating its clinical applicability. There is a growing need for rapid and routine determination of tryptophan metabolites since TRP:5-HT, TRP:KYN, and KYN:KYNA ratios provide important information for diagnosis and to determine response to treatment of various autoimmune, neurodegenerative, malignant, and psychiatric disorders.
Supplementary Material
Acknowledgment
This research was supported in part by the Perinatology Research Branch, Division of Intramural Research, Eunice Kennedy Shriver National Institute of Child Health and Human Development (NICHD), NIH, and by R01HD069562, NICHD (S.K.).
Footnotes
Abbreviations used: KP, kynurenine pathway; TRP, tryptophan; 5-HT, serotonin; 5-HIAA, 5-hydroxyindoleacetic acid; KYN, kynurenine; KYNA, kynurenic acid.
Appendix A. Supplementary data
Supplementary data associated with this article can be found, in the online version, at http://dx.doi.org/10.1016/j.ab.2013.09.001.
References
- 1.Stone TW. Kynurenines in the CNS: from endogenous obscurity to therapeutic importance. Prog. Neurobiol. 2001;64:185–218. doi: 10.1016/s0301-0082(00)00032-0. [DOI] [PubMed] [Google Scholar]
- 2.Schwarcz R, Pellicciari R. Manipulation of brain kynurenines: glial targets, neuronal effects, and clinical opportunities. J. Pharmacol. Exp. Ther. 2002;303:1–10. doi: 10.1124/jpet.102.034439. [DOI] [PubMed] [Google Scholar]
- 3.Wonodi I, Schwarcz R. Cortical kynurenine pathway metabolism: a novel target for cognitive enhancement in schizophrenia. Schizophr. Bull. 2010;36:211–218. doi: 10.1093/schbul/sbq002. [DOI] [PMC free article] [PubMed] [Google Scholar]
- 4.Schloss P, Williams DC. The serotonin transporter: a primary target for antidepressant drugs. J. Psychopharmacol. 1998;12:115–121. doi: 10.1177/026988119801200201. l. [DOI] [PubMed] [Google Scholar]
- 5.Kannan S, Saadani-Makki F, Balakrishnan B, Dai H, Chakraborty PK, Janisse J, Muzik O, Romero R, Chugani DC. Decreased cortical serotonin in neonatal rabbits exposed to endotoxin in utero. J. Cereb. Blood Flow Metab. 2011;31:738–749. doi: 10.1038/jcbfm.2010.156. [DOI] [PMC free article] [PubMed] [Google Scholar]
- 6.Rorstad O. Prognostic indicators for carcinoid neuroendocrine tumors of the gastrointestinal tract. J. Surg. Oncol. 2005;89:151–160. doi: 10.1002/jso.20179. [DOI] [PubMed] [Google Scholar]
- 7.Schwarcz R, Rassoulpour A, Wu HQ, Medoff D, Tamminga CA, Roberts RC. Increased cortical kynurenate content in schizophrenia. Biol. Psychiatry. 2001;50:521. doi: 10.1016/s0006-3223(01)01078-2. [DOI] [PubMed] [Google Scholar]
- 8.Baran H, Jellinger K, Derecke L. Kynurenine metabolism in Alzheimer’s disease. J. Neural Transm. 1999;106:165–181. doi: 10.1007/s007020050149. [DOI] [PubMed] [Google Scholar]
- 9.Stone TW, Darlington LG. Endogenous kynurenines as targets for drug discovery and development. Nat. Rev. Drug Discovery. 2002;1:609–620. doi: 10.1038/nrd870. [DOI] [PubMed] [Google Scholar]
- 10.Shibata K. Fluorimetric micro-determination of kynurenic acid, an endogenous blocker of neurotoxicity, by high-performance liquid chromatography. J. Chromatogr. 1988;430:376–380. doi: 10.1016/s0378-4347(00)83173-4. [DOI] [PubMed] [Google Scholar]
- 11.Herve C, Beyne P, Jamault H, Delacoux E. Determination of tryptophan and its kynurenine pathway metabolites in human serum by high-performance liquid chromatography with simultaneous ultraviolet and fluorimetric detection. J. Chromatogr. B. 1996;675:157–161. doi: 10.1016/0378-4347(95)00341-x. [DOI] [PubMed] [Google Scholar]
- 12.Widner B, Werner ER, Schennach H, Wachter H, Fuchs D. Simultaneous measurement of serum tryptophan and kynurenine by HPLC. Clin. Chem. 1997;43:2424–2426. [PubMed] [Google Scholar]
- 13.Smythe GA, Braga O, Brew BJ, Grant RS, Guillemin GJ, Kerr SJ, Walker DW. Concurrent quantification of quinolinic, picolinic, and nicotinic acids using electron-capture negative-ion gas chromatography mass spectrometry. Anal. Biochem. 2002;301:21–26. doi: 10.1006/abio.2001.5490. [DOI] [PubMed] [Google Scholar]
- 14.Laich A, Neurauter G, Widner B, Fuchs D. More rapid method for simultaneous measurement of tryptophan and kynurenine by HPLC. Clin. Chem. 2002;48:579. [PubMed] [Google Scholar]
- 15.Vignau J, Jacquemont MC, Lefort A, Imbenotte M, Lhermitte M. Simultaneous determination of tryptophan and kynurenine in serum by HPLC with UV and fluorescence detection. Biomed. Chromatogr. 2004;18:872–874. doi: 10.1002/bmc.445. [DOI] [PubMed] [Google Scholar]
- 16.Fukushima T, Mitsuhashi S, Tomiya M, Iyo M, Hashimoto K, Toyo’oka T. Determination of kynurenic acid in human serum and its correlation with the concentration of certain amino acids. Clin. Chim. Acta. 2007;377:174–178. doi: 10.1016/j.cca.2006.09.019. [DOI] [PubMed] [Google Scholar]
- 17.Mitsuhashi S, Fukushima T, Arai K, Tomiya M, Santa T, Imai K, Toyo’oka T. Development of a column-switching high-performance liquid chromatography for kynurenine enantiomers and its application to a pharmacokinetic study in rat plasma. Anal. Chim. Acta. 2007;587:60–67. doi: 10.1016/j.aca.2007.01.033. [DOI] [PubMed] [Google Scholar]
- 18.Mitsuhashi S, Fukushima T, Tomiya M, Santa T, Imai K, Toyo’oka T. Determination of kynurenine levels in rat plasma by high-performance liquid chromatography with pre-column fluorescence derivatization. Anal. Chim. Acta. 2007;584:315–321. doi: 10.1016/j.aca.2006.11.040. [DOI] [PubMed] [Google Scholar]
- 19.Xiao LD, Luo XB, Pi LG, Tang AG. Simultaneous determination of kynurenine and kynurenic acid concentrations in human serum by HPLC with dual wavelengths fluorescence detection. Clin. Chim. Acta. 2008;395:178–180. doi: 10.1016/j.cca.2008.05.004. [DOI] [PubMed] [Google Scholar]
- 20.Lan-Gan P, Ai-Guo T, Xi-Ming M, Xi-Bo L, Xiang A. More rapid and sensitive method for simultaneous determination of tryptophan and kynurenic acid by HPLC. Clin. Biochem. 2009;42:420–425. doi: 10.1016/j.clinbiochem.2008.11.011. [DOI] [PubMed] [Google Scholar]
- 21.Zagajewski J, Drozdowicz D, Brzozowska I, Hubalewska-Mazgaj M, Stelmaszynska T, Laidler PM, Brzozowski T. Conversion L-tryptophan to melatonin in the gastrointestinal tract: the new high performance liquid chromatography method enabling simultaneous determination of six metabolites of L-tryptophan by native fluorescence and UV-VIS detection. J. Physiol. Pharmacol. 2012;63:613–621. [PubMed] [Google Scholar]
- 22.Edelhoch H. Spectroscopic determination of tryptophan and tyrosine in proteins. Biochemistry. 1967;6:1948–1954. doi: 10.1021/bi00859a010. [DOI] [PubMed] [Google Scholar]
- 23.Fukunaga Y, Katsuragi Y, Izumi T, Sakiyama F. Fluorescence characteristics of kynurenine and N′-formylkynurenine, their use as reporters of the environment of tryptophan 62 in hen egg-white lysozyme. J. Biochem. 1982;92:129–141. doi: 10.1093/oxfordjournals.jbchem.a133909. [DOI] [PubMed] [Google Scholar]
- 24.Lakowicz JR. Principles of Fluorescence Spectroscopy. New York: Springer; 2006. [Google Scholar]
- 25.Vazquez S, Truscott RJW. A study of kynurenine fragmentation using electrospray tandem mass spectrometry. J. Am. Soc. Mass Spectrom. 2001;12:786–794. doi: 10.1016/S1044-0305(01)00255-0. [DOI] [PubMed] [Google Scholar]
- 26.Zhang ZF, Jia Z, Gao P, Kong H, Li X, Chen J, Yang Q, Yin P, Wang J, Lu X, Li F, Wu Y, Xu G. Metabonomics study of atherosclerosis rats by ultra fast liquid chromatography coupled with ion trap-time of flight mass spectrometry. Talanta. 2009;79:836–844. doi: 10.1016/j.talanta.2009.05.010. [DOI] [PubMed] [Google Scholar]
- 27.Moriartya M, Lehanea M, O’Connellb B, Keeleyc H, Fureya A. Development of a nano-electrospray MSn method for the analysis of serotonin and related compounds in urine using a LTQ-orbitrap mass spectrometer. Talanta. 2012;90:1–11. doi: 10.1016/j.talanta.2011.11.085. [DOI] [PubMed] [Google Scholar]
- 28.Barkai AI. Serotonin turnover in the intact rabbit brain: relationship to extracellular proteins and modification by pentobarbital or haloperidol. J. Pharmacol. Exp. Ther. 1979;208:44–48. [PubMed] [Google Scholar]
- 29.Galm EM, Sherman AD. L-Kynurenine: its synthesis and possible regulatory function in brain. Neurochem. Res. 1980;5:223–239. doi: 10.1007/BF00964611. [DOI] [PubMed] [Google Scholar]
- 30.Moroni F, Russi P, Lombardi G, Beni M, Carlh V. Presence of kynurenic acid in the mammalian brain. J. Neurochem. 1988;51:177–180. doi: 10.1111/j.1471-4159.1988.tb04852.x. [DOI] [PubMed] [Google Scholar]
- 31.Baker AJ, Zornow MH, Scheller MS, Yaksh TL, Skilling SR, Smullin DH, Larson AA, Kuczenski YR. Changes in extracellular concentrations of glutamate, aspartate, glycine, dopamine, serotonin, and dopamine metabolites after transient global ischemia in the rabbit brain. J. Neurochem. 1991;57:1370–1379. doi: 10.1111/j.1471-4159.1991.tb08303.x. [DOI] [PubMed] [Google Scholar]
- 32.Busch M, Milakofsky L, Hare T, Nibbio B, Epple A. Regulation of substances in allantoic and amniotic fluid of the chicken embryo. Biochem. Physiol. 1997;116:131–136. doi: 10.1016/s0300-9629(96)00164-8. [DOI] [PubMed] [Google Scholar]
- 33.Kazda H, Taylor N, Healy D, Walker D. Maternal, umbilical, and amniotic fluid concentrations of tryptophan and kynurenine after labor or cesarean section. Pediatr. Res. 1998;44:368–373. doi: 10.1203/00006450-199809000-00017. [DOI] [PubMed] [Google Scholar]
- 34.Tuma P, Samcova E, Andelova K. Determination of free amino acids and related compounds in amniotic fluid by capillary electrophoresis with contactless conductivity detection. J. Chromatogr. B. 2006;839:12–18. doi: 10.1016/j.jchromb.2005.12.020. [DOI] [PubMed] [Google Scholar]
- 35.Myint AM, Kim YK, Verkerk R, Scharpe S, Steinbusch H, Leonard B. Kynurenine pathway in major depression: evidence of impaired neuroprotection. J. Affect. Disord. 2007;98:143–151. doi: 10.1016/j.jad.2006.07.013. [DOI] [PubMed] [Google Scholar]
- 36.Osborne NN, Nesselhut T, Nicholas DA, Patel S, Cuello AC. Serotonin-containing neurones in vertebrate retinas. Neurochemistry. 1982;39:1519–1528. doi: 10.1111/j.1471-4159.1982.tb07984.x. [DOI] [PubMed] [Google Scholar]
Associated Data
This section collects any data citations, data availability statements, or supplementary materials included in this article.


