

Abstract
Background
Downward trends in activity limitations among the older U.S. population have recently plateaued, while activity limitation among the pre-retirement population has increased.
Objectives
Update temporal trends in limitations in sensory and physical functions, instrumental activities of daily living (IADLs), and activities of daily living (ADLs) for the 40-64 and 65-and-over U.S. populations; assess the extent to which trends in education, smoking, and obesity could account for the trends in limitations; and examine trends in conditions cited as causes of limitations, their durations, and proportion of life spent with them.
Methods
Multivariate analysis of the 1997-2010 National Health Interview Survey.
Results
For the younger group, there have been increases in all limitations, except trouble hearing, which has declined. Increased obesity could account for the increases in vision, physical function, and IADL limitations. Musculoskeletal conditions, such as arthritis and back/neck problems, are frequently cited as causes of limitation, and there are growing roles for depression and nervous system conditions.
For the 65-and-over group, there have been decreases in all limitations, except difficulty with physical functions, which is up. Increased education could account for the decline in ADL limitation, and increased obesity could account for increased difficulty with physical functions. Musculoskeletal conditions are also frequently cited as causes of limitation, but declines in heart- and vision-related limitations have been important.
Conclusion
Trends should continue to be monitored closely for both groups, since younger people have not experienced the improvements of the older group, but are its future members.
Keywords: trends, disability, disease, education, behavior
INTRODUCTION
One of the most important findings in disability research in recent decades has been that the prevalence of late-life limitation in the United States decreased from the mid-1980s through the late 1990s. This trend was first documented by Manton and colleagues using data from the National Long Term Care Survey (NLTCS)1 and subsequently confirmed by multiple other studies, including a collaborative effort by Freedman and colleague who analyzed data from five national surveys including the NLTCS.2 No one factor appears to be responsible for this improvement, but among those likely playing a role are decreases in cardiovascular, musculoskeletal, and vision problems and increases in education and use of assistive technology.3
However, a more recent collaborative project concluded that there was a plateau in activity limitation among the 65-and-over population from 2000 to 2008.4 Results vary by specific survey, measure of limitation, subperiod, and age group, but the overall impression is one of no change. There is also mounting evidence that activity limitation has increased, albeit from a very low level, among those approaching retirement age.5,6,7 For example, Martin and colleagues found an increased need for help with some activities for the 40 to 64 population from 1997 to 2008, but stability for others.6 Again, no one factor appears to be associated with the upward trend among the younger population, but among those implicated are the increase in obesity6 and the growing attribution of need for help to back and neck problems, other musculoskeletal conditions, diabetes, depression and other emotional problems, and nervous system conditions.5
In this paper, we used National Health Interview Survey data through 2010 to update previous analyses of temporal trends in sensory and physical functioning and need for help with activities for ages 40-64 and ages 65 and over. We assessed the extent to which trends in education, smoking, and obesity could account for these trends. Finally, we examined the top conditions cited as causes of limitations, and the proportion of life lived with these limiting conditions.
METHODS
Data
We used data for people ages 40 and older from the 1997-2010 National Health Interview Survey (NHIS), which is a nationally representative annual survey of the non-institutionalized population of the United States. The family core questionnaire of the survey ascertains information on all members of the sample household about need for help with routine needs and personal care, as well as demographic and socioeconomic characteristics. An additional interview of a sample adult from each sample household collects, among other things, information about difficulty with physical and sensory functions, body weight and height, and smoking behavior. Table 1 shows the unweighted sample sizes from the family core and the sample adult samples that we used in our analyses.
Table 1.
NHIS Sample Sizes (unweighted numbers) and Characteristics (weighted %), Ages 40-64 and 65 and Over, 1997 and 2010
| 40-64 | 65+ | |||||
|---|---|---|---|---|---|---|
|
| ||||||
| 1997 | 2010 | All Years | 1997 | 2010 | All Years | |
| Family core respondents (n) | 28,970 | 28,691 | 392,679 | 11,891 | 10,440 | 145,245 |
| Proxy response in family core | 43.98% | 43.51% | 34.62% | 36.16% | ||
| Female | 51.27 | 51.13 | 57.91 | 56.68 | ||
| Male | 48.73 | 48.87 | 42.09 | 43.32 | ||
| Age | ||||||
| 40-44 | 28.00 | 20.48 | ||||
| 45-49 | 24.25 | 22.21 | ||||
| 50-54 | 19.57 | 21.75 | ||||
| 55-59 | 15.24 | 18.68 | ||||
| 60-64 | 12.94 | 16.89 | ||||
| 65-69 | 29.99 | 31.85 | ||||
| 70-74 | 26.57 | 22.98 | ||||
| 75-79 | 20.96 | 18.51 | ||||
| 80-84 | 13.39 | 14.07 | ||||
| 85+ | 9.09 | 12.59 | ||||
| Sample adults (n) | 13,618 | 11,397 | 169,509 | 6,972 | 5,264 | 78,328 |
| Education | ||||||
| 0 to 8 years | 5.98% | 4.54% | 18.24% | 9.94% | ||
| 9 to 11 years | 7.93 | 5.45 | 14.24 | 9.62 | ||
| 12 years | 32.10 | 28.53 | 35.13 | 33.59 | ||
| Some college | 27.14 | 29.30 | 17.23 | 23.86 | ||
| College or more | 26.12 | 31.81 | 13.33 | 22.21 | ||
| Missing | 0.74 | 0.37 | 1.83 | 0.79 | ||
| Never smoked | 45.38 | 54.66 | 48.97 | 50.60 | ||
| Formerly smoked | 28.43 | 23.70 | 38.29 | 39.20 | ||
| Currently smokes | 25.39 | 20.83 | 11.94 | 9.34 | ||
| Missing | 0.80 | 0.81 | 0.80 | 0.86 | ||
| BMI<18.5 | 1.25 | 1.06 | 3.19 | 2.18 | ||
| 18.5≤BMI<25 | 35.79 | 28.13 | 41.08 | 33.50 | ||
| 25≤BMI<30 | 37.03 | 35.61 | 36.93 | 36.03 | ||
| 30≤BMI<35 | 15.36 | 19.04 | 12.12 | 16.28 | ||
| 35≤BMI<40 | 4.52 | 7.36 | 2.80 | 5.31 | ||
| BMI≥40 | 2.71 | 4.75 | 1.11 | 2.93 | ||
| Missing | 3.34 | 4.07 | 2.77 | 3.78 | ||
Outcome Measures
In selecting outcome measures, we used as our frame of reference the so-called disablement process.8,9,10 Diseases (e.g., arthritis) may result in an impairment (e.g., joint stiffness), which may in turn lead to limitations in sensory, cognitive, or physical functioning (e.g., difficulty standing). The ultimate step in this stylized characterization of the disablement process is limitation in carrying out specific activities, such as shopping (often referred to as an instrumental activity of daily living or IADL) and bathing (activity of daily living or ADL). As in the World Health Organization’s alternative disablement framework,11 this characterization views disability as a function of both individual capacity and features of the social and built environment. Use of assistive technology or changes in how activities are carried out may help bridge the gap between capacity and the demands of the particular task. Limitations in vision are assessed in the NHIS by a question to sample adults regarding any trouble seeing even with glasses or contacts. Limitations in hearing are based on self-assessments by sample adults without the use of a hearing aid, and we coded our outcome variable as any trouble at all. Missing responses for vision and hearing (each 0.11%) were excluded.
Sample adults are also asked about difficulty (by themselves and without using special equipment) with nine physical functions: stooping, bending, or kneeling; standing two hours; pushing or pulling a large object; walking a quarter-mile; climbing ten steps; sitting two hours; lifting and carrying ten pounds; reaching over the head; and grasping small objects. We created a summary measure of any physical functional limitation that is coded 1 if difficulty is indicated for any of the nine individual functions. The 0.45 percent who do not indicate difficulty with any of the nine and for whom responses to individual questions are missing were excluded.
The NHIS family core inquires about IADLs through a question about needing help with routine needs activities such as “everyday household chores, doing necessary business, shopping, or getting around for other purposes,” “because of a physical, mental, or emotional problem.” The ADL question asks about need for help with personal care needs, such as “eating, bathing, dressing, or getting around inside,” “because of a physical, mental, or emotional problem.” We excluded the 0.06 and 0.04 percent of respondents, respectively, for whom answers to these global IADL and ADL questions are missing.
Explanatory Variables
To understand better the trends in sensory function, physical function, and activity limitations, we fit models to assess the extent to which controlling for sociodemographic and health behavior variables accounts for the trends in limitations. We focused on variables that are measured consistently over time in the NHIS, that have significant associations with limitations in the cross-section, and whose distributions changed during the study period.
As shown in Table 1, both the 40-64 and 65-and-over populations aged from 1997 to 2010, and we included five-year age groups in our basic trend models. The proportion of males increased significantly in the older population, so we either controlled for sex in our models or fit models separately for males and females. There are no missing values for either age or sex.
The changes in educational attainment for both the younger and older populations were substantial over the 14-year period. In our models, we used dummy variables for 9 to 11 years of education, 12 years or its equivalent, some college, college or more, and education information missing.
The proportion never smoking increased substantially and the proportion currently smoking declined substantially for both age groups. In our models, we used dummy variables for currently smoking, formerly smoking, and smoking missing.
The substantial increase in measured obesity in the 1980s and 1990s is well documented, but the upward trend slowed or even leveled off in the last decade.12 Body mass index (BMI) estimates calculated by NHIS using self-responses to questions about height and weight indicate that there was a continued increase in self-reported obesity throughout our study period. In our models, we included dummy variables for 18.5≤BMI<25, 25<=BMI<30 (overweight), 30<=BMI<35 (grade 1 obesity), 35<=BMI<40 (grade 2 obesity), BMI>=40 (grade 3 obesity), and BMI missing.
In addition to investigating the association of education, smoking, and obesity with the trends in limitations, we analyzed trends in the health conditions that NHIS respondents said caused their limitations. Those responding as having difficulty with any of the nine questions about physical functions or three other questions regarding participation in various social activities (which we do not analyze here) are asked a follow-up question about the health conditions that cause these types of difficulty, and NHIS recodes their answers (which can be multiple) into 34 causal condition categories. We assumed that the cause(s) provided are associated with physical function if the person indicated difficulty with any of the physical functions. Similarly, those responding that they need help with IADLs or ADLs, as well as those with work, cognitive, and other limitations, are asked a follow-up question about which health conditions cause these types of limitations and how long they have had the conditions. We considered the cause(s) to be associated with IADLs/ADLs if the person indicated need for help with these activities.
Statistical Analysis
In our basic models for trends in limitations, we fit models for both sexes together and each sex separately. The former allows assessment of the continuation of trends found in previous studies, which have primarily focused on both sexes. In preliminary analysis, however, we found that trends in some outcomes differed by sex, so we also present results separately for females and males. In all models of trends in limitations, we used logistic regressions that control for age group, sex (for models of both sexes), and trend (0 to 13). Because proxy responses may systematically differ from self-responses, we also included an indicator of proxy response to the NHIS family core questionnaire in models of those outcomes ascertained through the NHIS family core (need for help with IADLs and ADLs; but not vision, hearing, or physical functions, which are part of the sample adult questionnaire).
The odds ratios (ORs) on trend in the logistic models may be used to estimate the average annual percent change in the outcome, which is equal to 100*[OR for trend minus 1]. To assess the extent to which changes in education, smoking, and obesity are associated with the trends in limitations, we added each of the three variables individually to the basic models for each outcome. Our interest is not in testing for the statistical significance of change in the trend OR when different variables are added to the model, but rather in investigating the confounding influence of the additional variable and thus the change in the size of the trend OR. However, care must be taken in comparing ORs across logistic models, since the variance of the outcome (a component of the OR estimation) changes as variables are added to models (unlike the case for OLS regression in which the variance is fixed).13 We conducted two types of sensitivity analyses: (1) comparing estimated trend coefficients from models using OLS rather than logit regression, and (2) comparing estimated trend coefficients from logit regressions in which the variance of the outcome was fixed (also known as y-standardized coefficients), but inclusion of weights or adjustments for the complex sample design of the NHIS was not possible. Both these analyses indicated no difference from the substantive results reported here.
For all of the above models, we limited our analysis to the NHIS sample adults (for whom information on some variables is collected through the NHIS family core questionnaire and information on others through the NHIS sample adult questionnaire). Because the smoking and obesity information is obtained for only the sample adult in an NHIS household, and we wanted to compare the effect of education on trends from the basic models with the effects of smoking and obesity on these trends, we restricted the analysis to the sample adults for the basic models and the models with each of the three additional variables.
NHIS documentation of proxy responses to the sample adult questionnaiare changed over the analysis period, so we were not able to control consistently over time for proxy responses to that questionnaire. Accordingly, we excluded from all of the above analyses sample adults for whom proxy responses were apparent (0.53% of responses for 40-64 and 2.06% of responses for 65 and over), since all of these analyses included some information ascertained via the sample adult questionnaire (either outcome variables—sensory and physical function—or explanatory variables—smoking and obesity). After the exclusion, we re-scaled the weights for the sample adults. As noted earlier, for models of outcomes ascertained via the family core questionnaire (need for help with IADLs and ADLs), we were able to include an indicator of proxy response to the NHIS family core.
For models of trends in conditions reported as causing the limitations and trends in duration of conditions causing IADL and ADL limitations, we used the larger samples from the NHIS family core, since it was the source of all relevant data required for those models, and the larger sample sizes allowed analysis of relatively rare outcomes. We used logit regression for the condition models and ordinary least squares (OLS) regression for duration models. For both, we controlled for age, sex, and proxy response to the NHIS family core questionnaire.
For all models (OLS and logistic), standard errors of our estimates were adjusted to reflect the complex sample design of the NHIS.
RESULTS
Figure 1 shows the unadjusted trends in limitations from 1997 to 2010 for the 40-64 group. Over a third of this younger population reported difficulty with at least one of the nine physical functional limitations. The most difficult physical functions were stooping, standing, pushing, and walking—all functions involving mobility (not shown). After the physical functions, the 40-64 group had the most trouble with the sensory functions of hearing and vision. Needing help with IADLs and ADLs have the lowest prevalence; as recently as 2010, only 1.7 percent of the 40-64 population reported needing help with ADLs (most commonly bathing).
Figure 1.
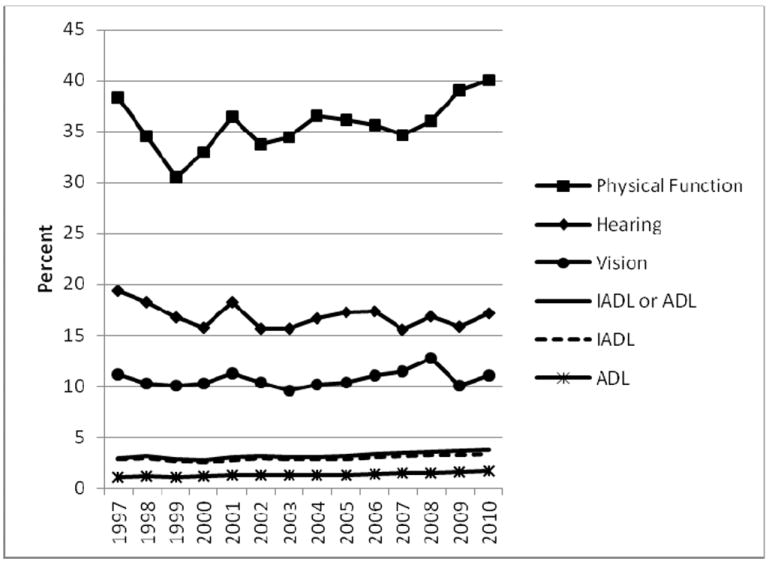
Limitations, Ages 40-64
Figure 2 shows unadjusted trends over time for the same outcomes for the 65-and-older population. The order of the outcomes in terms of prevalence—high to low—is the same as for the younger population, but the scale of this second graph is considerably greater. As many as two-thirds of the older group reported difficulty with one of the nine physical functions. Again, the mobility functions were most common (not shown). The prevalence of trouble hearing is over twice that for the younger group. Again, the least prevalent outcome is needing help with ADLs.
Figure 2.
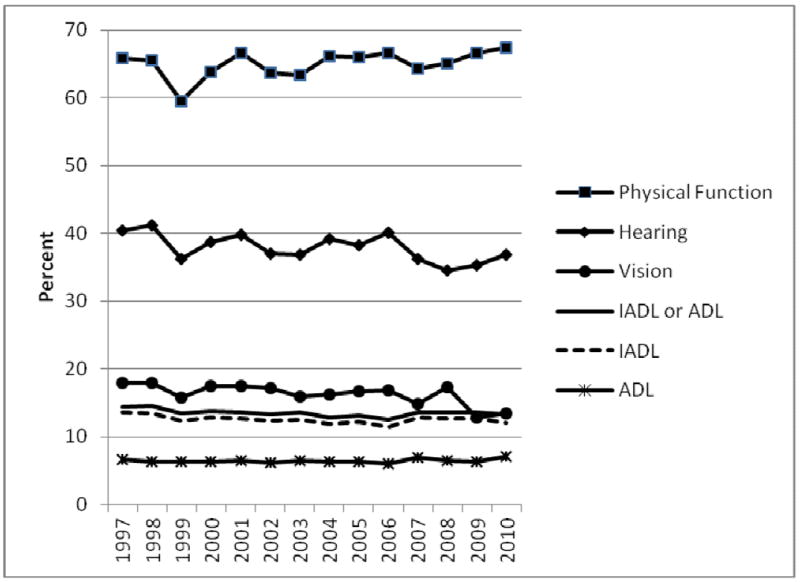
Limitations, Ages 65+
The left side of Table 2 presents for the 40-64 sample adults the odds ratios for the trend variable in logistic models of limitation of three types: difficulty with any of nine physical functions, need for help with any IADL, and need for help with any ADL. For both sexes taken together and for females, the results of the basic models indicate that the odds of having a limitation significantly increased for all three outcomes from 1997 to 2010. For males, only the odds of having difficulty with physical functions increased. For both sexes, the estimated average annual rate of increase for physical functional limitations was 0.9 percent (= 100*(1.009-1), for IADL limitations was also 0.9 percent, and for ADL limitations was 2.7 percent, which is quite large. The estimated rate of increase of ADL limitations for females is even higher at 3.6 percent.
Table 2.
Odds Ratios for Trend in Logistic Models of Limitation, 1997-2010, Ages 40-64 and 65+, NHIS Sample Adults (Both Sexes, Females, and Males)
| 40-64 | 65+ | |||||
|---|---|---|---|---|---|---|
|
| ||||||
| Sample and model | Difficulty with any of 9 physical functions | Needs help with IADLs | Needs help with ADLs | Difficulty with any of 9 physical functions | Needs help with IADLs | Needs help with ADLs |
| Both sexes | (n=168,890) | (n=169,364) | (n=169,384) | (n=77,771) | (n=78,267) | (n=78,280) |
| Basic: age, sex | 1.009*** | 1.009* | 1.027*** | 1.008** | 0.984*** | 0.991† |
| Basic+education | 1.012*** | 1.017*** | 1.035*** | 1.015*** | 0.992* | 1.000 |
| Basic+smoking | 1.013*** | 1.013** | 1.032*** | 1.009** | 0.984*** | 0.991† |
| Basic+BMI | 1.001 | 1.001 | 1.018** | 1.000 | 0.978*** | 0.987** |
| Females | (n=92,711) | (n=92,979) | (n=93,001) | (n=48,087) | (n=48,419) | (n=48,423) |
| Basic: age | 1.007** | 1.013* | 1.036*** | 1.012*** | 0.985*** | 0.999 |
| Basic+education | 1.012*** | 1.020*** | 1.044*** | 1.019*** | 0.993 | 1.009 |
| Basic+smoking | 1.010*** | 1.016** | 1.039*** | 1.012*** | 0.984*** | 0.998 |
| Basic+BMI | 0.998 | 1.003 | 1.026** | 1.004 | 0.979*** | 0.993 |
| Males | (n=76,179) | (n=76,385) | (n=76,383) | (n=29,684) | (n=29,848) | (n=29,857) |
| Basic: age | 1.011*** | 1.004 | 1.016 | 1.004 | 0.981** | 0.977* |
| Basic+education | 1.013*** | 1.010 | 1.023* | 1.010** | 0.990 | 0.982† |
| Basic + smoking | 1.016*** | 1.009 | 1.022* | 1.006† | 0.982** | 0.977* |
| Basic+BMI | 1.004 | 0.999 | 1.009 | 0.997 | 0.979** | 0.975* |
p < .10;
p < .05;
p < .01;
p < .001
In the first half of the 14-year period, difficulty with functional limitations actually decreased for both sexes together, but the increase in the second half was substantial (results not shown). Similarly, there was no trend in IADLs from 1997 to 2003, followed by an increase from 2004 to 2010. Increases in need for help with ADLs were significant for both sub-periods for the younger group.
For all outcomes and samples, adding education to the basic model for the 40-64 group is associated with even greater odds ratios on trend (in the case of ADLs for males, leading to a statistically significant increase as opposed to no change in the basic model). This pattern suggests that had the educational attainment of the 40-64 group not increased over time, the increase in limitations would have been even greater. The addition of smoking alone to the basic model also results in larger odds ratios for trend, but typically not to as great an extent as does education. (The major exception is for physical functional limitations for males.) Nevertheless, the decline in smoking over time is associated with beneficial consequences for trends in these three outcomes.
In contrast, adding BMI categories to the basic models results in substantially smaller odds ratios for trend, and in the cases of physical functions for both sexes, females, and males and of IADLs for both sexes and females, adding BMI to the models results in the elimination of the statistical significance of the upward trends. Thus, the increase in BMI over time potentially could explain the upward trends in limitation in these five cases.
The right side of Table 2 shows the trend model results for the 65-and-over sample adults. Difficulty with physical functions increased significantly for both sexes and females. However, need for help with IADLs declined for both sexes, females, and males (the ORs on trend are significantly less than 1), while need for help with ADLs declined for both sexes and males. For example, needing help with IADLs for both sexes is estimated to have declined each year by 1.6 percent (=100*(.984-1.00)). Basic models of IADL and ADL limitation fit by five-year age groups (results not shown) indicate that the declines were concentrated in the 80+ population. As was the case for the younger group, for the entire older group, the trend in IADL limitations in the first half of the 14-year period was more advantageous than in the last half, in this case downward and flat, respectively (results not shown). When the physical function and ADL analyses are divided into two periods, there are not significant trends in either.
The effects of adding education to the basic models for the 65+ group follow the same pattern as for the younger group, suggesting positive implications of increased education for late-life functioning and activities. For this older group, there appears to have been little effect of smoking, except for physical functioning among males. Adding BMI to the models for physical functions for both sexes and for females eliminates the statistically upward trends.
We fit similar models for trouble hearing and seeing (results not shown). Hearing problems declined significantly for all three samples of the older group and for both sexes and males for the younger group. The estimated average annual rate of decline for males ages 40-64 is the largest at 2.1 percent. Adding smoking to the hearing model for younger males reduced the decline by over 20 percent. Adding BMI to the hearing model for younger females resulted in a statistically significant decline, suggesting that if obesity had not increased, there might have been a decline in hearing problems for younger females.
Vision problems also declined for all three samples of the older group, but increased significantly for both sexes and for females among the 40-64 group at estimated average annual rates of 0.5 and 0.8 percent, respectively. In these two cases, adding BMI to the basic models resulted in the statistically insignificant trends. There were no statistically significant trends in any of the vision models for younger males. Adding education to the vision models for both sexes, females, and males at ages 65 and over reduced the estimated average annual percent decline by 20 percent or more, suggesting that had educational attainment not increased, the decline in vision problems might not have been so great.
Table 3 presents the top conditions out of a possible 34 conditions to which NHIS sample adults attributed their difficulties with physical functional limitations for age groups 40-64 and 65-plus. For the younger group on the left, the four most commonly mentioned causes in both the first half (1997-2003) and the last half (2004-2010) of the study period are musculoskeletal in nature: arthritis/rheumatism, back/neck problem, fracture/bone/joint injury, and other musculoskeletal condition (e.g., problems with muscles or tendons, osteoporosis). Over 1,000 out of every 10,000 people said that they had difficulty that was caused by arthritis/rheumatism, and the proportion increased significantly in our models based on data for the full 14-year period. There were also increases in difficulties caused by other musculoskeletal condition, depression/anxiety/emotional problem, and nervous system condition (e.g., paralysis, multiple sclerosis, ALS, Parkinson’s, migraine). In contrast, difficulties attributed to fracture/bone/joint injury and heart problem declined. Weight problem appears in the list of top conditions causing physical functional limitations for the 40-64 group, but its ranking did not change over time.
Table 3.
Number of People Ages 40-64 and 65+ per 10,000 Reporting that a Condition Caused Them Difficulty with Physical Functions for the Top Conditions, NHIS Sample Adults, 1997-2003 and 2004-2010
| 40-64 | 1997-2003 average number per 10,000 [rank] | 2004-2010 average number per 10,000 [rank] | 65+ | 1997-2003 average number per 10,000 [rank] | 2004-2010 average number per 10,000 [rank] |
|---|---|---|---|---|---|
| Arthritis/rheumatism | 1066 [1] | 1223 [1]*** | Arthritis/rheumatism | 2825 [1] | 2942 [1] |
| Back/neck problem | 1052 [2] | 1098 [2] | Back/neck problem | 1081 [2] | 1240 [2]*** |
| Fracture/bone/joint injury | 462 [3] | 416 [4]*** | Heart problem | 763 [3] | 602 [4]*** |
| Other musculo-skeletal condition | 359 [4] | 659 [3]*** | Fracture/bone/joint injury | 653 [4] | 514 [5]*** |
| Lung/breathing problem | 228 [5] | 229 [7] | Lung/breathing problem | 506 [5] | 480 [6] |
| Weight problem | 227 [6] | 246 [6] | Other musculo-skeletal condition | 487 [6] | 890 [3]*** |
| Depression/anxiety/emotional problem | 214 [7] | 276 [5]*** | Vision problem | 392 [7] | 292 [9]*** |
| Heart problem | 192 [8] | 173 [9]*** | Hypertension | 388 [8] | 336 [7]** |
| Nervous system condition | 162 [9] | 228 [8]*** | Diabetes | 325 [9] | 318 [8] |
| Hypertension | 155 [10] | 164 [11] | Old age | 280 [10] | 259 [10]** |
| Diabetes | 145 [11] | 165 [10]† |
p < .10;
p < .05;
p < .01;
p <.001: p values indicate the significance of trends in reports of a condition causing difficulty, using data for 1997-2010 for each broad age group in a logistic model for each outcome and controlling for sex and five-year age group (n=168,890 for 40-64; n= 77,771 for 65+).
As shown on the right side of Table 3, musculoskeletal conditions also top the list of causes of physical functional difficulty for the 65-plus group and difficulties caused by two of them increased significantly over time—back/neck problem and other musculoskeletal condition. The top cause, arthritis/rheumatism, remained stable at almost 3,000 out of 10,000 people. Heart problem plays a more important role for the older group than for the younger, but again there was a significant decline in difficulty associated with it over the 14-year period. There were also statistically significant declines for fracture/bone/joint injury, hypertension, vision problem, and “old age.”
Table 4 presents the top conditions to which NHIS respondents in the family core attributed their need for help with IADLs and ADLs for age groups 40-64 and 65-plus. In contrast to Table 3, the numbers here are much smaller, reflecting the lower prevalence of IADL and ADL limitation in comparison to physical functional limitation. For the younger group, there were significant increases in need for help associated with seven of the causes. Table 4 also shows the mean duration in years for 1997-2010 for each of the top conditions. For ages 40-64, the durations range from 10.5 years for fracture/bone/joint injury to 17.6 years for nervous system condition.
Table 4.
Number of People Ages 40-64 and 65+ per 10,000 Population Reporting that a Condition Caused Them to Need Help with IADLs or ADLs, 1997-2003 and 2004-2010, and the Mean Duration in Years for the Top Conditions, 1997-2010, NHIS Family Core
| 40-64 | 1997-2003 average number per 10,000 [rank] | 2004-2010 average number per 10,000 [rank] | 1997-2010 mean duration of condition in years | 65+ | 1997-2003 average number per 10,000 [rank] | 2004-2010 average number per 10,000 [rank] | 1997-2010 mean duration of condition in years |
|---|---|---|---|---|---|---|---|
| Back/neck problem | 78 [1] | 102 [1]*** | 13.6 | Arthritis/rheumatism | 449 [1] | 413 [1]*** | 16.9 |
| Arthritis/rheumatism | 76 [2] | 79 [2] | 13.8 | Heart problem | 337 [2] | 282 [2]*** | 12.3 |
| Depression/anxiety/emotional problem | 54 [3] | 68 [3]*** | 16.8 | Vision problem | 243 [3] | 183 [5]*** | 13.4 |
| Heart problem | 47 [4] | 49 [7] | 11.1 | Hypertension | 229 [4] | 225 [3] | 17.0 |
| Hypertension | 44 [5] | 53 [6]*** | 13.0 | Stroke | 204 [5] | 161 [8]*** | 6.6 |
| Diabetes | 44 [6] | 58 [5]*** | 11.9 | Diabetes | 202 [6] | 207 [4] | 15.2 |
| Nervous system condition | 42 [7] | 61 [4]*** | 17.6 | Lung/breathing | 166 [7] | 151 [9]* | 13.7 |
| Lung/breathing problem | 38 [8] | 46 [9]*** | 15.1 | Back/neck problem | 165 [8] | 183 [6]** | 16.8 |
| Vision problem | 36 [9] | 36 [11] | 16.6 | Fracture/bone/joint injury | 164 [9] | 124 [11]*** | 8.5 |
| Fracture/bone/joint injury | 35 [10] | 38 [10] | 10.5 | Senility | 148 [10] | 174 [7]* | 5.2 |
| Other musculo-skeletal condition | 27 [11] | 47 [8]*** | 11.6 | Other musculo-skeletal condition | 77 [14] | 150 [10]*** | 12.0 |
p < .10;
p < .05;
p < .01;
p <.001: p values indicate the significance of trends in reports of a condition causing need for help, using data for 1997-2010 for each broad age group in a logistic model for each outcome and controlling for sex, five-year age group, and proxy (n=392,203 for 40-64; n=145,087 for 65+).
In comparison to that for the younger group, the list for the older group of conditions causing need for help with IADLs and ADLs on the right side of Table 4 includes two different conditions, senility (dementia) and stroke. Both are reported as having relatively short mean durations. But the trend in attributing need for help to senility is upward, whereas that for stroke is downward. There are also upward trends for back/neck problem and other musculoskeletal condition and downward trends for arthritis/rheumatism, heart problem, vision problem, and lung/breathing problem.
The sample sizes did not support analysis of trends in duration for specific conditions, so we created for each person who reported needing IADL or ADL help a variable that indicated the duration of the longest-lasting condition associated with needing help. Figure 3 shows the annual means in the duration of these longest-lasting conditions for the younger and older groups. The means appear to increase over time for both groups, but are always higher for the younger group than for the older group. Regression models (results not shown) indicated that the maximum duration for the 40-64 group increased significantly at an average rate of 0.200 year per year or two years per ten years. The increase for the older group was also statistically significant but smaller, only 0.085 year per year (0.85 year per ten years).
Figure 3.
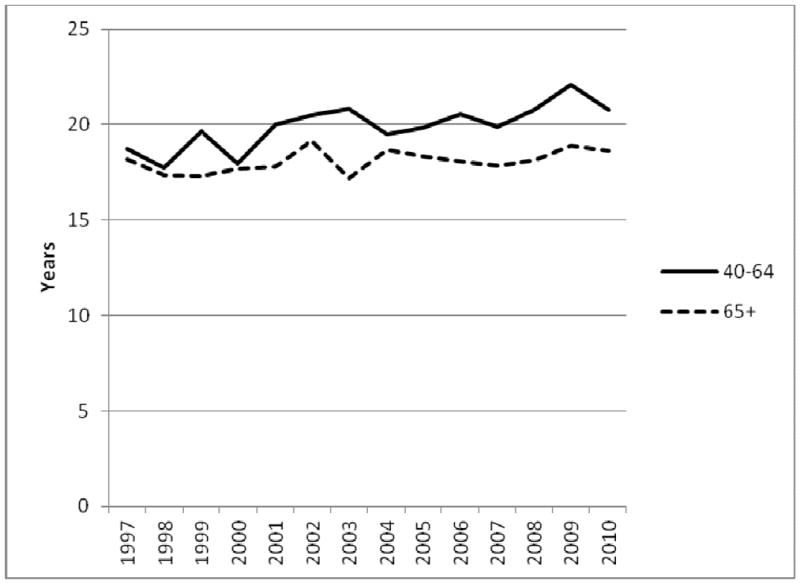
Duration of Longest-Lasting Condition Causing Need for Help with ADLs & IADLs per Person: Means by Year and Age Group
Finally, we calculated the proportion of life thus far that has been spent with the longest-lasting condition for each person reporting needing help. Figure 4 graphs the means of these proportions for each five-year age group, based on data for the entire study period. The figure also shows the mean duration of the longest-lasting conditions by five-year age groups, again averaged over the entire study period. The mean duration climbs from 18.8 years at ages 40-44 to 20.8 years at ages 60-64 and then falls to 16.7 years at ages 85 plus. Accordingly, the proportion of life spent with the longest-lasting condition said to be causing that need for help declines steadily with age, ranging from 45 percent of their lives for 40-to-44-year-olds to 20 percent of their lives for those 80 and over.
Figure 4.
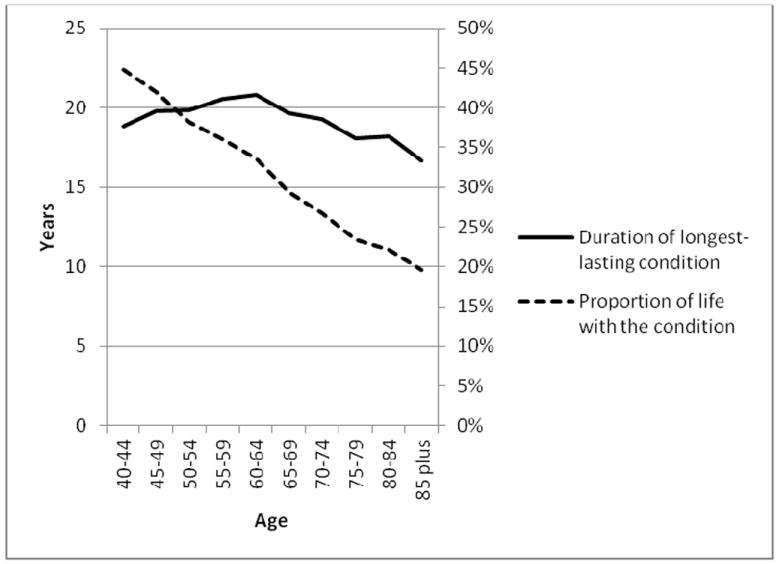
Duration of Longest-Lasting Condition Causing Need for Help and Proportion of Life with the Condition: Means for 1997-2010 by 5-Year Age Group
DISCUSSION
People ages 40 to 64 years are increasingly reporting difficulty with physical functions and need for help with IADLs and ADLs. The recent increase in ADL limitation in this younger population has previously been highlighted by Martin, Freedman, and colleagues (using NHIS data for ages 50-64 from 1997 to 2007)5 and by Martin, Schoeni, and Andreski (using NHIS data for ages 40-64 from 1997 to 2008).6 The increase in need for help with ADLs for females ages 40-64 is especially large. The significant increase in need for help with IADLs and physical functional limitations, especially between 2007 and 2010 for the latter, is new for the 40-64 group except for Seeman and colleagues’ comparison of cohorts ages 60-69 in 1988-94 versus 1999-2004, using data from the National Health and Nutrition Examination Survey.7
There was also a significant increase in difficulty with physical functions for the 65-and-over population in the early part of the 21st century, which is new. Using NHIS data from 1997 to 2008, Martin, Schoeni, and Andreski did not find a significant trend in physical functional limitations,6 and studies of earlier periods generally found declines (see, e.g., Freedman & Martin, using Survey of Income and Program Participation data from 1984 to 199314). But as suggested by the unadjusted prevalence by year in Figure 2, the trend has been consistently upward in the last few years.
Our findings of declines among the older population in need for help with IADLs and ADLs (albeit with p=.084 for the latter) are consistent with those of Martin, Schoeni, and Andreski who conducted similar analysis for 1997 to 2008.6 However, our findings are contrary to those of Freedman and colleagues, who examined trends for the older population using data from five national surveys.4 The NHIS analysis reported in that paper, which showed no significant change in need for help with ADLs, differed from our analysis here in several ways: It was based on data from 2000 to 2008; reports of need for help were conditioned on having a chronic disease; the NHIS family core sample (as opposed to the NHIS sample adult sample) was used; the measure of need for help was based on answers to six individual ADL questions (vs. the global question used here); and models did not control for age, sex, or proxy, and used linear rather than logistic regression. Nevertheless, analyses of data from the four other surveys used by Freedman and colleagues also yielded no trends in ADLs, except for the Health and Retirement Study, which found a decline in difficulty with ADLs from 2000 to 2004. The fact that the declines we found were primarily in the first half of our study period suggests that a plateau may have indeed been reached. Freedman and colleagues found no decline in IADL limitation except in analysis based on the Medicare Current Beneficiary Survey (MCBS), which found a decline from 2000 to 2008. Additional analysis of the MCBS data showed that the decline was concentrated in the 85-and-over group, which is consistent with our findings regarding the decline in limitation in the 80-plus group. Overall, these comparisons highlight the sensitivity of trend results to period, specific measure, and sample, among other factors.
The significant decline in trouble hearing we found for both age groups is new and welcome. Previous analyses of NHIS and other data sources found either increases (Ries, using 1971 and 1990-91 NHIS data;15 Wallhagen et al., using Alameda County Study data from 1965 to 199416) or no trends (Freedman et al., using NHIS data from 1997 to 2004;17 Lee et al., using NHIS data from 1986 to 199518). Also welcome are the continued improvements in vision for the older group that have been reported elsewhere for previous periods.17 However, the increase in vision problems for both sexes and for females in the younger group is of concern.
To what extent are changes in education, smoking, and obesity associated with the trends that we found? Starting first with sensory limitations, there has been speculation that all the rock and roll enjoyed by the Baby Boom generation would be bad for hearing,19 but it is likely that the countervailing decline over time in occupational exposure to noise has been more important.20 Such an explanation would be consistent with the relatively large decline that we found for younger males, but the addition to the hearing model of education (which might be expected to be associated with occupation) did not substantially affect the trend. Interestingly, the sensitivity of the estimated trend in hearing to the addition of smoking to the model for younger males was greater and is consistent with the association of smoking with hearing loss that has been found elsewhere.21,22,23 It could be that smoking and occupation are correlated, but independent effects of smoking on hearing have been found by others.22 Indeed there may be a direct association of smoking and hearing through smoking’s effects on the blood vessels supporting the auditory system.24 For younger females, the sensitivity of the estimated trend in hearing to the addition of BMI to the hearing model (insignificant trend changing to significant decline in trouble hearing) may reflect BMI’s correlation with some other unobserved factor or the fact that markers of inflammation, which are more common among people who are obese, are associated with hearing loss.25 For the older group, the addition of education, smoking, and BMI to the hearing models had little effect.
For vision problems, the addition of education to the models for both sexes, females, and males in the older group resulted in substantially smaller estimated decline, indicating that the increase in educational attainment might be associated with the improvements in vision. The increase in trouble seeing for the 40-64 group was concentrated among females, but the statistical significance of the trend was eliminated when BMI was added to the models. Various studies have found associations between obesity and such eye diseases as cataract, diabetic retinopathy, and macular degeneration, but the evidence is not conclusive.26
The effects of increased obesity appear most striking for physical functional limitations for both age groups and for need for help with IADLs for the younger group; the statistical significance of upward trends is eliminated by adding BMI variables to these models. That obesity would especially be associated with physical functions such as climbing stairs and walking a quarter-mile, difficulty with which is much more prevalent than difficulty with ADLs, has face validity.
Smoking generally seems to have greater effects on trends in outcomes at younger ages, which is consistent with the greater change in smoking behavior in that group versus the older group over the study period. Of course, many of the health effects of smoking occur with a lag, so it may be some time before the consequences of reduced smoking are manifested at older ages. Mortality selection no doubt also plays a role in these patterns.
On the other hand, changes in educational attainment seem to play a relatively greater role at older than at younger ages. For older females and males separately, the statistical significance of the downward trend in IADLs is eliminated by the addition of education to the models. The same is true for both sexes taken together for ADLs at ages 65 and over. The important effects on late-life disability of large increases in educational attainment are well documented.3 Based on simple extrapolation into the future of the most recent educational attainment data by age (which no doubt underestimates future proportions at higher levels because of differential mortality), such increases are expected to continue for the next two decades for the 65-and-over group.6 It is more difficult to predict educational attainment for the 40-64 group, because education continues well into people’s twenties.
Our analysis of trends in the health conditions to which NHIS respondents attributed their limitations highlighted the importance of musculoskeletal conditions, especially for the younger group. Musculoskeletal conditions make the top condition lists for the older group as well, but especially for conditions said to be causing need for help with IADLs and ADLs, heart problem and hypertension are more prominent than all but arthritis/rheumatism. Also highly ranked for the older group reporting need for help with IADLs and ADLs are senility and stroke, both of which have relatively short mean durations. The increased roles of nervous system condition and depression/anxiety/emotional problem as causes for both physical functional limitations and for need for help with IADLs and ADLs are notable for the younger group. The decreased role of vision problems for the older group is consistent with our earlier finding of the decline in reports of trouble seeing, taken from elsewhere in the survey.
Weight problem makes the top condition list only for conditions causing difficulty with physical functional limitations for the 40-64 group. Of course, many of the other causes that were listed could be associated with obesity, but respondents were given opportunity to name multiple conditions. Moreover, it is important to remember that many people with limitations are not obese (e.g., in 2010, 52 percent of the 40-64 sample adults reporting need for help with IADLs or ADLs were not obese as opposed to 65 percent of all 40-64 sample adults). Obesity is clearly associated with limitation, but it does not imply limitation. For example, in 2010, less than 4 percent of people ages 40-64 with a BMI of 40 or greater reported needing help with ADLs. But these cross-sectional relations may change in the future if the health consequences of obesity change, for example, advantageously through improved management of obesity-related conditions or disadvantageously through longer lifetime exposure to obesity.
The disabling conditions reported by younger people were generally longer lasting, and the proportion of life that younger people spent with a disabling condition was considerably greater than for older people. However, it should be noted that these duration estimates are based on spells in progress whose observation has been censored by the survey. Although we did not have data on the duration of the limitations per se, but rather only the duration of the associated conditions, the pattern we found suggests that limitation for older people is of relatively more recent onset. The implications for younger people are unclear. Many of the younger population with these long-lasting conditions may have been able to function for some time without experiencing limitations related to their conditions or the limitations themselves may have lasted decades. We do not have the data to tell. Furthermore, research is needed to understand which factors allow people with potentially disabling conditions to avoid limitations. Presumably the needs and abilities of people who have been managing their conditions for many years are different from those who have only recently been diagnosed. We need to know more about these distinct abilities and needs in order to better inform policy development and program design.
The increase over time in duration of the longest-lasting condition for both age groups could be a function of many factors such as earlier onset, earlier diagnosis, or increased survival. A recent Institute of Medicine report suggested that more young people with conditions that previously might have been fatal are surviving and thus experiencing longer periods of limitation.27
The strengths of this study include that it examines a broad array of indicators of limitations (sensory and physical functions, IADLs, and ADLs), the working-age population as well as the older population, and the most recent national data. Limitations include the focus on self-reported data and the exclusion of the non-institutionalized population. However, previous studies have concluded that the exclusion of the institutionalized population does not alter substantive conclusions about trends.4,6
CONCLUSION
The continued increase in limitations among the 40-to-64-year-old population through 2010 is troubling, especially since its members represent the future older population. However, the rates of ADL and IADL disability for this younger population remain quite low, affecting fewer than four percent, and it remains to be seen the extent to which these trends reflect increased survival with early-onset disability. For physical function and IADL limitation, the rise in limitations is associated with the rise in BMI. Recent evidence suggests that the rate of growth of BMI is declining, and in some cases approaching zero. If this pattern continues and the relations between obesity and these types of limitation remain constant (a big assumption), our analyses imply that the prevalence of these limitations may stop their upward trends for the 40-to-64-year-old population. Nevertheless, the plateaus would be at substantially higher levels than in the past.
For the 65-and-older population, especially for the oldest old, ADL and IADL limitations have continued to fall. However, the decline has been concentrated in the first half of the period. Plus there has been a worrisome increase in physical functional limitation, an outcome closer to underlying physical capacity and less affected by social and physical environment than IADL and ADL limitations. This increased physical functional limitation may well be manifested in future increases in IADL and ADL limitation, if there are not countervailing changes in use of assistive technology and modification of the environment in which activities are carried out. Given the substantial effects of these limitations on labor market outcomes, well-being, and health care and other expenditures, population-level trends in disability must continue to be monitored closely.
Footnotes
An earlier version was presented at a May 17-18, 2012 interagency conference, sponsored by the Administration for Community Living, U.S. Department of Health and Human Services, National Institute on Aging at the National Institutes of Health, National Institute on Disability and Rehabilitation Research, U.S. Department of Education, and the Interagency Committee on Disability Research, and organized by the Center for Aging and Policy Studies at Syracuse University and the Michigan Center on the Demography of Aging at the University of Michigan.
Publisher's Disclaimer: This is a PDF file of an unedited manuscript that has been accepted for publication. As a service to our customers we are providing this early version of the manuscript. The manuscript will undergo copyediting, typesetting, and review of the resulting proof before it is published in its final citable form. Please note that during the production process errors may be discovered which could affect the content, and all legal disclaimers that apply to the journal pertain.
Contributor Information
Linda G. Martin, Email: lmartin@rand.org, RAND Corporation, 1200 S. Hayes St., Arlington, VA 22022, 703-413-1100, ext. 5465.
Robert F. Schoeni, University of Michigan
References
- 1.Manton KG, Gu X. Changes in the prevalence of chronic disability in the United States black and nonblack population above age 65 from one 1982 to 1999. Proceedings of the National Academy of Sciences USA. 2001;98(11):6354–6359. doi: 10.1073/pnas.111152298. [DOI] [PMC free article] [PubMed] [Google Scholar]
- 2.Freedman VA, Crimmins E, Schoeni RF, Spillman BC, Aykan H, Kramarow E, Land K, Lubitz J, Manton K, Martin LG, Shinberg D, Waidmann T. Resolving inconsistencies in trends in oldage disability: Report from a technical working group. Demography. 2004;41(3):417–441. doi: 10.1353/dem.2004.0022. [DOI] [PubMed] [Google Scholar]
- 3.Schoeni RF, Freedman VA, Martin LG. Why is late-life disability declining? Milbank Quarterly. 2008;86(1):47–87. doi: 10.1111/j.1468-0009.2007.00513.x. [DOI] [PMC free article] [PubMed] [Google Scholar]
- 4.Freedman VA, Spillman BC, Andreski PM, Cornman JC, Crimmins EM, Kramarow E, Lubitz J, Martin LG, Merkin SS, Schoeni RF, Seeman TE, Waidmann TA. Trends in late-life activity limitations: an update from 5 national surveys. Demography. 2013;50(2):661–671. doi: 10.1007/s13524-012-0167-z. [DOI] [PMC free article] [PubMed] [Google Scholar]
- 5.Martin LG, Freedman VA, Schoeni RF, Andreski PM. Trends in disability and related chronic conditions among people ages fifty to sixty-four. Health Affairs. 2010;29(4):725–731. doi: 10.1377/hlthaff.2008.0746. [DOI] [PMC free article] [PubMed] [Google Scholar]
- 6.Martin LG, Schoeni RF, Andreski PM. Trends in health of older adults in the United States: past, present, future. Demography. 2010;47(Supp):S17–S40. doi: 10.1353/dem.2010.0003. [DOI] [PMC free article] [PubMed] [Google Scholar]
- 7.Seeman TE, Merkin SS, Crimmins EM, Karlamangla AS. Disability trends among older Americans: National Health and Nutrition Examination Surveys, 1988-1994 and 1999-2004. American Journal of Public Health. 2010;100(1):100–107. doi: 10.2105/AJPH.2008.157388. [DOI] [PMC free article] [PubMed] [Google Scholar]
- 8.Nagi SZ. Some conceptual issues in disability and rehabilitation. In: Sussman MB, editor. Sociology and rehabilitation. Washington: American Sociological Association; 1965. pp. 100–113. [Google Scholar]
- 9.Pope AM, Tarlov AR, editors. Disability in America: toward a national agenda for prevention. Washington: National Academy Press; 1991. [Google Scholar]
- 10.Verbrugge LM, Jette AM. The disablement process. Social Science and Medicine. 1994;38(1):1–14. doi: 10.1016/0277-9536(94)90294-1. [DOI] [PubMed] [Google Scholar]
- 11.World Health Organization. Towards a common language for functioning, disability and health: ICF. 2002. [2012 Apr 20];2002 Available from http://www.who.int/classifications/icf/training/icfbeginnersguide.pdf.
- 12.Flegal KM, Carroll MD, Kit BK, Ogden CL. Prevalence of obesity and trends in the distribution of body mass index among U.S adults, 1999-2010. Journal of the American Medical Association. 2012;307(5):491–497. doi: 10.1001/jama.2012.39. [DOI] [PubMed] [Google Scholar]
- 13.Winship C, Mare RD. Regression models with ordinal variables. American Sociological Review. 1984;49:512–525. [Google Scholar]
- 14.Freedman VA, Martin LG. Understanding trends in functional limitations among older Americans. American Journal of Public Health. 1998;88:1457–1462. doi: 10.2105/ajph.88.10.1457. [DOI] [PMC free article] [PubMed] [Google Scholar]
- 15.Ries PW. Prevalence and characteristics of persons with hearing trouble: United States, 1990-91. Vital Health Statistic. 1994;10(188):1–75. [PubMed] [Google Scholar]
- 16.Wallhagen MI, Strawbridge WJ, Cohen RD, Kaplan GA. An increasing prevalence of hearing impairment and associated risk factors over three decades of the Alameda County Study. American Journal of Public Health. 1997;87(3):440–442. doi: 10.2105/ajph.87.3.440. [DOI] [PMC free article] [PubMed] [Google Scholar]
- 17.Freedman VA, Schoeni RF, Martin LG, Cornman JC. Chronic conditions and the decline in late-life disability. Demography. 2007;44(3):459–477. doi: 10.1353/dem.2007.0026. [DOI] [PubMed] [Google Scholar]
- 18.Lee DJ, Gómez-Marín O, Lam BL, Zheng DD. Trends in hearing impairment in United States adults: The National Health Interview Survey, 1986-1995. Journal of Gerontology: Medical Sciences. 2004;59A(11):1186–1190. doi: 10.1093/gerona/59.11.1186. [DOI] [PubMed] [Google Scholar]
- 19.Radcliffe D. Is hearing loss increasing at younger ages? Many think so, but it’s hard to prove. The Hearing Journal. 2000;53(5):23–29. [Google Scholar]
- 20.Zhan W, Cruickshanks KJ, Klein BEK, Klein R, Huang G, Pankow JS, Gangnon RE, Tweed TS. Generational differences in the prevalence of hearing impairment in older adults. American Journal of Epidemiology. 2010;171:260–266. doi: 10.1093/aje/kwp370. [DOI] [PMC free article] [PubMed] [Google Scholar]
- 21.Agrawal Y, Platz EA, Niparko JK. Prevalence of hearing loss and differences by demographic characteristics among U.S. adults: data from the National Health and Nutrition Examination Survey, 1999-2004. Archives of Internal Medicine. 2008;168(14):1522–30. doi: 10.1001/archinte.168.14.1522. [DOI] [PubMed] [Google Scholar]
- 22.Mizoue T, Miyamoto T, Shimizu T. Combined effect of smoking and occupational exposure to noise on hearing loss in steel factory workers. Occupational and Environmental Medicine. 2003;60:56–59. doi: 10.1136/oem.60.1.56. [DOI] [PMC free article] [PubMed] [Google Scholar]
- 23.Shargorodsky J, Curhan SG, Eavey R, Curhan GC. A prospective study of cardiovascular risk factors and incident hearing loss in men. Laryngoscope. 2010;120(9):1887–1891. doi: 10.1002/lary.21039. [DOI] [PMC free article] [PubMed] [Google Scholar]
- 24.Cruickshanks KJ, Klein R, Klein BEK, Wiley TL, Nondahl DM, Tweed TS. Cigarette smoking and hearing loss: the epidemiology of hearing loss study. Journal of the American Medical Association. 1998;279(21):1715–1719. doi: 10.1001/jama.279.21.1715. [DOI] [PubMed] [Google Scholar]
- 25.Verschuur CA, Dowell A, Syddall HE, Ntani G, Simmonds SJ, Baylis D, Gale CR, Walsh B, Cooper C, Lord JM, Sayer AA. Markers of inflammatory status are associated with hearing threshold in older people: findings from the Hertfordshire Ageing Study. Age and Ageing. 2010;414:92–97. doi: 10.1093/ageing/afr140. [DOI] [PubMed] [Google Scholar]
- 26.Cheung N, Wong TY. Obesity and eye diseases. Survey of Ophthalmology. 2007;52(2):180–195. doi: 10.1016/j.survophthal.2006.12.003. [DOI] [PMC free article] [PubMed] [Google Scholar]
- 27.Field MJ, Jette AM, editors. The future of disability in America. Washington, DC: The National Academies Press; 2007. [PubMed] [Google Scholar]