

Abstract
Efferocytosis, the process by which dying/dead cells are removed by phagocytosis, plays an important role in development, tissue homeostasis and innate immunity1. Efferocytosis is mediated, in part, by receptors that bind to exofacial phosphatidylserine (PS) on cells or cellular debris after loss of plasma membrane asymmetry. Here we show that a bacterial pathogen, Listeria monocytogenes (Lm), can exploit efferocytosis to promote cell-to-cell spread during infection. These bacteria can escape the phagosome in host cells using the pore-forming toxin Listeriolysin O (LLO) and two phospholipases C2. Expression of the cell surface protein ActA allows Lm to activate host actin regulatory factors and undergo actin-based motility in the cytosol, eventually leading to formation of actin-rich protrusions at the cell surface. We show that protrusion formation is associated with plasma membrane damage due to LLO’s pore-forming activity. LLO also promotes the release of bacteria-containing protrusions from the host cell, generating membrane-derived vesicles with exofacial PS. The PS-binding receptor TIM-4 contributes to efficient cell-to-cell spread by Lm in macrophages in vitro and growth of these bacteria is impaired in TIM-4−/− mice. Thus, Lm promotes its dissemination in a host by exploiting efferocytosis. Our study suggests that PS-targeted therapeutics may be useful in the fight against infections by Lm and other bacteria that utilize similar strategies of cell-to-cell spread during infection.
Results and Discussion
The intermediate stages of cell-to-cell spread by Lm remain unclear. Based on observations with an in vitro infection model, Theriot and colleagues suggested that bacteria-containing protrusions are released from infected cells, prior to uptake of membrane vesicles containing bacteria by neighboring cells3. However, the mechanisms that mediate protrusion release and uptake of bacteria in vesicles are not known.
LLO is required for Lm cell-to-cell spread in some cell types, including macrophages4,5. LLO is a pore-forming toxin that is often referred to as a “phagosome-specific lysin”6 because it has limited activity in the cytosol of host cells, due to its relatively low lytic activity7 and stability8 at neutral pH. Furthermore, LLO is degraded by the proteasome9. Despite these factors, it is now appreciated that LLO can damage the plasma membrane of host cells10. Host membrane repair pathways limit LLO-mediated membrane damage11, but the mechanisms by which they act remain unclear. LLO is essential for disruption of the outer membrane of spreading vacuoles4. Whether LLO contributes to other stages of cell-to-cell spread has not been tested.
We hypothesized that LLO-mediated damage to the plasma membrane may promote cell-to-cell spread. We used a propidium iodide (PI) assay to measure membrane damage induced during Lm infection (Fig. 1a). Repair of the plasma membrane is a Ca2+-dependent process12. Therefore, the absence of Ca2+ in the medium provided a convenient method to inactivate endogenous repair mechanisms and visualize the full extent of membrane damage. HeLa cells were used for these studies since phagosome escape by Lm does not require LLO in this cell type13.
Figure 1. Actin-based motility promotes LLO-mediated membrane damage.

A. Experimental design for membrane damage assay. B. Confocal images of HeLa cells infected as in A with wild type Lm at an MOI of 100. Scale bars,10 μm. Images representative of 3 independent experiments. C. Cells were infected as in A for the indicated time and PI+ cells were enumerated. Averages +/− s.d. for 3 independent experiments. Asterisks indicate significantly different from uninfected cells. P values calculated using two-tailed Student’s t test. D. Cells were infected with the indicated strain for 60 min. PI+ cells were enumerated. Averages +/− s.d. for 3 independent experiments. P values calculated using one-Way ANOVA. *P <0.05 **P <0.01 ***P <0.001.
In the absence of extracellular Ca2+, infection of cells with wild type bacteria revealed an increase in membrane damage compared to uninfected cells (Fig. 1b,c). The number of PI+ cells increased over time, indicating that membrane damage was an ongoing event during infection. Less damage was observed when Ca2+ was present in the extracellular medium, indicating Ca2+-dependent repair pathways limit plasma membrane damage.
Caspase 7 promotes membrane repair during Lm infection of macrophages11. Consistent with this, we found that siRNA-mediated knockdown of Caspase 7 increased membrane damage induced by Lm (Extended Data Fig. 1a,b). However, this effect was minor, indicating other factors contribute to membrane repair. Annexins also play a role in membrane repair14. We found that siRNA-mediated knockdown of Annexins 1,2 and 6 lead to an increase in membrane damage (Extended Data Fig. 1a,b). We conclude that multiple host factors contribute to repair of the plasma membrane during Lm infection.
LLO damages host membranes during infection10,11. Consistent with this, a mutant lacking LLO (Δhly) was impaired in membrane damage and complementation with hly restored membrane damage (Fig. 1d, Extended Data Fig. 2a). Deletion of both PLCs had no effect on membrane damage in Ca2+-free media. However, PLCs were required for membrane damage in Ca2+-containing media, suggesting they may promote LLO activity and/or inhibit membrane repair mechanisms. We observed a decrease in membrane damage in cells infected with ActA-deficient (ΔactA) bacteria. Treatment of cells with actin inhibitors latrunculin B or cytochalasin D had a similar effect (Extended Data Fig. 2b). Thus, actin-based motility may promote membrane damage by LLO by allowing close apposition of bacteria to the plasma membrane.
Membrane damage is associated with the loss of membrane asymmetry and redistribution of phosphatidylserine (PS) to the outer leaflet of the plasma membrane15. Therefore, to visualize membrane damage induced by Lm we stained cells with a probe (Annexin V-Alexa 488) to label exofacial PS. In uninfected cells, low amounts of exofacial PS was detected (Extended Data Fig. 3). In contrast, treatment of cells with saponin led to staining of cells with Annexin V-Alexa 488.
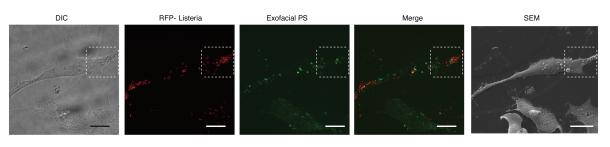
In cells infected by wild type bacteria, we observed the formation of PS+ structures at the cell surface (Fig. 2a, right panel; Extended Data Fig. 4). These structures colocalized with bacteria (visualized by red fluorescent protein (RFP) expression16) and were not associated with cellular blebbing, rounding, or nuclear condensation, indicating they were not the consequence of apoptosis. Extracellular bacteria did not label with Annexin V-Alexa 488 and bacteria present in PS+ structures were not accessible to anti-Lm antibodies (Extended Data Fig. 5). This suggested PS+ bacteria were present in a host-derived membrane structure. Correlative microscopy revealed that the PS+ structures were associated with the surface of infected cells (Fig. 2a, left panel). Formation of PS+ structures required LLO, consistent with a role for membrane damage in their formation (Fig. 2b,c). PS+ structures were also observed in Henle-407 cells and murine bone marrow-derived macrophages (BMDM)(Extended Data Fig.6).
Figure 2. Formation of PS+ structures during Lm infection.

A. HeLa cells were infected at an MOI of 100 with wild type Lm expressing RFP (red) for 6 h and then incubated with a probe for exofacial PS (Annexin V-Alexa 488; green). Cells were then fixed and analyzed by fluorescence microscopy to identify PS+ structures and Lm (right panel). Scanning electron microscopy of the same cell shows PS+ structures (left panel). Images representative of 2 independent experiments. Scale bars, 5 μm. B. Confocal images of cells infected with the indicated strain for 6 h. Boxed areas in left hand low mag image (a 3 color merge, includes phalloidin stain for F-actin) are enlarged to right. Arrows indicate Lm that colocalize with PS and arrowhead indicates PS+ filaments. Images representative of 3 independent experiments. Scale bars,10 μm for low mag merge, and 3 μm for enlarged panels. C. Cells containing PS+ bacteria enumerated for B. Averages +/− s.d. for 3 independent experiments. P values calculated using one-Way ANOVA. **P <0.01 ***P <0.001.
Several lines of evidence indicated that PS+ structures are associated with protrusion formation. First, we observed filamentous PS+ structures connected to bacteria that resembled protrusions (see arrowhead in Fig. 2b, upper panels). Second, ΔactA mutants did not form these structures (Fig. 2b,c). Third, we observed that the kinetics of formation of PS+ structures was similar to the kinetics of protrusion formation (marked by Ezrin17, Fig. 3a). Live cell imaging revealed that bacteria-containing protrusions (marked by LifeAct-RFP) rapidly recruited the exofacial PS probe, prior to rounding of the PS+ protrusion into vesicles on the cell surface (Fig. 3b, Supp. Video 1). Recruitment of the exofacial PS probe was limited to protrusions and vesicles, indicating loss of membrane asymmetry was not the result of global cellular membrane damage. Annexin 2 was localized to PS+ bacteria (Extended Data Fig. 1c), suggesting membrane repair pathways serve to locally restrict membrane damage.
Figure 3. Protrusions give rise to PS+ vesicles containing Lm.

A. PS+ bacteria and ezrin+ protrusions were enumerated in HeLa cells infected at an MOI of 100 with wild type Lm for the indicated time. Averages +/− s.d. for 3 independent experiments. B. Cells were transfected with LifeAct-RFP (F-actin probe) and then infected with wild type Lm expressing GFP for 6 h. Live infected cells were analyzed by spinning disk confocal microscopy with Annexin V-Alexa 647 in the medium to label exofacial PS (green). Successive frames are shown. Arrows indicates protrusion that acquires PS. Images representative of 4 independent experiments. Scale bar, 10 μm.
Streptolysin O, a pore-forming toxin from Group A Streptococcus, has been shown to induce membrane blebbing and release of plasma membrane-derived vesicles18,19. Our studies indicated that Lm similarly induces the release of membrane vesicles through LLO. PS+ structures containing bacteria were observed on coverslips with no connections to infected cells (Extended Data Fig. 7a). We also isolated these vesicles by centrifugation of the medium (Extended Data Fig. 7b). Our findings suggest bacteria-containing protrusions are released by infected host cells, giving rise to PS+ vesicles in the medium and, in some cases, these vesicles remain associated with the cell surface of infected cells. Deletion of both PLCs caused an increase in the number of PS+ structures associated with the surface of infected cells (Fig. 2b,c). Thus, PLCs may promote bacterial escape from PS+ structures after their release from infected cells and would be consistent with the role of PLCs in escape from vacuoles in secondarily infected cells4.
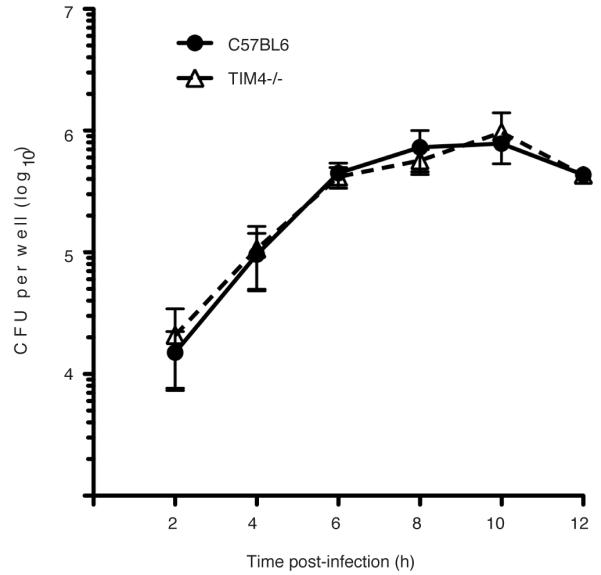
Efferocytosis receptors mediate uptake of PS+ cells and cellular debris1. In macrophages, TIM-4 plays a key role in efferocytosis20,21. Since macrophages are a major target of Lm during systemic infection we examined the role of TIM-4 in cell-to-cell spread by these bacteria using an infection focus assay. Foci of infection in BMDM from TIM-4−/− mice contained fewer infected cells compared to control BMDM from C57BL/6 mice (Fig. 4a,b). Using live cell imaging we observed that infection foci were smaller in BMDM cultures from TIM-4−/− mice from 8-18 h p.i. (Fig. 4c,d). Bacterial replication within primarily infected TIM-4−/− BMDM at low cell density (minimizing cell-to-cell spread) was comparable to that of control BMDM (Extended Data Fig. 8). This indicated that deficient bacterial spread in TIM-4−/− BMDM cultures was not due to impaired bacterial replication in the cytosol of these cells. Blocking antibodies that targeted either TIM-4 or PS impaired bacterial spread in cultures of control but not TIM-4−/− BMDM (Fig. 4b), indicating that TIM-4 promotes bacterial cell-to-cell spread through its ability to bind PS+ structures.
Figure 4. TIM-4 promotes Lm cell-to-cell spread in macrophages and growth in mice.

A. Infection focus assay for measuring cell-to-cell spread. BMDM were infected with Lm at an MOI of 0.01. Images representative of 3 independent experiments. Dotted lines delineate infection foci. Scale bars,100 μm. B. Infection foci from A were enumerated by fluorescence microscopy. A total of 100 infection foci were analyzed for each genotype/strain. Where indicated, cells were treated with anti-PS, anti-TIM-4 or non-specific rat IgG (control) during infection. Averages +/− s.d. for 3 independent experiments. P values calculated using two-way ANOVA with Bonferroni post test. C. Monolayers of control or TIM-4−/− BMDM were infected at an MOI of 0.01 with Lm expressing RFP and examined by live cell imaging. Images representative of 2 independent experiments. Dotted lines delineate infection foci. Scale bars,100 μm. D. The number of infected cells/focus for C. Averages +/− s.d. for 2 independent experiments. P values calculated using two-tailed Student’s t test. E. Cell-to-cell spread assay. Averages +/− s.d. for 3 independent experiments. P values calculated using two-tailed Student’s t test. F. Images from E. Arrows indicate actin+ protrusions associated with secondary cells. Images representative of 4 independent experiments. Scale bars,10 μm. G. Actin+ protrusions associated with secondary cells were enumerated. Averages +/− s.d. for 4 independent experiments. H, I. Mice were infected with 5 × 10⁴ CFU wild type (H) or 1 × 10⁷ CFU ΔactA mutant (I) Lm by tail vein injection. Mice were sacrificed and livers and spleen were harvested at 72 h p.i. for quantification of bacterial load (CFU/gram tissue). Data are expressed as Mean ± s.e.m.. P values calculated using one-tailed Mann Whitney test.
TIM-4 was previously shown to suppress pro-inflammatory cytokine production in vivo22. Therefore, we considered the possibility that TIM-4-deficiency impairs cell-to-cell spread by Lm indirectly, through enhanced pro-inflammatory cytokine production. However, in our in vitro experiments pro-inflammatory cytokine production was typically not observed until 18 h p.i. (after bacterial spread is initiated) and shared the same profile of expression in both control and TIM-4−/− BMDM cultures (Extended Data Fig. 9A). This suggested that TIM-4 acts in a cell autonomous manner to promote cell-to-cell spread by Lm.
To test this hypothesis, we used a cell-to-cell spread assay that measures the direct transmission of bacteria from primary infected cells to secondary cells (labeled with CellTracker™Blue). Primary cells were infected with a bacterial mutant lacking both PLCs (ΔplcAΔplcB) since this prevents bacterial escape from spreading vacuoles and avoids the confounding effect of rapid replication in the cytosol of secondary cells. Bacterial spread to secondary BMDM from TIM-4−/− mice was reduced compared to control mice (Fig. 4e). Microscopic analysis revealed higher numbers of actin+ protrusions associated with secondary BMDM from control mice compared to TIM-4−/− mice (Fig. 4f,g). This suggests that TIM-4 may promote association/stability of protrusions as they project from infected cells towards/into adjacent cells. Together, our findings indicate a specific role for TIM-4 in mediating cell-to-cell spread by L. monocytogenes.
We observed decreased numbers of bacteria in the liver and spleen of TIM-4−/− mice compared to control mice (Fig. 4h). Similar numbers of ΔactA mutant bacteria were observed in the liver of control and TIM-4−/− mice (Fig. 4i), indicating that TIM-4 is required for pathogenesis of motile bacteria in this organ and consistent with its role in promoting bacterial cell-to-cell spread. However, we observed a decrease in survival of ΔactA mutant bacteria in spleens of infected TIM-4−/− mice. We also observed elevated basal levels of pro-inflammatory cytokines in spleens (and to a lesser extent the livers) of TIM-4−/− mice prior to infection (Extended Data Fig. 9b). Together, our findings suggest that Lm exploits TIM-4 during systemic infection of mice by two mechanisms; directly, via uptake of PS+ bacteria, and indirectly through the ability of TIM-4 to suppress pro-inflammatory cytokine production.
Behar and colleagues demonstrated that TIM-4 mediates clearance of apoptotic macrophages bearing M. tuberculosis23. Their study indicates an important role for efferocytosis in innate immunity. In contrast, our findings suggest that efferocytosis can be exploited by Lm to promote cell-to-cell spread. Other mechanisms also contribute to Lm dissemination in a host24-26. Viruses are known to exploit efferocytosis by incorporating PS into their viral membrane27,28. Lm does not incorporate PS into its cellular wall but rather exploits host membrane repair mechanisms to promote release of protrusion-associated membrane, giving rise to a PS+ ‘cloak’ that can promote efferocytosis (see Model in Extended Data Fig. 10). Similar forms of non-lytic ejection of bacteria from host cells have been described for M. marinum29 and C. trachomatis30, indicating that these (and likely other) pathogens may also exploit efferocytosis during infection. In summary, our study identifies a novel strategy used by pathogenic bacteria to promote their dissemination in a host and provides a remarkable example of how pathogens can exploit innate immune defenses during infection.
Methods
Bacterial strains
Lm were grown in brain-heart infusion (BHI) broth and the following strains were used: wild type 10403S31, DP-L2161 (Δhly)32, DP-L4818 (Δhly + hly)33, DP-L3078 (ΔactA)34, and DP-L1936 (ΔplcA ΔplcB) 35. Wild type Lm 10403S expressing TagRFP under the actA promoter (DP-L5538)16 or expressing GFP under the hly promoter (DP-L1039) were previously described36.
Antibodies, Constructs, and Reagents
Primary antibodies used were rabbit anti-Annexin A2 (#610068 from BD Biosciences), rabbit anti-GFP (#A11120 from Invitrogen), rabbit anti-Caspase 7 (#12827 from Cell Signaling), rabbit anti-Listeria (#B223021 from BD Biosciences), rabbit anti-Lm antibody (from Dr. Pascale Cossart, Institut Pasteur, France), mouse anti-phosphatidylserine (#18005 from Abcam) and mouse anti-ezrin (#35-7300 from Invitrogen). Rat anti-TIM4 blocking antibody was previously described37. Alexa Fluor 568 Phalloidin, Annexin V-Alexa Fluor-488 and -647 conjugates and all fluorescent secondary antibodies (AlexaFluor conjugates) were from Invitrogen. DAPI (#D1306 from Invitrogen) was used at 1:2500 dilution to stain the nuclei where indicated. Cytochalasin D (#2502555; 10 μM final) and Latrunculin B (#428020; 10μg/mL final) were from Calbiochem. For transfection of HeLa cells, Xtreme Gene 9 (Roche) transfection reagent was used as per manufacturer’s protocols. LifeAct-mRFP38 was a gift from Dr. Ray Truant (McMaster University, Canada). The following siRNAs were from Sigma: Annexin A1 (#00157996), Annexin A2 (#00246294), Annexin A6 (#00063383), Caspase 7 (#00128361).
Cell Culture and Macrophage Generation
HeLa and Henle-407 cells were cultured in Dulbecco modified Eagle medium (Hyclone) supplemented with 10% heat-inactivated FBS (Wisent) without antibiotics at 37°C and 5% CO2.
All experimental protocols involving mice were approved by the Animal Care Committee of The Hospital for Sick Children. Mice were euthanized by cervical dislocation. Mouse bone marrow-derived macrophages (BMDMs) were obtained from the dissected femurs and tibias of 5-8 weeks old mice. Cells were washed with growth medium and plated on 70 cm2 petri dishes. Medium was replaced every 2 days and after 7-9 days cells were used for experiments. Cells were maintained in high glucose RPMI-1640 medium (Wisent) containing 10% heat-inactivated FBS (Wisent), 1% sodium pyruvate (Wisent), 1% non-essential amino acids (Wisent), 0.5% 2-mercaptoethanol (Gibco), 1% penicillin and streptomycin (Invitrogen), and 10% L929 medium. L929-medium was generated by growing a confluent layer of L929 cells in 175 cm2 flasks in DMEM supplemented with 10% heat-inactivated FBS. When cells reached confluency, growth medium was replaced by DMEM alone. After 7 days, supernatant was collected, centrifuged, filtered, and stored at −20°C.
Propidium Iodide Assay for Membrane Damage
HeLa cells were plated at 5×10⁴ cells per well in 24-well tissue culture plates ~18 h prior to infection. For siRNA treatments, the cells were plated at 2.5×10⁴ cells per well. siRNAs were applied after 18 h and the media was changed 24 h later. Infections were carried out 24 h later. All strains of Lm were infected at a multiplicity of infection (MOI) of 100. Bacteria were spun onto cells by centrifugation at 1500 rpm for 5 min. After 60 min of invasion at 37°C, cells were washed three times with phosphate buffered saline (PBS) with Calcium and Magnesium (Wisent #311-420-CL) followed by the addition of growth medium containing 50 μg/ml Gentamicin (Wisent #400-130-IG). At 6 h post infection, cells were washed two times with PBS without Calcium and Magnesium (Wisent #311-010-CL) and replaced with Tyrode’s Buffer (10 mM HEPES, 10 mM Glucose, 5 mM Potassium chloride, 140 mM Sodium chloride, 1 mM EGTA, 1 mM Magnesium chloride, 2 mM Calcium chloride, pH 7.4) containing 0.5 mg/mL Propidium iodide (PI, Sigma #P4170). For Tyrode’s Buffer lacking Calcium the 2 mM Calcium chloride was replaced with 2 mM Magnesium chloride. Cells were incubated in Tyrode’s Buffer with PI for the indicated times and then fixed with 4% PFA (EM Sciences #15710). Samples were mounted on slides using fluorescence mounting medium (Dako). Quantifications were done using a Leica DMIRE2 epifluorescence microscope equipped with a 40x objective.
Annexin V-Alexa 488 staining of exofacial PS
HeLa cells were plated at 5×10⁴ cells per well in 24-well tissue culture plates ~18 h prior to infection. All strains of Lm were infected at an MOI of 100 in DMEM. Bacteria were spun onto cells by centrifugation at 1500 rpm for 5 minutes. After 60 min of invasion at 37°C, cells were washed three times with phosphate buffered saline (PBS) with Calcium and Magnesium (Wisent #311-420-CL) followed by the addition of growth media containing 50 μg/ml Gentamicin (Wisent #400-130-IG). After indicated times of infection, cells were cooled on ice and washed twice with chilled PBS with Calcium and Magnesium. Annexin V Alexa Fluor 488 Conjugate (Invitrogen) was diluted to 1% (v/v) in chilled PBS with Calcium and Magnesium and added onto the coverslips for 10 min on ice. Cells were washed twice with chilled PBS with Calcium and Magnesium and fixed with 2.5% PFA (EM Sciences #15710) for 30 min at 37°C. Samples were mounted on slides using fluorescence mounting medium (Dako).
Immunofluorescence
Immunostaining was conducted as previously described39. Briefly, cells were permeabilized and blocked in PBS containing 0.2% saponin (Calbiochem) and 10% normal goat serum (SS-PBS) for 30 min. Subsequently cells were incubated for 1 h with primary antibodies in SS-PBS. Cells were washed three times with PBS and incubated with secondary AlexaFluor conjugated antibodies for 1 h. Cells were washed three times with PBS, mounted in fluorescence mounting medium (Dako), and analyzed using a Leica DMIRE2 epifluorescence microscope. Confocal pictures were taken using a Quorum spinning disk microscope (Leica DMIRE2 inverted fluorescence microscope equipped with a Hamamatsu back-thinned electron multiplying charge-coupled device camera, spinning disc head, and Volocity 4 software (Improvision). Confocal images were imported into Adobe Photoshop and assembled in Adobe Illustrator for labeling.
Correlative Light-Scanning Electron Microscopy
HeLa cells were plated at 5×10⁵ cells per well in 6-well tissue culture plates with etched grid coverslips with imprinted numbers (BELLCO Biotechnology) 24 h prior to infection. Cells were infected with wild type Lm expressing RFP (DPL5538) at an MOI of 100 in DMEM. Bacteria were spun onto cells by centrifugation at 1500 rpm for 5 min. After 60 min of invasion at 37°C, cells were washed three times with phosphate buffered saline (PBS) with Calcium and Magnesium (Wisent #311-420-CL) followed by the addition of growth media containing 50 μg/ml Gentamicin (Wisent #400-130-IG). At 6 h post infection, cells were cooled on ice and washed twice with chilled PBS with Calcium and Magnesium. Annexin V Alexa Fluor 488 Conjugate (Invitrogen) was diluted to 1% (v/v) in chilled PBS with Calcium and Magnesium and added onto the coverslips for 10 min on ice. Cells were washed twice with chilled PBS with Calcium and Magnesium and fixed with 2.5% PFA (EM Sciences #15710) for 30 min at 37°C. Coverslips were imaged by fluorescence microscopy in PBS with Calcium and Magnesium. Subsequently, samples were fixed in 2% glutaraldehyde in cacodylate buffer, rinsed in buffer and dehydrated in a graded ethanol series. The samples were critical point dried in a Bal-tec CPD030 critical point dryer, mounted on aluminum stubs, gold coated in a Denton Desk II sputter coater and examined in an FEI XL30 SEM.
Live cell imaging of PS+ structure formation
HeLa cells were plated at 2×10⁵ cells per well in 6-well tissue culture plates with glass coverslips 48 h prior to infection. At 24 h prior to infection, cells were transfected with LifeAct-RFP. Cells were then infected with wild type Lm expressing GFP (DP-L1039) at an MOI of 100 in DMEM. After 60 min of invasion at 37°C, cells were washed three times with phosphate buffered saline (PBS) with Calcium and Magnesium (Wisent #311-420-CL) followed by the addition of growth media containing 50 μg/ml Gentamicin (Wisent #400-130-IG). At 6 h post infection, coverslips were washed with PBS with Calcium and Magnesium (Wisent #311-420-CL) and transferred into spaceships and RPMI-1640 (Wisent #350-025-CL) with 10% heat-inactivated FBS (Wisent), 50 μg/ml Gentamicin, 2.5 mM CaCl2 and 2% (v/v) Annexin V Alexa Fluor 647 Conjugate (Invitrogen). HeLa cells were maintained at 37°C during imaging. A Leica DMIRE2 inverted fluorescence microscope equipped with a Hamamatsu Back-Thinned EM-CCD camera and spinning disk confocal scan head with a 63X objective and LSM 510 software was used. Volocity software (Improvision) was used to acquire images.
Animals
TIM-4−/− mice (on a C57BL/6 background) were previously characterized22 and bred in house at the Hospital for Sick Children Animal Care Facility. C57BL/6 mice, originally from The Jackson Laboratory (Bar Harbor, ME), were also bred in house and used as controls. All experiments were performed with 7-9 week old female mice that were maintained on a 12-hour light-dark cycle, with food and water available ad libitum. Sample size was chosen based on litter size and where possible 5 mice were used per experiment per group and per bacterial strain. Experiments were not blinded and mice were not randomized. All experiments described in this study were carried out in accordance with the Guide for the Humane Use and Care of Laboratory Animals and were approved by the Hospital for Sick Children’s Animal Care Committee (Toronto, ON, Canada).
Infection Focus Assay
After 7–10 days of differentiation, BMDMs were washed twice and detached with ice-cold Versene buffer (0.8 mM EDTA, 1 mM glucose in PBS−/−) for 20 min at 4°C. BMDMs were then seeded onto coverslips in 24-well tissue culture plates at 8.0 × 10⁵ cells/well to generate a monolayer. After 18 h, the monolayer was infected with wild type Lm at an MOI of 0.01 in RPMI-1640. At 30 min p.i., cells were washed three times with PBS and cultured in RPMI-1640 medium containing 10% FBS. At 60 min p.i., cells were washed three times with PBS and RPMI-1640 containing 10% FBS, 10% L929 conditioned medium, and 50 μg ml−1 gentamycin was added to the cultures. At 18 h p.i., cells were fixed with 2.5% paraformaldehyde for 30 min at 37°C and prepared for fluorescence microscopy. The number of infected cells per foci-of-infection was quantified using epifluorescence microscopy. Images for analysis were taken with a Hamamatsu Orca R2 camera and Nikon Ti-E microscope with 10X objective and Volocity software (Improvision).
Live cell imaging of Lm cell-to-cell spread
BMDMs were plated as a monolayer at 4×10⁶ cells/well onto coverslips in a 6-well tissue culture plate. After 24 h, the monolayer was infected with Lm expressing RFP (DP-L5538) at an MOI of 0.01 for 1 h. Cells were washed three times with PBS and incubated at 37°C in RPMI containing 10% FBS, 10% L-929 conditioned medium and 50 μg/mL gentamycin. At 6 h post infection, the coverslips were imaged in 25 mM Hepes buffered RPMI containing 10% FBS and 50 μg/mL gentamycin using a Quorum spinning disk confocal microscope (Leica DMIRE2 inverted fluorescence microscope equipped with a Hamamatsu back-thinned electron multiplying charge-coupled device camera, Yokogawa spinning disc head, and Volocity 6 software). Coverslips with BMDM from control and TIM4−/− mice were placed side by side on a dual chamber heated stage at 37°C. Over the course of 12 h, 36 μm z-stacks with a 2 μm step were taken every 15 min at ten foci of infection per coverslip. The channels for DIC and red fluorescence were acquired throughout the experiment. Image analysis was performed to measure the number of infected cells per infection foci during the course of the experiment.
Cell-to-Cell spread assay
BMDM from C57BL/6 mice were seeded at a density of 1 × 10⁶ in 10 cm2 petri dishes 16 h prior to experiments. Cultures of ΔplcAΔplcB mutant bacteria were used to infect BMDM at an MOI of 10. At 60 min p.i., cells were washed three times with PBS and RPMI medium containing 10% FBS and 50 μg/mL gentamycin was added to the cultures. At 3 h p.i., cells were detached using CellStripper (Mediatech) containing 50 μg/mL gentamycin and counted. 1 × 10⁵ infected cells were then overlaid onto fresh cultures of CellTracker Blue-labeled BMDM from C57BL/6 or TIM4−/− mice. At 90 min post overlay, cells were fixed with 2.5% paraformaldehyde for 30 min at 37°C and prepared for fluorescence microscopy. The uptake of bacteria from infected primary cells (unlabeled) to secondary cells (CellTracker Blue-labelled) was determined by microscopic analysis.
Labeling of secondary host cells with CellTracker Blue (Invitrogen) was performed as follows. Secondary cells were plated onto coverslips in 24-well tissue culture plates 1.5 ×10⁶ cells/well. At 2 h prior to overlay, serum-free RPMI medium containing 20 μM CellTracker Blue was added to the culture. After 30 min incubation, cells were washed three times with PBS and RPMI medium containing 10% FBS was added.
Macrophage Replication Assay
BMDMs were plated at 3×10⁵ cells per well in 24-well tissue culture plates 24 h prior to infection. Cells were then infected with Lm at an MOI of 1 in RPMI-1640. After 30 min of invasion at 37°C, cells were washed three times with phosphate-buffered saline (PBS) followed by the addition of RPMI-1640. At 60 min p.i., media was changed, and RPMI-1640 with 10% FBS containing 50 μg/ml gentamicin and 10% L929 was added. Cells were then lysed at 2, 4, 6, 8, 10, and 12 hr p.i. with 1% Triton X-100 in PBS. Serial dilutions of the lysates were plated on BHI-agar plates and incubated at 37°C for 16 h for subsequent quantification of intracellular CFUs.
Mouse Infection and Tissue Collection
Mice were infected with 5 × 10⁴ CFU wild type or 1 × 10⁷ CFU ΔactA mutant Lm (in 200 μl of PBS) via intravenous injection in the lateral tail vein. Liver and spleen were collected at 72 h post infection. Organs were placed in 1 ml of sterile PBS and homogenized. A dilution series was plated on BHI plates, grown overnight at 37°C and individual bacterial colonies were enumerated.
For cytokine analysis, cell culture supernatants and tissue homogenates were centrifuged (12,000 rpm for 12′) and supernatants were collected and stored at −80°C. Cytokines were measured using the mouse 7-plex pro-inflammatory kit from Meso Scale Discovery, according to manufacturer’s instructions.
Statistical Analysis
Statistical analyses were conducted using GraphPad Prismv4.0a. The average ± s.d. is shown in figures, and p values were calculated as described in figure legends. A p value of less than 0.05 was considered statistically significant and is denoted by *. p < 0.01 is denoted by ** and p < 0.001 by ***
Extended Data
Extended Data Figure 1. Annexins promote membrane repair during Lm infection.

A. HeLa cells were treated with the indicated siRNA for 48 h and then infected with wild type Lm at an MOI of 100. At 6 h p.i., medium was switched to Tyrodes buffer containing 0.5 mg/mL propidium iodide (PI) with or without calcium. Cells were fixed at 60 min after PI addition and then stained for bacteria and DNA (DAPI). PI+ cells were enumerated by microscopic analysis. Averages +/− s.d. for 3 independent experiments are shown. P values calculated using one-Way ANOVA. *P <0.05. B. Knockdown of gene expression by siRNA was confirmed by western blotting. Images representative of 2 independent experiments. C. Recruitment of Annexin A2 to PS+ structures containing bacteria. Boxes in low magnification image indicate areas enlarged in lower panels. Arrows indicate PS+ structures that colocalize with Annexin A2. Images representative of 3 independent experiments. Scale bars, 10 μm for low magnification images, 2 μm for enlarged regions of interest.
Extended Data Figure 2. Actin-based motility promotes LLO-mediated membrane damage during Lm infection.

A. HeLa cells were infected with the indicated Lm strain. At 6 h p.i., medium was switched to Tyrodes buffer containing 0.5 mg/mL propidium iodide (PI) with or without calcium. Cells were fixed at 60 min after PI addition and then stained for bacteria and DNA (DAPI). Confocal images representative of 3 independent experiments are shown. PI+ cells were enumerated and results are shown in Figure 1D. Where indicated, uninfected cells were treated with Saponin to permeabilize membranes and allow PI entry, serving as a positive control. Scale bars, 10 μm. B. HeLa cells were infected with wild type Lm and subjected to membrane damage assay as in A in the presence of either DMSO or the actin cytoskeleton inhibitors Latrunculin B or Cytochalasin D. Averages +/− s.d. for 3 independent experiments are shown. P values were calculated using two-tailed Student’s t test. *P <0.05.
Extended Data Figure 3. Annexin V-Alexa 488 as a probe to label PS.

Live HeLa cells were cooled on ice and stained with a fluorescent probe (Annexin V-Alexa 488) for 10 min to label exofacial PS. Cells were then fixed and stained with phalloidin Alexa 568 to visualize F-actin. In uninfected control experiments, low amounts of exofacial PS was detected in the membranes of cells, due to asymmetry of PS distribution in the plasma membrane. In contrast, treatment of cells with the pore-forming surfactant saponin led to robust staining of cells with Annexin V-Alexa 488. Images representative of 3 independent experiments. Scale bars, 10 μm.
Extended Data Figure 4. Formation of PS+ structures during Lm infection.
Low magnification images used to generate images shown in Figure 2a. HeLa cells were infected with wild type Lm expressing RFP for 6 h and then cooled on ice and stained with a fluorescent probe (Annexin V-Alexa 488) for 10 min to label exofacial PS. Cells were then fixed and analyzed by fluorescence microscopy to identify PS+ structures and bacteria. Scanning electron microscopy (SEM) of the same cell revealed that PS+ structures were associated with the dorsal surface of infected cells. Differential interference contrast (DIC) microscopy of cells was also performed to help identify cells for correlative imaging analysis. Images representative of 2 independent experiments. Scale bars, 20 μm.
Extended Data Figure 5. PS+ bacteria are present with a host-derived membrane structure.

A. HeLa cells were infected with wild type Lm expressing RFP for 8 h and then labeled with a probe for exofacial PS (Annexin V-Alexa 488). Cells were then rapidly stained with anti-Listeria antibodies (5 min) to label extracellular bacteria. Cells were then fixed and analyzed by fluorescence microscopy to identify PS+ structures and bacteria. Bacteria that colocalize with exofacial PS but are not labeled with anti-Listeria antibodies in the extracellular medium are indicated with arrows. Extracellular bacteria do not label with Annexin V-Alexa 488, indicating this probe does not bind non-specifically to bacteria. Box in low magnification image indicates area enlarged in lower panels. Images representative of 3 independent experiments. Scale bars, 10 μm for low magnification, 2 μm for high magnification. B. Cells were infected and stained as in A and analyzed by fluorescence microscopy. Bacteria that colocalize with exofacial PS were scored for their accessibility to anti-Listeria antibodies present in the extracellular medium. Data shows that the majority of PS+ bacteria are not accessible to anti-Listeria antibodies. Averages +/− s.d. for two independent experiments are shown.
Extended Data Figure 6. Formation of PS+ structures during Lm infection of epithelial cells and macrophages.

A. Henle-407 human intestinal epithelial cells were infected with wild type Lm for 6 h and then incubated with a probe for exofacial PS (Annexin V-Alexa 488; green). Cells were then fixed and stained with phalloidin to visualize F-actin (red) and for bacteria (blue). Cells were analyzed by fluorescence microscopy to identify PS+ structures and bacteria. Images representative of 3 independent experiments. B. Mouse bone marrow-derived macrophages (BMDM) from C57BL/6 mice were infected and stained as in A. Scale bars, 10 μm. Images representative of 3 independent experiments.
Extended Data Figure 7. Release of PS+ structures containing Lm from infected cells.

A. HeLa cells were infected with wild type Lm for 6 h and then incubated with a probe for exofacial PS (Annexin V-Alexa 488; green). Cells were then fixed and stained with phalloidin to visualize F-actin (red) and for bacteria (blue). Cells were analyzed by fluorescence microscopy to identify PS+ structures and bacteria. Inset shows PS+ bacteria that are not cell associated. Images representative of 3 independent experiments. B. HeLa cells were infected with ΔplcAΔplcB mutant bacteria for 6 h. The supernatant from the infected cultures was then removed and centrifuged onto poly-L-Lysine coated coverslips. Bacteria associated with coverslips were then stained with a probe for exofacial PS (Annexin V-Alexa 488; green). Cells were then fixed and stained for bacteria (blue). Coverslips were analyzed by fluorescence microscopy to identify PS+ bacteria. Inset shows PS+ bacteria. Scale bars, 10 μm for low magnification images, 2 μm for insets. Images representative of 3 independent experiments.
Extended Data Figure 8. Growth of Lm in the cytosol of TIM-4−/− macrophages is not impaired.
Gentamicin protection assay to measure intracellular bacterial growth. Bone marrow-derived macrophages were harvested from C57BL/6 or TIM-4−/− mice and seeded at a density of 3 ×10⁵ cells/well. Cells were then infected with wild type Lm in the presence of extracellular Gentamicin. At the indicated times, cell lysates were plated and intracellular bacterial numbers (CFU) were determined. Averages +/− s.d. for two independent experiments are shown.
Extended Data Figure 9. Cytokine measurements.

A. Measurement of cytokines following in vitro infection of bone marrow-derived macrophages from C57BL/6 or TIM4−/− mice with wild type Lm for the indicated time. Data from one of two independent experiments is shown. B. Measurement of basal cytokines in tissues of C57BL/6 or TIM4−/− mice without infection. Averages +/− s.d. for three independent experiments are shown. P values were calculated using one-Way ANOVA.
Extended Data Figure 10. Lm exploits efferocytosis to promote cell-to-cell spread during infection.

Model shows the steps that promote cell-to-cell spread by L. monocytogenes. 1. Protrusion formation via actin-based motility. 2. LLO-mediated damage to the plasma membrane leads to loss of membrane asymmetry and exofacial phosphatidylserine (PS) on protrusions. The exofacial exposure of PS promotes protrusion association with neighboring cells (right side). 3. Loss of membrane asymmetry and PS exposure extends along length of protrusions. 4. Calcium entry activates membrane repair pathways that promote scission of the protrusion. Bacteria are released from the cell in PS+ vesicles. 5. Macrophages mediate uptake of PS+ vesicles containing bacteria via the PS-binding receptor TIM-4. PS+ vesicles may be engulfed by neighboring cells either near the infected cell surface (left side) or within enclosed spaces that form as a result of protrusion penetration into the neighboring cell (right side). TIM-4 may also promote Lm infection indirectly, through its ability to suppress basal levels of pro-inflammatory cytokines as part of its homeostatic function in the immune system.
Supplementary Material
ACKNOWLEDGMENTS
We are grateful to Drs. S. Gray-Owen, S. Grinstein and D. Portnoy for providing reagents and advice and to D. Holmyard for help with electron microscopy. J.H.B holds the Pitblado Chair in Cell Biology. Infrastructure for the Brumell Laboratory was provided by a Leader’s Opportunity Fund grant from the Canadian Foundation for Innovation and the Ontario Innovation Trust. R.F. was supported by a postdoctoral fellowship from the Canadian Institutes of Health Research in partnership with the Canadian Association of Gastroenterology and the Crohn’s and Colitis Foundation of Canada. S. O. was supported by a postdoctoral fellowship from the Research Training Committee at the Hospital for Sick Children. This work was supported by an operating grant from The Arthritis Society of Canada (#RG11/013) to J.H.B and a United States Public Health Service grant (AI053669) from the National Institutes of Health to D.E.H..
Footnotes
ONLINE CONTENT Any additional Methods, Extended Data display items and Reagents are available in the online version of the paper; references unique to these sections appear only in the online paper.
AUTHOR CONTRIBUTIONS J.H.B., M.A.C., S.O. and D.E.H. designed the experiments and wrote the paper. M.A.C., R.F., J.V.R., V.A.C., and S.O. performed the experiments. A.M.M. and V.K.K. contributed reagents and consultations.
References
- 1.Ravichandran KS. Beginnings of a good apoptotic meal: the find-me and eat-me signaling pathways. Immunity. 2011;35:445–455. doi: 10.1016/j.immuni.2011.09.004. [DOI] [PMC free article] [PubMed] [Google Scholar]
- 2.Mostowy S, Cossart P. Virulence factors that modulate the cell biology of Listeria infection and the host response. Adv Immunol. 2012;113:19–32. doi: 10.1016/B978-0-12-394590-7.00007-5. [DOI] [PubMed] [Google Scholar]
- 3.Robbins JR, et al. Listeria monocytogenes exploits normal host cell processes to spread from cell to cell. J Cell Biol. 1999;146:1333–1350. doi: 10.1083/jcb.146.6.1333. [DOI] [PMC free article] [PubMed] [Google Scholar]
- 4.Alberti-Segui C, Goeden KR, Higgins DE. Differential function of Listeria monocytogenes listeriolysin O and phospholipases C in vacuolar dissolution following cell-to-cell spread. Cell Microbiol. 2007;9:179–195. doi: 10.1111/j.1462-5822.2006.00780.x. [DOI] [PubMed] [Google Scholar]
- 5.Gedde MM, Higgins DE, Tilney LG, Portnoy DA. Role of listeriolysin O in cell-to-cell spread of Listeria monocytogenes. Infect Immun. 2000;68:999–1003. doi: 10.1128/iai.68.2.999-1003.2000. [DOI] [PMC free article] [PubMed] [Google Scholar]
- 6.Schnupf P, Portnoy DA. Listeriolysin O: a phagosome-specific lysin. Microbes and infection / Institut Pasteur. 2007;9:1176–1187. doi: 10.1016/j.micinf.2007.05.005. doi:10.1016/j.micinf.2007.05.005. [DOI] [PubMed] [Google Scholar]
- 7.Glomski IJ, Gedde MM, Tsang AW, Swanson JA, Portnoy DA. The Listeria monocytogenes hemolysin has an acidic pH optimum to compartmentalize activity and prevent damage to infected host cells. J Cell Biol. 2002;156:1029–1038. doi: 10.1083/jcb.200201081. [DOI] [PMC free article] [PubMed] [Google Scholar]
- 8.Nomura T, et al. Irreversible loss of membrane-binding activity of Listeria-derived cytolysins in non-acidic conditions: a distinct difference from allied cytolysins produced by other Gram-positive bacteria. Microbiology. 2007;153:2250–2258. doi: 10.1099/mic.0.2007/005843-0. [DOI] [PubMed] [Google Scholar]
- 9.Schnupf P, Portnoy DA, Decatur AL. Phosphorylation, ubiquitination and degradation of listeriolysin O in mammalian cells: role of the PEST-like sequence. Cell Microbiol. 2006;8:353–364. doi: 10.1111/j.1462-5822.2005.00631.x. [DOI] [PubMed] [Google Scholar]
- 10.Hamon MA, Ribet D, Stavru F, Cossart P. Listeriolysin O: the Swiss army knife of Listeria. Trends in microbiology. 2012;20:360–368. doi: 10.1016/j.tim.2012.04.006. doi:10.1016/j.tim.2012.04.006. [DOI] [PubMed] [Google Scholar]
- 11.Cassidy SK, et al. Membrane damage during Listeria monocytogenes infection triggers a caspase-7 dependent cytoprotective response. PLoS pathogens. 2012;8:e1002628. doi: 10.1371/journal.ppat.1002628. doi:10.1371/journal.ppat.1002628. [DOI] [PMC free article] [PubMed] [Google Scholar]
- 12.Idone V, Tam C, Andrews NW. Two-way traffic on the road to plasma membrane repair. Trends Cell Biol. 2008;18:552–559. doi: 10.1016/j.tcb.2008.09.001. [DOI] [PMC free article] [PubMed] [Google Scholar]
- 13.Grundling A, Gonzalez MD, Higgins DE. Requirement of the Listeria monocytogenes broad-range phospholipase PC-PLC during infection of human epithelial cells. J Bacteriol. 2003;185:6295–6307. doi: 10.1128/JB.185.21.6295-6307.2003. [DOI] [PMC free article] [PubMed] [Google Scholar]
- 14.Draeger A, Monastyrskaya K, Babiychuk EB. Plasma membrane repair and cellular damage control: the annexin survival kit. Biochemical pharmacology. 2011;81:703–712. doi: 10.1016/j.bcp.2010.12.027. doi:10.1016/j.bcp.2010.12.027. [DOI] [PubMed] [Google Scholar]
- 15.Fadeel B, Xue D. The ins and outs of phospholipid asymmetry in the plasma membrane: roles in health and disease. Crit Rev Biochem Mol Biol. 2009;44:264–277. doi: 10.1080/10409230903193307. [DOI] [PMC free article] [PubMed] [Google Scholar]
- 16.Waite JC, et al. Dynamic imaging of the effector immune response to listeria infection in vivo. PLoS Pathog. 2011;7:e1001326. doi: 10.1371/journal.ppat.1001326. [DOI] [PMC free article] [PubMed] [Google Scholar]
- 17.Pust S, Morrison H, Wehland J, Sechi AS, Herrlich P. Listeria monocytogenes exploits ERM protein functions to efficiently spread from cell to cell. Embo J. 2005;24:1287–1300. doi: 10.1038/sj.emboj.7600595. [DOI] [PMC free article] [PubMed] [Google Scholar]
- 18.Babiychuk EB, Monastyrskaya K, Potez S, Draeger A. Blebbing confers resistance against cell lysis. Cell Death Differ. 2011;18:80–89. doi: 10.1038/cdd.2010.81. [DOI] [PMC free article] [PubMed] [Google Scholar]
- 19.Keyel PA, et al. Streptolysin O clearance through sequestration into blebs that bud passively from the plasma membrane. J Cell Sci. 2011;124:2414–2423. doi: 10.1242/jcs.076182. [DOI] [PMC free article] [PubMed] [Google Scholar]
- 20.Feng D, et al. Cellular internalization of exosomes occurs through phagocytosis. Traffic. 2010;11:675–687. doi: 10.1111/j.1600-0854.2010.01041.x. [DOI] [PubMed] [Google Scholar]
- 21.Miyanishi M, et al. Identification of Tim4 as a phosphatidylserine receptor. Nature. 2007;450:435–439. doi: 10.1038/nature06307. [DOI] [PubMed] [Google Scholar]
- 22.Rodriguez-Manzanet R, et al. T and B cell hyperactivity and autoimmunity associated with niche-specific defects in apoptotic body clearance in TIM-4-deficient mice. Proceedings of the National Academy of Sciences of the United States of America. 2010;107:8706–8711. doi: 10.1073/pnas.0910359107. doi:10.1073/pnas.0910359107. [DOI] [PMC free article] [PubMed] [Google Scholar]
- 23.Martin CJ, et al. Efferocytosis is an innate antibacterial mechanism. Cell host & microbe. 2012;12:289–300. doi: 10.1016/j.chom.2012.06.010. doi:10.1016/j.chom.2012.06.010. [DOI] [PMC free article] [PubMed] [Google Scholar]
- 24.Appelberg R, Leal IS. Mutants of Listeria monocytogenes defective in In vitro invasion and cell-to-cell spreading still invade and proliferate in hepatocytes of neutropenic mice. Infection and immunity. 2000;68:912–914. doi: 10.1128/iai.68.2.912-914.2000. [DOI] [PMC free article] [PubMed] [Google Scholar]
- 25.Drevets DA. Dissemination of Listeria monocytogenes by infected phagocytes. Infection and immunity. 1999;67:3512–3517. doi: 10.1128/iai.67.7.3512-3517.1999. [DOI] [PMC free article] [PubMed] [Google Scholar]
- 26.Friedrich N, Hagedorn M, Soldati-Favre D, Soldati T. Prison break: pathogens’ strategies to egress from host cells. Microbiology and molecular biology reviews : MMBR. 2012;76:707–720. doi: 10.1128/MMBR.00024-12. doi:10.1128/MMBR.00024-12. [DOI] [PMC free article] [PubMed] [Google Scholar]
- 27.Meertens L, et al. The TIM and TAM families of phosphatidylserine receptors mediate dengue virus entry. Cell Host Microbe. 2012;12:544–557. doi: 10.1016/j.chom.2012.08.009. [DOI] [PMC free article] [PubMed] [Google Scholar]
- 28.Mercer J, Helenius A. Vaccinia virus uses macropinocytosis and apoptotic mimicry to enter host cells. Science. 2008;320:531–535. doi: 10.1126/science.1155164. [DOI] [PubMed] [Google Scholar]
- 29.Hagedorn M, Rohde KH, Russell DG, Soldati T. Infection by tubercular mycobacteria is spread by nonlytic ejection from their amoeba hosts. Science. 2009;323:1729–1733. doi: 10.1126/science.1169381. [DOI] [PMC free article] [PubMed] [Google Scholar]
- 30.Hybiske K, Stephens RS. Mechanisms of host cell exit by the intracellular bacterium Chlamydia. Proc Natl Acad Sci U S A. 2007;104:11430–11435. doi: 10.1073/pnas.0703218104. [DOI] [PMC free article] [PubMed] [Google Scholar]
Methods References
- 31.Bishop DK, Hinrichs DJ. Adoptive transfer of immunity to Listeria monocytogenes. The influence of in vitro stimulation on lymphocyte subset requirements. J Immunol. 1987;139:2005–2009. [PubMed] [Google Scholar]
- 32.Jones S, Portnoy DA. Characterization of Listeria monocytogenes pathogenesis in a strain expressing perfringolysin O in place of listeriolysin O. Infection and immunity. 1994;62:5608–5613. doi: 10.1128/iai.62.12.5608-5613.1994. [DOI] [PMC free article] [PubMed] [Google Scholar]
- 33.Lauer P, Chow MY, Loessner MJ, Portnoy DA, Calendar R. Construction, characterization, and use of two Listeria monocytogenes site-specific phage integration vectors. Journal of bacteriology. 2002;184:4177–4186. doi: 10.1128/JB.184.15.4177-4186.2002. [DOI] [PMC free article] [PubMed] [Google Scholar]
- 34.Skoble J, Portnoy DA, Welch MD. Three regions within ActA promote Arp2/3 complex-mediated actin nucleation and Listeria monocytogenes motility. J Cell Biol. 2000;150:527–538. doi: 10.1083/jcb.150.3.527. [DOI] [PMC free article] [PubMed] [Google Scholar]
- 35.Smith GA, et al. The two distinct phospholipases C of Listeria monocytogenes have overlapping roles in escape from a vacuole and cell-to-cell spread. Infect Immun. 1995;63:4231–4237. doi: 10.1128/iai.63.11.4231-4237.1995. [DOI] [PMC free article] [PubMed] [Google Scholar]
- 36.Shen A, Higgins DE. The 5′ untranslated region-mediated enhancement of intracellular listeriolysin O production is required for Listeria monocytogenes pathogenicity. Molecular microbiology. 2005;57:1460–1473. doi: 10.1111/j.1365-2958.2005.04780.x. doi:10.1111/j.1365-2958.2005.04780.x. [DOI] [PubMed] [Google Scholar]
- 37.Rodriguez-Manzanet R, et al. TIM-4 expressed on APCs induces T cell expansion and survival. J Immunol. 2008;180:4706–4713. doi: 10.4049/jimmunol.180.7.4706. [DOI] [PMC free article] [PubMed] [Google Scholar]
- 38.Munsie LN, Caron N, Desmond CR, Truant R. Lifeact cannot visualize some forms of stress-induced twisted F-actin. Nat Methods. 2009;6:317. doi: 10.1038/nmeth0509-317. [DOI] [PubMed] [Google Scholar]
- 39.Brumell JH, Rosenberger CM, Gotto GT, Marcus SL, Finlay BB. SifA permits survival and replication of Salmonella typhimurium in murine macrophages. Cell Microbiol. 2001;3:75–84. doi: 10.1046/j.1462-5822.2001.00087.x. [DOI] [PubMed] [Google Scholar]
Associated Data
This section collects any data citations, data availability statements, or supplementary materials included in this article.