Abstract
While infrared upconversion imaging using halide nanoparticles are so common the search for a very efficient halide free upconverting phosphors is still lacking. In this article we report Gd2O2S:Yb/Er,YbHo,YbTm systems as a very efficient alternative phosphors that show upconversion efficiency comparable or even higher than existing halide phosphors. While the majority of rare earth dopants provide the necessary features for optical imaging, the paramagnetic Gd ion also contributes to the magnetic imaging,thereby resulting in a system with bimodal imaging features. Results from imaging of the nanoparticles together with aggregates of cultured cells have suggested that imaging of the particles in living animals may be possible. In vitro tests revealed no signficant toxicity because no cell death was observed when the nanoparticles were in the presence of growing cells in culture. Measurement of the magnetization of the phosphor shows that the particles are strongly magnetic, thus making them suitable as an MRI agent.
1. Introduction
With the tremendous developments in nanotechnology in recent years, fluorescence bioimaging has become an extremely demanding area in biophotonics. In all light based imaging and therapy, light is delivered to the target either directly or indirectly through carriers which are biocompatible drugs. In the case of direct light based imaging and therapy with high energy photons from X-RAY, gamma ray, etc. There are so many harmful effects.However, the indirect method based on infra red (IR) light offers several advantages such as low energy IR excitation,high penetration depth, local delivery, and low tissue damage. One of the most common imaging technologies widely used now is based on organic fluorophores and quantum dots (QDs). Short lived radioactive isotope labeling is also used in research, in human diagnostics and treatment. However, there are significant shortcomings with these current imaging agents: viz. photo bleaching and luminescence blinking in organic dyes and quantum dots, toxicity in quantum dots and radioactive materials, auto fluorescence with UV exciting dyes and quantum dots, low information density, and overall the high technology cost.
Essentially, all of these limitations can be eliminated with IR based trivalent rare earth (RE) ions doped upconversion phosphor (UCP)1 technology. Advantages of UCP are: (1) high signal to noise ratio; because of the biological transparent window in the 800-1200 nm region, tissues do not show fluorescence, thereby making the upconversion technology an excellent tool for background free images with high signal to noise ratio, (2) high penetration depth;because of the higher penetration depth of near IR radiation to tissues, in vivo imaging is possible, (3) high resolution and information density; the sharp level continuously tunable emission spectral features enable high information density and resolution as low as 10 nm, (4) low toxicity-compared to QD many of the UCPs are less toxic as revealed from their toxicity studies. The LD50 for RE oxides is on the order of 1000 mg/kg, while the LD50 value for many selenium oxides QDs are on the order of 1 mg/kg.2 (5) dual mode imaging-since many RE doped phosphors3-5 shows dwonconversion under NIR excitation, NIR to IR imaging is also possible, (6) low cost technology-in UCPs since the color tunability is achieved by the dopant compositions size tunability is not needed as in QD which makes this technology cheaper, and (7) UCPs can also be imaged in scanning electron microscopy (SEM) due to their cathodoluminescence so that it is possible to do both 2 and 3 photon imaging of nano phosphors in organisms and do ultra-high spatial resolution imaging using SEM.6 The other advantage is the extremely low power excitation needed for the upconversion processes in RE doped phosphors. For example, recently we invented a phosphor where the green upconversion could be seen by naked eyes even with 15 μW excitation.7 In UCPs the excitation intensities needed are 107 times less than the intensities needed for 2-photon excitation of typical organic dyes and are easily achievable using very low cost IR CW diode lasers. Another obvious advantage of UCPs is their photo stability under external conditions. Unlike organic fluorophores, UCPs do not photobleach and their emission intensities remain stable for years making them favorable for long term use.
Recently, there has been so much interest in both academy and industry on the IR activated upconversion phosphor technology (UPT) for several biophotonics applications such as advanced imaging, therapy and drug delivery.8-10 Though this technology has already been proposed for several biophotonics applications, it is still immature mainly due to the lack of a proper phosphor that satisfies several requirements viz. high efficiency, non toxicity, small size, low cost of production, biocompatibility with several functional groups, etc.
Optical imaging allows very sensitive localization of very small number of cells, even single cells, and allows clear visualization of the cells in relationship to their surrounding tissues. Especially because cells are able to internalize UCPs, it would even be possible for in vivo tracking. On the other hand, non-optical imaging, such as magnetic resonance imaging 11 can be used to a depth of tissue that is not currently possible with optical imaging. It too can be used down to the single cell level. Therefore, the ideal type of phosphor is one that can be used for both forms of imaging in the same experiment. Recently, Eu and Yb,Er doped GdVO4 luminomagnetic nanoparticles were studied as a candidate for biomedical imaging under UV excitation.12,13 Rare earth doped NaGdF4 has been suggested as a potential bimodal imaging phosphor by several researchers.14-21 Fan Zhang et.al22 proposed the idea of Fe3O4/SiO2/α-NaYF: Yb,Er mesoporous core-shell nanorattles as a possible material. However the inherent toxicity of vanadium 23 and all halide based nanoparticles make this as an unsafe material for long term biological use.
This paper discusses the studies of the use of IR activated Gd2O2S: Yb/Er ,YbHo,YbTm upconversion phosphor in bimodal imaging by utilizing the magnetic as well as the optical properties of the phosphor. The bimodal imaging features of the phosphor are achieved by the upconversion properties of the rare earth dopants as well as the magnetic properties of the Gd ion thus making this phosphor as a biomodal luminomagnetic phosphor. To the best of our knowledge, this is the first study reporting the use of rare earth doped Gd2O2S upconversion phosphor for in-vitro infrared bioimaging. In vitro studies were performed using mouse neural progenitor cells and the MDA-MB-231 human breast cancer cell line.
2.Experimental Section
2.1.Synthesis
A high temperature solid state flux fusion method7 was used for the phosphor synthesis. The starting materials are Gd2O3, Yb2O3, Er2O3, Ho2O3 (Sigma Aldrich, all 99.999%), S and flux Na2CO3, K3PO4 (Sigma Aldrich, 99.99%). Both S and Na2CO3 were 30 to 50 wt% and K3PO4 was 20 wt% of the total weight. The starting chemicals were thoroughly mixed using agate mortar and then heated in a muffle furnace at 1150 °C for 60 min. When the furnace was cooled down the samples were taken out and washed with distilled water 6 times and finally with a mild hydrochloric acid. The washed powder was subsequently dried and sieved.
2.2.Characterizations
X-ray powder diffraction is performed at 40 kV and 30 mA in the parallel beam method using a RIGAKU Altima IV X-ray diffractometer with Cu Kα. The morphology and particle size distribution of the samples was observed using a Hitachi S5500 field emission scanning transmission electron microscope (FE-STEM) operated at 30 kV in secondary electron mode. Elemental compositions were estimated by the energy dispersive x-ray analysis (EDAX) equipped with the FE-STEM. The UV-VIS-NIR absorption spectra of the powder samples were measured with a spectrophotometer(Cary, Model 14R).The upconversion spectra are recorded by the 1.25 m (SPEX) spectrometer using TiS laser (Spectra Physics,3900S) as the excitation source. For comparison all samples were equally weighed and packed in sample holder and excited with a power density of ~0.5 W/cm2. Quantum efficiencies of the green emission bands were measured by using a 15 cm diameter integrating sphere (Oriel 20451) coupled with a fluorescence spectrometer (Photon Technology International,NJ). For emission lifetime studies, the 980 nm output of a pulsed (5 ns) Nd: YAG pumped MOPO SL optical parametric oscillator (Spectra-Physics, Mountain View, CA) was employed as the pump source and a 0.5 m spectrometer (Acton Research spectrometer) equiped with 500 nm grating and PMT detector (Hamamatsu PMT model - R5108) were used to collect the signal. The decay transients were averaged and recorded using a TDS 220 digital oscilloscope (Tektronix, Beaverton, OR) 50 Ohm impedance. Magnetic properties were measured by superconducting quantum interference device (SQUID) in Magnet and Low Temperature Facility, MRC, at Northwestern University. The hysteresis loop of magnetization at room temperature with the magnetic field sweeping from −5 to 5 Tesla was recorded. Sample used for the measurement was weighed 50 mg.
2.3.Animal experiments
Penetration depth experiments were conducted at the biophotonics lab of UTSA by using pork muscle tissue. A 980 nm pen laser of maximum 100 mW (excitation power density ~0.17 W/cm2) was used for all experiments. Emission spectra are collected with an Ocean optics (USB 4000) fiber optics spectrometer and the images were photographed with a digital camera. The 800 nm emission from Gd2O2S: Yb/Tm was imaged with a Lieca microscope (Nikon SMZ-U) equipped with a NIR CCD camera (Hamamatzu C3077-79) and the images were collected and processed with HC image software.
2.4.Cell Culture Studies
To understand the nontoxicity and biocompatibility,cytotoxicity tests were conducted using three cell lines: mouse neural progenitor cells (NPCs), MDA-MB-231 and the human neuroblastoma SK-N-SH.24 NPCs were derived from mouse cells using the stromal cell derived factor method.25. NPCs were grown in N2 medium.26 SK-N-SH cell lines were maintained in DMEM with 10% fetal calf serum (FCS). Cells were maintained in an incubator at a temperature of 37 °C regulated with 5% CO2, 95% air and saturated humidity.
Cytotoxicity testing at high concentrations of UCPs (Gd2O2S: Yb/Er, Gd2O2S: YbHo, and NaYF4: Yb/Er) was performed as follows. UCPs were suspended in medium and incubated with cells at 100 μg/ml and 1000 μg/ml for 24 hours or for up to 72 hours. Images were obtained using an Axiovert 200 M Inverted Fluorescence Microscope.
Cell viability in the presence or absence of UCPs was assessed by the MTT (3-[4,5-dimethylthiazol-2-yl]-2,5 diphenyl tetrazolium bromide] colorimetric assay, based on the cellular reduction of tetrazolium salt MTT (Sigma, USA) by the mitochondrial dehydrogenase of viable cells which results in the formation of blue formazan product. In brief, SK-N-Sh cells were plated in a 96-well tissue culture plate (Falcon, USA) at a concentration of 20,000 cells/well in DMEM-10% FCS. Next day the medium was removed, and phosphors suspended in DMEM-10% FCS at different concentrations − 50 ug/ml, 100ug/ml and 200 ug/ml, were added in triplicate wells of the SK-N-SH cells in the plate. Control wells had only medium without phosphor particles. After incubation for 48 hours, the medium from all wells is removed and replaced with 10 ul MTT dissolved in PBS (concentration 5mg/ml) + 100 ul medium, and the plate incubated for 4 hours at 37 C. The blue formazan product formed was dissolved by addition of equal volumes of 10% SDS: 0.01N HCl solution per well overnight with gentle rocking. Optical density was measured using an ELISA plate reader at wavelength 570 nm. Statistical analysis was done using a one-way ANOVA, followed by Dunnett’s multiple comparisons test. The level of significance was set at p,0.05. All statistical analysis were done using the Instat software.
Imaging of Cell Aggregates with UCPs: MDA-Mb-231 cells were incubated with UCPs (Gd2O2S:Yb/Er, Gd2O2S:YbHo, and NaYF4:Yb/Er) in medium containing UCP at 200, 200, and 60 μg/ml, respectively, for 24 hours. Trypsinized cells together with UCPs were then incubated in medium in dishes coated with Pluronic F68 which prevents cell attachment.27 After 24 hours, aggregates of cells and UCPs had formed and were used for subsequent imaging. For imaging, aggregates were placed in a glass capillary in medium and photographed under illumination with a 980 nm 40 mW diode laser. Photographs were obtained using a digital camera.
All animal and cell experiments are done following the standard protocols with permission obtained from the relevant national or local authorities.
2.4.Magnetic resonance experiments
Experiments were performed on a 7T Pharmscan MR scanner (Bruker, Billerica, MA, USA). A quadrature volume coil (61 mm in diameter) was used for both RF transmission and reception. Diluted Gd2O2S: Yb/Er (0.0038, 0.0076, 0.015, 0.03, 0.038 mg/ml) in deionized water was placed in 5 ml tubes for imaging. T1-weighted images were obtained with a FALSH sequence. Imaging parameters were as follows. Field-of-view (FOV) = 5 × 5 cm, matrix size = 128 × 128, slice thickness = 1.5 mm, repetition time (TR) = 400 ms, echo time = 4 ms.
Relaxivity (T1 value) was measured using a RAREVTR sequence. Eight TR (150, 300, 400, 500, 700, 1000, 2000, and 5000 ms) were used and TE = 8.3 ms. Other parameters were identical to the T1-weighted imaging. The data were collected and analysis using Bruker ParaVision 5.1 software. The MR signal intensity of the samples was ascertained by the average intensity in the defined region of interests (ROIs). T1 value of each sample was calculated by fitting M (t) = M0 [1-C × exp (−TR/T1)], where M (t) is the signal intensity at a particular TR, M0 is the equilibrium signal and C is a factor to account for incomplete inversion. The determined T1 values were plotted as R1 (1/T1) vs. concentration of Gd2O2S: Yb/Er.
3.Results and discussions
3.1 Phase and morphology
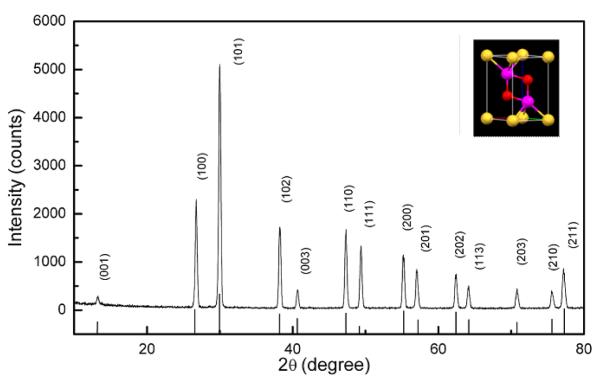
A typical XRD pattern obtained for the Gd2O2S: Yb/Er was shown in Figure 1 in comparison with standard powder peak positions of Gd2O2S hexagonal phase (JCPDS Card No.26-1422). The XRD results reveal that the well-crystallized Gd2O2S: Yb, Er sample is in hexagonal Gd2O2S structure with cell parameters a = b = 0.3852 nm, c = 0.6567 nm. Crystal structure of Gd2O2S is shown in the inset of Figure 1. The symmetry is trigonal and the space group is . There is one formula unit per unit cell. The structure is very closely related to the A-type rare-earth oxide structure, the difference being that one of the three oxygen sites is occupied by a sulfur atom. Atom positions in Gd2O2S using lattice vector units are ± (1/3, 2/3, u) for two metal atoms with u~0.28, ± (1/3, 2/3, v) for two oxygen atoms with v~0.63, and (0, 0, 0) for a sulfur atom. Each metal atom seems to be bonded to four oxygen atoms and three sulfur atoms to form a seven coordinated geometry with the oxygen and the metal in the same plane.
Figure 1.
XRD pattern of the Gd2O2S: Yb/Er sample. Vertical lines show the standard peak positions of the Gd2O2S (JCPD File No 26-1422). The inset shows crystal structure of Gd2O2S indicating the locations of Gd (Pink), O (Red) and S (Yellow) atoms.
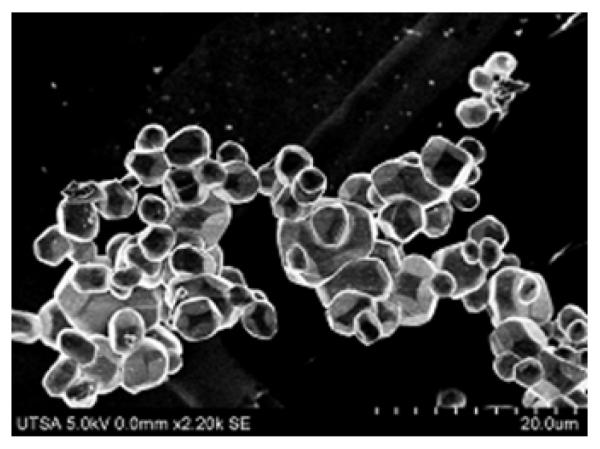
A typical SEM micrograph of the sample is shown in Figure 2. SEM micrographs obtained from different locations show that the material mostly crystallized in hexagonal shape with mean particle size of 4 μm obtained from the size distribution shown in Figure S1 of Supporting information (SI). Analysis of the elemental composition by EDS (Figure S2.SI) shows the wt % of various elements inside the composition of Gd2O2S: Yb (2), Er (1) as Gd = 42.5%, Yb = 2.53 %, Er =1.05 % and S = 7.46 % which is in good agreement with the starting composition : Gd = 42.2 %, Yb = 2.3 % and Er = 0.74 %. The S content in the final composition is found to be less than the starting composition 22.62 % and is due to the excess oxidation rate of elemental sulfur during the firing process.
Figure 2.
SEM micrograph of the Gd2O2S: Yb/Er phosphor powder prepared by the flux fusion method.
3.2 Spectroscopy
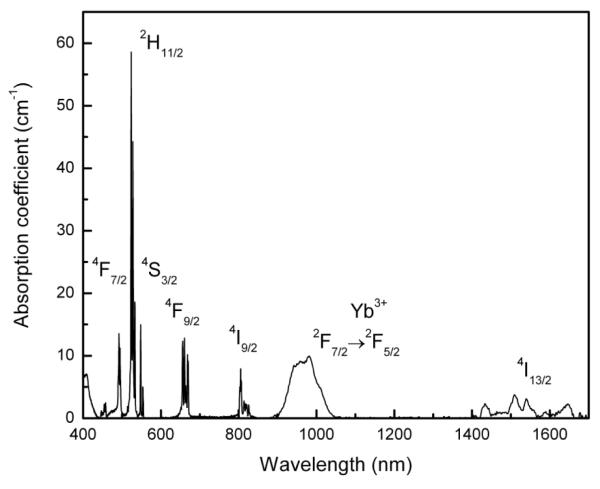
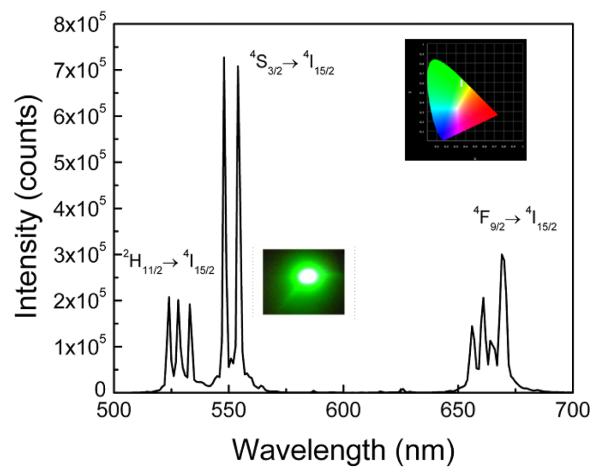
The room temperature UV-VIS-NIR absorption spectra of the sample given in Fig. 3 consists of several well resolved absorption bands with their spectral width and band positions comparable with standard Yb3+/Er3+ spectrum. The absorption bands of Er3+ ion corresponds to transitions from the 4I15/2 ground state to the various excited levels as shown in the spectrum. Figure 4 shows a 980 nm excited upconversion in G2O2S: Yb (8), Er (1). Emission spectrum in the 500-700 nm is characterized by an intense green band followed by a weaker red band. The green emission band which is due to the transition shows several Stark components at 524, 527, 533, 548 and 554 nm nm with the most intense being the 548 nm emission which arises from the 4S3/2 → 4I15/2 transition. The red emission which is due to 4F9/2 → 4I15/2 transition shows Stark levels at 655, 661, 663 and 669 nm. As usual, all samples show strong green and a comparatively weak red emissions. The fluorescence branching ratios of the green and red upconversion bands are 60 % and 37.3 %, respectively. Since the intensity of green emission is nearly 2.4 times higher than that of red emission, the samples glow with intense green emission. The upconversion in these samples are so intense that even with <15 μW excitation the emission can be seen with naked eyes. Furthermore, the emission could be recorded with 700 μW of excitation power. Because of the extreme brightness of the emission, approximately excitation power of 20 mW was used in all emission experiments. The inset of Figure 4 shows a photograph of the green upconversion emission at 980 nm excitation with 20 mW of power.The inset on the top shows the CIE color map where the emission color coordinates obatined (0.362,0.544) are marked by a an arrow.
Figure 3.
UV-VIS-NIR absorption spectrum of Gd2O2S:Yb(8) Er(1) with all observed spectral transitions.
Figure 4.
Upconversion emission spectrum of Gd2O2S; Yb (8) Er (1) phosphor under 980 nm laser excitation. Inset shows the green emission at 980 nm excitation with 20 mW of power and the corresponding CIE color coordinate diagram representing the emission color indicated by white arrow.
In Figure 5a, a photograph of the multicolor emission phosphors from various dopant compositions was shown along with the corresponding emission in a transparent suspension made with de ionized water at a concentration of 1mg/3ml. By suitably selecting the dopant scheme as well as the compositions and the host it is possible to tune the color over a wide range as observed in the case of other halide based upconverting phosphors.28-36 Further, as shown in the SI S3, the emission intensity is independent of the pH of the medium over a wide range. A normalized emission spectrum of the selected phosphor compositions was shown in Figure 5b along with the Yb3+ absorption band in oxysulphide phosphor. Another interesting feature of the oxysulphide phosphor is the power dependent color tuning features which is explained in more detail in our previous publications 37[Figure S4 SI].
Figure 5(a).
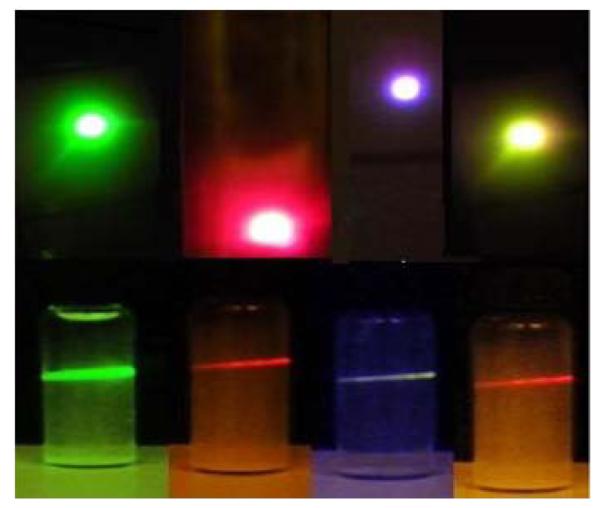
Photograph of the upconversion emission in oxysulphide phosphors (top) and their colloids in de ionized water (bottom) at a concentration of 1mg/3ml. (a) Gd2O2S:Yb (8) Er (1), (b) La2O2S:Yb (3) Er (7) observed through red filter, (c) Gd2O2S:Yb (2) Tm (1), (d) La2O2S:Yb (9) Er (1)
Figure 5(b).
Normalized upconversion emission spectrum of YbTm, YbHo, Yb/Er and YbTm in Gd2O2S.The 980 nm absorption peak of Yb3+ is shown on the extreme right.
The upconversion process in Yb/Er system is well understood in several materials 38,39 and a more detailed explanation of the processes based on multiphoton absorption and energy transfer are explained in detail in our previous publications 7,37 (see Figure S5 of SI for the relevant energy levels indicating the excitation and de excitation process, Figure S6 of SI for the two photon absorption process). The fact that the material shows intense upconversion under low power excitation shows that the efficiency of upconversion in this material is significantly high. Further, under high power excitation the material shows almost linear or saturation in intensity which is probably due to the excitation population saturation at high excitation power.
To understand the functional dependence of the red and green emission intensity on the Yb concentrations, two sets of samples were prepared. In the first set, the Yb: Er concentration was kept fixed at 10 mol% by proportionally changing Yb and Er concentrations. In the second set, the Yb concentration was varied from 0 to 9 mol% by keeping the Er concentration constant at 1mol%. Based on the results of observations (Figure S7 SI), in the case of samples with constant Er concentration, both green and red emissions show that the intensity tends to increase up to a concentration of 8 mol% of Yb. However, for varying Er concentration, both red and green emissions peaked at 5 mol% of Yb and Er. Irrespective of the compositions, in all samples the green emission is much stronger than the red emission. The intensity of green emission is 2.4 times higher than that of the red emission in samples with 8 mol% of Yb and 1mol% Er and this composition was used for further imaging experiments.
In order to quantify the green emission in Gd2O2S, we measured the quantum efficiency of the green emission in the Gd2O2S phosphor following the standard integrating sphere procedure 40 [See experimental setup in Figure S8 and S9 of SI] in comparison with the well known green upconversion phosphor NaYF4: Yb (20) Er (2). Figure S10 of SI shows the emission intensity comparison under identical measurements conditions. Using the proposed procedure we measured the green upconversion efficiency to be 0.25 % in Gd2O2S:Yb(9) Er(1) and 0.054 % in NaYF4:Yb(20) Er(2) which shows that the present phosphor is 5 times more efficient than NaYF4: Yb/Er which is considered to be the brightest upconversion phosphor thus far.41,42
The fluorescence decay times of the green and red emission bands were obtained from the time resolved emission spectroscopy measurements and the decay curves obtained for the 550 and 670 nm emission bands in Gd2O2S: Yb (8) Er (1) was shown in Figure S12 of SI.The decay curve was fitted with a multiexponential function , where A1 and A2 are the fitting parameters and τ1 and τ2 are the fluorescence decay times. With the fitting parameters of A1= 0.61, A2 = 0.37 and decay times of τ1 = 15.36 μs and τ2 = 55.12 μs and average decay time of 42.6 μs was obtained for the green emission. Similarly the fitting parameters for red band were A1= 0.53, A2 = 0.53 and decay times of τ1 = 11.8 μs and τ2 = 118.5 μs and average decay time 108.8 μs. The decay time of the green and red emission bands depends on the concentrations of the Yb and Er in the phosphor and a more detailed analysis is underway. In time gated fluorescence based biomaging,43 longer decay time is a favorable factor to discriminate the noises arising from scattered light and autofluorescence.
3.3. Magnetic properties
We investigated the magnetic properties of the phosphor using a superconducting quantum interference device (SQUID) magnetometer and the room temperature magnetization curve is shown in Figure 6a. From the nature of the curve it is clear that the Gd2O2S: Yb/Er exhibit magnetic properties which is due to the presence of the paramagnetic ion Gd3+ that has larger number of unpaired electrons in the outer orbital. Additional Zero field cooling (ZFC)-field cooling (FC) studies (Figure S13 SI) also support this conclusion. Magnetic moment per particle has been calculated by fitting the magnetization curve with the Lanevin function44 and the moment per particle is found to be 1401 μB. To evaluate the magnetic tracking features of the Gd2O2S, we have observed the magnetic behavior of this phosphor under a permanent magnet both in powder form and in suspension. It is seen that the powder rapidly attracted to the magnet when a permanent magnet of field strength ~0.1T was placed near the lid as shown in the photograph (inset of Figure 6a).To explore the magnetic behavior in liquid the phosphor was well dispersed in deionized water at a concentration of 30 mg in a quartz cuvette and a permanent magnet of 0.1T was placed on one side. Photographs were taken at regular intervals starting from initial colloidal suspension (0 min) to 30 min later with a logo on the other side of the cuvette to observe the transparency as well as the magnetic feature of the particle. Initially the suspension was fully opaque with no little visibility of the logo (Figure 6b-i). When the magnet was placed on the other side the particles start attracted towards the other side of the cuvette where the magnet was placed. At the end of 30 min (Figure 5b-iii, iv, v,vi), it is clearly seen that most of the particles moved towards the wall containing the magnet making the solution transparent with the background logo being completely visible. Photos taken from the other side of the cuvete clearly show the circular pattern of the phosphor deposited on the other side of the cuvette where the magnet was located (Figure 6b-v). Excitation with the 980 nm laser also shows brighter emission from this location whereas there is very little emission from the rest of the transparent solution (Figure 6b-iii, iv).These observations show that the synthesized Gd2O2S phosphor possess magnetic tracking features to be utilized in magnetic imaging experiments.
Figure 6(a).
Magnetization curve of Gd2O2S: Yb/Er upconversion phosphor.The straight line shows the Langevin fit. Inset shows the phosphor powder attracted to the tip of the magnet.
Figure 6 (b).
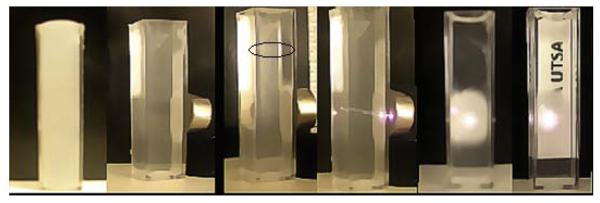
Magnetic properties of the Gd2O2S:Yb/Er phosphor in deionized water (i) original colloidal suspension with no transparency, (ii) suspension with magnet (0.2 T) on one side 10 min later, (iii) suspension after 30 min. The circled part shows very faint green emission under 980 nm indicating very few particles at the upper end, (iv) 980 nm laser hitting the phosphor layer near the magnet indicating stronger green emission, (v) front view of the back side of the cuvette after all phosphors have been attracted by the magnet, (vi) logo seen through the upper end transparent part of the suspension
3.4. Animal experiments
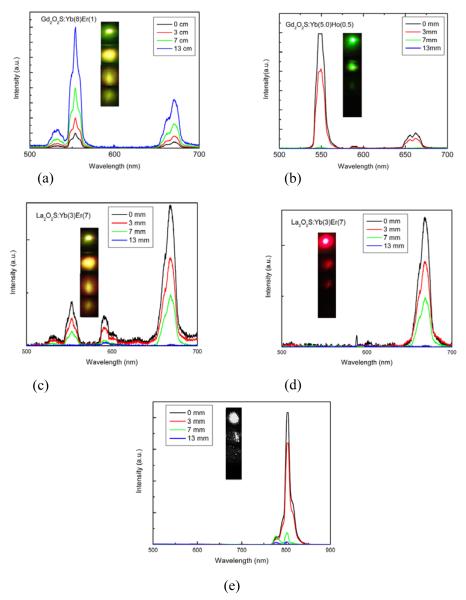
The purpose of these experiments is to explore the usefulness of the proposed material for imaging under infrared excitation. Preliminary proof of concept experiments were done by putting the Gd2O2S: Yb (8) Er (1) phosphor under pig skin of varying thickness ranging from a 0.3 mm to 1.25 cm. Both emission spectra and images collected under different thickness are shown in Figure 7a. Results show that as the thickness increases the green upconversion signal attenuates . In an effort to make the signal even stronger, we synthesized Gd2O2S doped with Yb and Ho and performed the depth penetration experiments. Comparison of the emission intensity of Gd2O2S: Yb/Er vs. Gd2O2S: Yb/Ho shows that the green emission intensity in YbHo phosphor is 2 times more intense (Figure S13 SI) than in Yb/Er under identical measurement conditions which makes this material even more attractive than Yb/Er phosphor in imaging. This was again verified by the imaging experiments with pig skin of different thicknesses as shown in Figure 7b. Observation of the fluorescence intensity clearly demonstrates that Gd2O2S: Yb/Ho is a better candidate for 980 nm to green upconversion imaging.
Figure 7.
Penetration depth experiments done with different upconversion phosphors on pork muscle tissue. (a) Gd2O2S:Yb (8) Er (1), (b) Gd2O2S:Yb (5) Ho (0.5), (c) La2O2S:Yb (3) Er (7) without red filter, (d) La2O2S:Yb (3) Er (7) with red filter, (e) Gd2O2S:Yb (2) Tm (2).The inset of each emission spectrum shows the digital images of the emission for the respective thickness. In Figure (e) the monochrome digital images are collected with NIR CCD camera.
It is well known that most of the biological tissues have high attenuation in the UV-VIS region compared to the NIR.45,46 The absorption spectrum of the pig skin under investigation was shown in Figure S14 of SI and according to this the attenuation is highest in the 550 nm region and lowest in the red and NIR region which makes red and NIR emissive phosphor as the most favorable candidate for upconversion imaging. The penetration depth at 550 nm is less than 1 cm whereas at 650 nm it is near 40 cm and nearly 9 cm at 800 nm making red as the most favorable emission wavelength for tissue imaging. Previous observations by Wang et.al 47 show the possibility of using KMnF3: Yb/Er upconversion red phosphor as a potential candidate for single color imaging. We are in the process of exploring a safer halide free phosphor for single red color imaging and based on our detailed studies done over 48 different Yb/Er compositions in Gd2O2S,Y2O2S and La2O2S; the conclusion is that the intensity ratio of green to red can be varied over a wide range by changing the metal as well as the dopant ratios. In La2O2S: Yb (3) Er (7) (Figure 7c) the red emission intensity is higher than green and the resulting emission color is yellow. Imaging done with a red color filter shows intense red emission with greatest color contrast and intensity (Figure 7d). We did some preliminary observations with the Gd2O2S:Yb/Tm, a potential emitter at the 800 nm region, and the results of penetration depth experiments are summarized in Figure 6c along with photograph of the NIR images collected with an NIR CCD camera. Comparison of these experimental results shows that though Gd2O2S: Yb/Ho can be utilized in bimodal imaging the high attenuation of the green emission suppress image contrast. On the other hand, La2O2S: Yb/Er is a more favorable candidate for high contrast red imaging. By fractionally replacing La with Gd ion would be possible to enable this phosphor for magnetic imaging also.
3.5. Cell Culture Studies
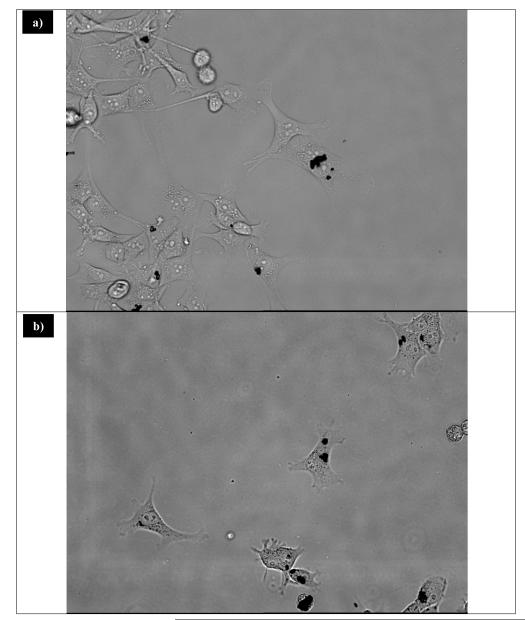
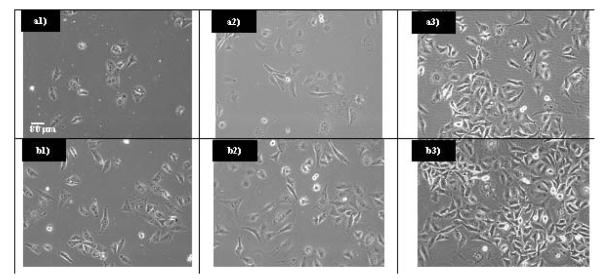
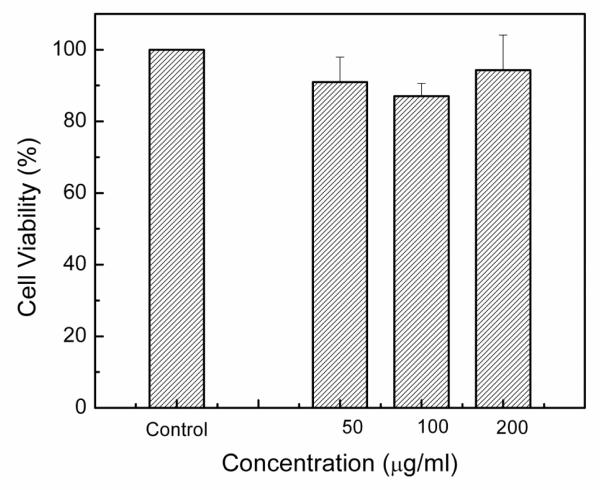
Previous experiments on the cytotoxicity of different phosphors with similar dopants were performed with maximum concentrations of 800 μg/ml48, while phosphors with different dopants were performed with maximum concentrations of 6 μg/ml.12 In these studies, to ensure that any adverse reaction to the UCP would be observed, a maximum concentration of 1,000 μg/ml was used. Even at the very high concentration of 1,000 μg/ml, no cell death occured (Figure 8). Cells interacting with UCP were grown to confluence with no obvious cell death (Figure 9). Cell viability results by the MTT assay obtained for 48 hrs (Figure 10) of exposure to upconversion phosphors on SK-N-Sh cells show 94.3% viability with a sample loading of 200 μg/ml.
Figure 8.
a) Image of NPCs after incubating with 200 μg/ml of Gd2O2S:Yb/Er for 24 hours. b) Image of NPcs after incubating with 200 μg/ml of Gd2O2S:Yb/Ho for 24 hours.
Figure 9.
a1, a2, a3) Images of MDA-MB-231 incubated with 200 μg/ml of Gd2O2S:Yb/Er for 24, 48, and 72 hours. b1, b2, b3) Images of MDA-MB-231 incubated with 200 μg/ml of Gd2O2S:Yb/Ho for 24, 48, and 72 hours
Figure 10.
In vitro cell viability of Sk-S NH cells incubated with Gd2O2S:Yb/Er at different concentrations for a period of 48 Hrs.
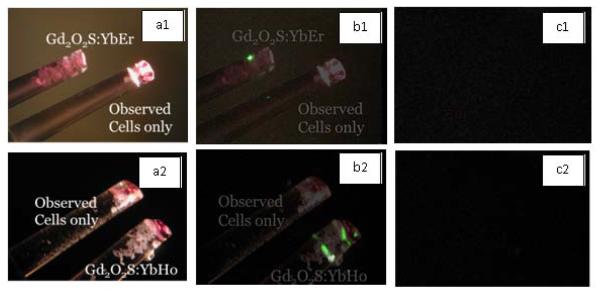
Future applications of UCP are widely epexcted to include the use of these particles in imaging of stem cells or other implanted cells in animal studies.49 As a preliminiary investigation of the suitability of these UCP for such applications, the possibility of imaging the UCP was examined in aggregates of a human breast cancer cell line, MDA-MB-231. Same concentrations of Gd2O2S:Yb/Er at 200 μg/ml, and Gd2O2S:Yb/Ho at 200 μg/ml were used to interact with cells for 24 hours. Following this, aggregates of cells and UCP were formed and used for imaging. Figure 11 shows the aggregates of MDA-MB-231 with UCP, and fluorescence results from 980 nm excitation. Control cells without UCP showed no fluorescence. Samples Gd2O2S:Yb/Er and Gd2O2S:Yb/Ho were imaged with an exposure time of 20 seconds.
Figure 11.
a1, b1 Imaging of aggregates of cells (one with UCPs, and the other serving as a control with cells only. a2, b2 NIR excited images of Gd2O2S:Yb/Er and Gd2O2S:YbHo, respectively, with an exposure time of 20 seconds. a3, b3) NIR excited images of the controls with the respective exposure time.
3.5 Magnetic Resonance Imaging
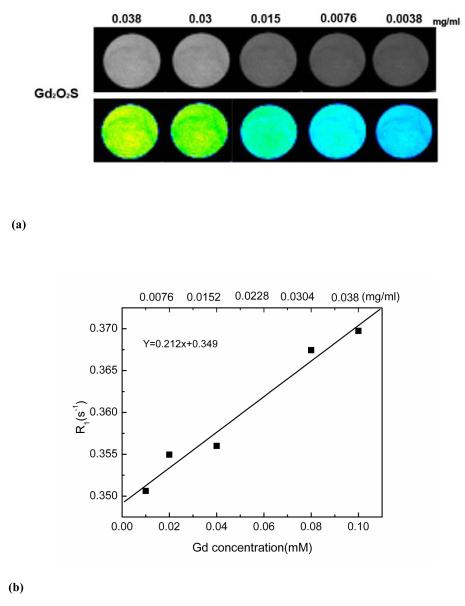
Because of the paramagnetic nature Gd2O2S: Yb/Er upconversion phosphor show potential as MRI contrast agents due to their positive signal-enhancement ability. Figure 12 (a) demonstrates the gray-scaled and color-mapped T1-weighted images of the Gd2O2S:Yb/Er with different concentrations that rage from 0.01-0.1 mmol in deionized water. The signal intensity increased as the concentration of Gd2O2S increased, resulting in the brighter images shown with gray scale. These concentration-dependent differences in signal intensity were more pitvol in the color-mapped images.
Figure 12 (a).
T1-weighted gray-scaled and color-mapped MR images of Gd2O2S:Yb/Er (b) Relaxation rate R1 (1/T1) as a function of concentrations of Gd2O2S:Yb/Er.
The relationship between T1−1 relaxation rate (R1) and Gd3+ ion concentrations of Gd2O2S phosphor was evaluated as shown in Fig. 12(b). It can be seen that the R1 value of water protons enhanced as the Gd-based concentration increased. Relaxivity measurements also showed that the Gd2O2S phosphors have a concentration-dependent proton longitudinal relaxivity (r1) of 0.21 mM−1 s−1 on the 7 T scanner, suggesting the possibility of using the Gd2O2S: Yb/Er phosphor as a T1 MRI contrast agent.
4. Conclusions
The preliminary results presented here indicate the usefulness of Gd2O2S:Yb/Er as a potential candidate to replace the existing halide based upconverting phosphor for infrared based biomedical imaging. The proposed phosphor not only enables near IR imaging features but at the same time could be used as a contrast agent in MRI imaging, thus making it an effective bimodal imaging phosphor. These UCP showed no toxicity. The phosphor compositions being fully inorganic shows very stable pH independent emission properties as confirmed by the spectroscopic and cell cultures imaging. Penetration depth studies indicate that red and NIR emissions- preferably 650 nm and 800 nm are the best for deep cell imaging and upconversion phosphors emitting in those emission wavelengths would be ideal candidates for cell imaging. Though the preliminary studies showed the potential of the UCPs for future in vivo imaging, more detailed studies are needed on the physicsl properties of these phosphors in nanoparticle forms with different surface functional groups for targeted imaging applications.
Supplementary Material
Acknowledgements
This work was fully supported by the National Science Foundation Partnerships for Research and Education in Materials (NSF-PREM) grant N0-DMR-0934218. The authors would also like to acknowledge the support from NIH-RCMI Grant No. 5G12RR013646-12. We are thankful to UTSA graduate students Madhab Pokhrel, Chris Mimun, Chris Dennis, Brian Yust and Dr Lucas Fernandez for technical help with microscopy imaging, cell experiments and other spectroscopy measurements and analysis. Technical help for additional spectroscopy measurements from Prof. Uwe Hommerich and Dr Ei Brown are greatly appreciated (through NSF grant HRD 1137747). Ms. Jiaqing, a graduate student from NU was acknowledged for the help with magnetic measurements.
References
- 1.Auzel F. Chem.Rev. 2004;104:139–174. doi: 10.1021/cr020357g. [DOI] [PubMed] [Google Scholar]
- 2.Ammar S, Helfen A, Jouini N, Fievet N, Rosenman I, Villain F, Molinie P, Danot M. J.Mat. Chem. 2001;11:186–192. [Google Scholar]
- 3.Tan MC, Kumar GA, Riman RE. J.Appl.Phys. 2009;106:063118(1)–13. [Google Scholar]
- 4.Kumar GA, Chen CW, Riman RE. Chem.Mat. 2007;19:1523–1528. [Google Scholar]
- 5.Kumar GA. In: Doped nanomaterials and nanodevices. Chen Wei., editor. American Scientific Publishers; California: 2010. pp. 147–204. [Google Scholar]
- 6.Lim SF, Riehn R, Ryu WS, Khanarian N, Tung CK, Tank D, Austin RH. Nano Lett. 2006;6:169–174. doi: 10.1021/nl0519175. [DOI] [PubMed] [Google Scholar]
- 7.Kumar GA, Pokhrel M, Sardar DK. J.Alloy.Compd. 2012;513:559–565. [Google Scholar]
- 8.Van de Rijke K, Zijlmans H, Tli SV, Raap AK, Niedbala RS, Tanke HJ. Nature Biotechnology. 2001;19:273–376. doi: 10.1038/85734. [DOI] [PubMed] [Google Scholar]
- 9.Zuiderwijk M, Tanke HJ, Niedbala RS, Corstjens P. Clinical Biochemistry. 2003;36:401–403. doi: 10.1016/s0009-9120(03)00057-2. [DOI] [PubMed] [Google Scholar]
- 10.Cheng Liang, Yang Kai, Li Y, Chen J, Wang C, Shao M, Lee ST, Liu Z. Angew Chem.Int.Ed. 2011;123:7523–7528. doi: 10.1002/anie.201101447. [DOI] [PubMed] [Google Scholar]
- 11.Mark Haacke E, Brown Robert F, Thompson Michael, Venkatesan Ramesh. Magnetic resonance imaging: Physical principles and sequence design. J. Wiley & Sons; New York: 1999. pp. 1–13. [Google Scholar]
- 12.Gupta BK, Rathee V, Narayanan TN, Thanikaivelan P, Saha A, Govind, Singh SP, Shankar V, Matri AA, Ajayan PM. Small. 2011;13:1767–1773. doi: 10.1002/smll.201100441. [DOI] [PubMed] [Google Scholar]
- 13.Yin Wenyan, Zhou Liangjun, Gu ac Zhanjun, Tian Gan, Jin Shan, Yan Liang, Liu Xiaoxiao, Xing Gengmei, Ren Wenlu, Liu a Feng, Pane Zhengwei, Zhao Yuliang. J. Mater.Chem. 2012;22:6974–6981. [Google Scholar]
- 14.He Meng, Huang Peng, Zhang Chunlei, Hu Hengyao, Bao Chenchen, Gao Guo, He Rong, Cui Daxiang. Adv.Funct.Mater. 2011;21:4470–4477. [Google Scholar]
- 15.Park Yong, Hyeon Taeghwan. Adv. Mater. 2009;21:4467–4471. [Google Scholar]
- 16.Zhou Jing, Sun Yun, Du Xiaoxia, Xiong Liqin, Hua He, Li Fuyou. Biomaterials. 2010;31:3287–3295. doi: 10.1016/j.biomaterials.2010.01.040. [DOI] [PubMed] [Google Scholar]
- 17.Liu Jianan, Bu Wenbo, Zhang Shengjian, Chen Feng, Xing Huaiyong, Pan Limin, Zhou Liangping, Peng Weijun, Shi Jianlin. Chem.Eur.J. 2012;18:2335–2341. doi: 10.1002/chem.201102599. [DOI] [PubMed] [Google Scholar]
- 18.Kumar Rajiv, Nyk Marcin, Ohulchanskyy Tymish Y., Flask Christopher A., Prasad Paras N. Adv.Funct.Mater. 2009;19:853–859. [Google Scholar]
- 19.Xing Huaiyong, Bu Wenbo, Zhang Shengjian, Zheng Xiangpeng, Li Ming, He Feng Chen Qianjun, Zhou Liangping, Peng Weijun, Hua Yanqing, Shi Jianlin. Biomaterials. 2012;33:1079–1089. doi: 10.1016/j.biomaterials.2011.10.039. [DOI] [PubMed] [Google Scholar]
- 20.Li Zhengquan, Zhang Yong, Shuter Borys, Idris Niagara Muhammad. Langmuir. 2009;25:12015–12018. doi: 10.1021/la903113u. [DOI] [PubMed] [Google Scholar]
- 21.Cheg Liang, Yang K, Li Y, Chen J, Wang C, Shao M, Lee ST, Liu Z. Angew.Chem.Int.Ed. 2011;123:7523–7528. doi: 10.1002/anie.201101447. [DOI] [PubMed] [Google Scholar]
- 22.Zhang Fan, Braun Gary B., Pallaoro Alessia, Zhang Yichi, Shi Yifeng, Cui Daxiang, Moskovits Martin, Zhao Dongyuan, Stucky Galen D. Nano Lett. 2012;12:61–67. doi: 10.1021/nl202949y. [DOI] [PubMed] [Google Scholar]
- 23.Wörle-Knirsch Jörg M., Kern Katrin, Schleh Carsten, Adelhelm Christel, Feldmann Claus, Krug Harald F. Environ. Sci. Technol. 2007;41:331–336. doi: 10.1021/es061140x. [DOI] [PubMed] [Google Scholar]
- 24.Cailleau R, Young R, Reeves WJ. J.Natl.Cancer Inst. 1974;61:661–674. doi: 10.1093/jnci/53.3.661. [DOI] [PMC free article] [PubMed] [Google Scholar]
- 25.Kawasaki H, Mizuseki K, Nishikawa S, Kaneko S, Kuwana Y, Nakanishi S, Nishikawa SI, Sasai Y. Neuron. 2000;28:31–40. doi: 10.1016/s0896-6273(00)00083-0. [DOI] [PubMed] [Google Scholar]
- 26.Price PJ, Brewer GJ. Protocols for Neural Cell Culture. 3rd Edn Humana Press Inc.; NJ: 2001. pp. 173–198. [Google Scholar]
- 27.Wu MH. Surf.Interface.Anal. 2009;41:11–16. [Google Scholar]
- 28.Mader Heike S, Kele Peter, Saleh Sayed M, Wolfbeis Otto S. Curr.Op.Chem. Biol. 2010;14:582–596. doi: 10.1016/j.cbpa.2010.08.014. [DOI] [PubMed] [Google Scholar]
- 29.Wei Y, Lu F, Zhang X, Chen D. J Alloys Compd. 2007;427:333–340. [Google Scholar]
- 30.Li ZQ, Zhang Y. Nanotechnology. 2008;9:345606(1)–5. doi: 10.1088/0957-4484/19/34/345606. [DOI] [PubMed] [Google Scholar]
- 31.Wang F, Liu XG. J. Am. Chem. Soc. 2008;130:5642–5643. doi: 10.1021/ja800868a. [DOI] [PubMed] [Google Scholar]
- 32.Yang LW, Han HL, Zhang YY, Zhong JX. J Phys. Chem.C. 2009;113:18995–18999. [Google Scholar]
- 33.Chao Z, Lingdog S, Yawen Z, Chunhua Y. J.Rare earths. 2010;28:807–819. [Google Scholar]
- 34.Ye X, Collins JE, Kang Y, Chen J, Chen DTN, Yodh AG, Murray CB. PNAS. 2010;107:22430–22435. doi: 10.1073/pnas.1008958107. [DOI] [PMC free article] [PubMed] [Google Scholar]
- 35].Ostrowski AD, Chan EM, Gargas DJ, Katz EM, Han G, Schuck PJ, Milliron DJ, Cohen BE. ACSNano. 2012;6:2686–2692. doi: 10.1021/nn3000737. [DOI] [PubMed] [Google Scholar]
- 36.Mo M, Liwen Y, Guozhong R, Changfu X, Jianguo L, Qibin Y, Lumin J. 2011;131:1482–1486. [Google Scholar]
- 37.Kumar GA, Pokrel M, Sardar DK, Samuel P, Ueda Ken Ichi, Yanagitani T, Yagi H. Sci.Adv.Mat. 2012;4:617–622. [Google Scholar]
- 38.Becker PC, Olsson NA, Simpson JR. Erbium doped fiber amplifiers- Fundamentals and Technology. Academic Press; New York: 1999. pp. 1–36. [Google Scholar]
- 39.Digonnet MJF. Rare Earth Doped Fiber Lasers and Amplifiers. Marcel Decker Inc.; NY: 1993. pp. 100–150. [Google Scholar]
- 40.De Mello JC, Wittmann HF, Friend RH. Adv.Mat. 1997;9:230–232. [Google Scholar]
- 41.Boyer JC, van Veggel FCJM. Nanoscale. 2010;2:1417–1419. doi: 10.1039/c0nr00253d. [DOI] [PubMed] [Google Scholar]
- 42.Page RH, Shaffers KI, Waide PA, Tassano JB, Payne SA, Krupke WF. J.Opt.Soc.Am. B. 1998;15:996–1008. [Google Scholar]
- 43.Ju Q, Liu Y, Tu D, Zhu H, Li R, Chen X. Chem,Eur.J. 2011;17:8549–8854. doi: 10.1002/chem.201101170. [DOI] [PubMed] [Google Scholar]
- 44.Mendoza D, Morales F, Walter J. J.Phys.Condens.Matter. 1999;11:L317–322. [Google Scholar]
- 45.Stolik S, Delgado JA, Perez A, Anasagasti L. J.Photochem.Photobiol. B. 2000;57:90–93. doi: 10.1016/s1011-1344(00)00082-8. [DOI] [PubMed] [Google Scholar]
- 46.Frangioni JV. Curr.Opin.Chem.Biol. 2003;7:626–634. doi: 10.1016/j.cbpa.2003.08.007. [DOI] [PubMed] [Google Scholar]
- 47.Wang J, Wang F, Wang C, Liu Z, Liu X. Angew Chem.Int.Ed. 2011;50:10369–10372. doi: 10.1002/anie.201104192. [DOI] [PubMed] [Google Scholar]
- 48.Cao T, Yang Y, Gao Y, Zhou J, Li Z, Li F. Biomaterials. 2011;59:2959–2968. doi: 10.1016/j.biomaterials.2010.12.050. [DOI] [PubMed] [Google Scholar]
- 49.Cheng L, Wang C, Ma X, Wang Q, Cheng Y, Wang H, Li Y, Liu Z. Adv.Funct.Mater. 2012 DOI: 10.1002/adfm.201201733. [Google Scholar]
Associated Data
This section collects any data citations, data availability statements, or supplementary materials included in this article.


