

Abstract
Raman imaging offers unsurpassed sensitivity and multiplexing capabilities. However, its limited depth of light penetration makes direct clinical translation challenging. Therefore, a more suitable way to harness its attributes in a clinical setting would be to couple Raman spectroscopy with endoscopy. The use of an accessory Raman endoscope in conjunction with topically administered tumor-targeting Raman nanoparticles during a routine colonoscopy could offer a new way to sensitively detect dysplastic lesions while circumventing Raman’s limited depth of penetration and avoiding systemic toxicity. In this study, the natural biodistribution of gold surface-enhanced Raman scattering (SERS) nanoparticles is evaluated by radiolabeling them with 64Cu and imaging their localization over time using micropositron emission tomography (PET). Mice are injected either intravenously (IV) or intrarectally (IR) with approximately 100 microcuries (μCi) (3.7 megabecquerel (MBq)) of 64Cu-SERS nanoparticles and imaged with microPET at various time points post injection. Quantitative biodistribution data are obtained as % injected dose per gram (%ID g−1) from each organ, and the results correlate well with the corresponding microPET images, revealing that IV-injected mice have significantly higher uptake (p < 0.05) in the liver (5 h = 8.96% ID g−1; 24 h = 8.27% ID g−1) than IR-injected mice (5 h = 0.09% ID g−1; 24 h = 0.08% ID g−1). IR-injected mice show localized uptake in the large intestine (5 h = 10.37% ID g−1; 24 h = 0.42% ID g−1) with minimal uptake in other organs. Raman imaging of excised tissues correlate well with biodistribution data. These results suggest that the topical application of SERS nanoparticles in the mouse colon appears to minimize their systemic distribution, thus avoiding potential toxicity and supporting the clinical translation of Raman spectroscopy as an endoscopic imaging tool.
1. Introduction
Since its discovery, Raman spectroscopy has proven to be a powerful analytical tool offering many advantages including excellent sensitivity to small structural and chemical changes, its ability to multiplex, and its resistance to both autofluorescence and photobleaching. More recently, biomedical researchers have harnessed these unique properties associated with Raman spectroscopy for analysis of cell populations, excised tissue samples, intact preclinical animal models, and even clinical diagnosis.
The principle by which this novel diagnostic approach operates is based on the Raman Effect. When light is scattered from a molecule, most photons are elastically scattered. However, a small fraction of light is inelastically scattered at optical frequencies different from and usually lower than the frequency of the incident photons. The process leading to this inelastic scatter is termed the Raman Effect. However, this effect is very weak, only producing one inelastically scattered photon for every 10 million elastically scattered photons.[1]
Thus far, several researchers have been able to utilize the intrinsic Raman scattering signatures of tissue samples both ex vivo and in vivo to differentiate malignant from normal tissues.[2–5] Due to the low depth of penetration associated with most optical techniques, a Raman endoscope consisting of a flexible optical fiber bundle is often utilized for acquiring these intrinsic Raman spectra from inside the body. Although, this technique has shown to be clinically useful, the weak effect associated with intrinsic Raman scattering remains a problem, leading to long exposure times, poor signal, and, as a result, suboptimal sensitivity.
We intend to overcome this limitation by utilizing surface-enhanced Raman scattering (SERS) nanoparticles as tumor-targeting contrast agents. SERS is a plasmonic effect where small molecules adsorbed onto a nanoroughened noble metal surface (e.g., gold) experience a dramatic increase in the incident electromagnetic field, resulting in a several-orders-of-magnitude-higher Raman effect, which has recently given us the capability to detect pm concentrations of SERS Raman-active nanoparticles injected in living mice.[6]
Several different kinds of SERS nanoparticles have been recently developed for various in-vitro applications, including evaluation of cell–cell interactions, tracking and imaging of apoptosis, immunoassay platforms, and even anti-counterfeiting measures.[7–9] However, only a select few have been utilized as tumor-targeting beacons in living animal models.[6,10,11] Based on the results and experiences gained from our previous studies, we have decided to evaluate the biodistribution properties of the Nanoplex Biotags manufactured by Cabot Security Systems (formerly Oxonica). These SERS nanoparticles have ideal properties for clinical translation, including an inert gold composition and excellent Raman signal strength for ultrasensitive detection and multiplexing characteristics with up to 10 unique spectral fingerprints.
Briefly, our clinical diagnostic strategy would involve chemically modifying these SERS nanoparticles with tumor-targeting ligands and then topically administering them to the area of interest (i.e., the colon) during endoscopic, laparoscopic, or surgical procedures, in the hope of avoiding adverse toxicity effects (that may arise from systemic exposure) and also increasing targeting efficiency. After enough time has passed for sufficient binding to occur and rinsing of the unbound nanoparticles has been completed, a Raman endoscope will be used to acquire spectra from the area of interest within the body in order to determine effective tumor targeting.
We intend to use colon cancer to demonstrate this general approach as the first target for reasons of tumor-targeted peptide availability, reduced toxicity, and a need for improved detection. It was recently reported that flat lesions in the colon were five times more likely to contain cancerous tissue than polyps detected by conventional colonoscopy.[12] In addition, we believe that by administering these gold nanoparticles directly into the bowel we will be able to avoid the systemic exposure and thus any adverse toxicity effects.
Before proceeding with tumor-targeting studies, however, it is first important to fully characterize the localization and accumulation of these SERS Raman nanoparticles in small living subjects. In this study, we have radiolabeled our SERS nanoparticles with 64Cu in order to assess their natural bio-distribution using both micropositron emission tomography (PET) imaging and gamma counting followed by Raman imaging and transmission electron microscopy (TEM) of removed tissues for confirmation of their localization. Two routes of administration were evaluated: to compare the differences in distribution between systemic administration and topical application, either intravenous (IV) or intrarectal (IR) injections were given. After IV injection, we would be able to follow the natural distribution of these SERS nanoparticles once they have been introduced into the blood stream. IR administration, on the other hand, would give us a better idea of what happens to these nanoparticles once they have been topically applied, in this case to the colon.
2. Results
2.1. SERS Raman Nanoparticles
All experiments described herein were conducted using SERS nanotags (Cabot Security Systems formerly Oxonica Materials Inc., Mountain View, CA).[13,14] The SERS nanoparticles we used to evaluate biodistribution in this study consisted of a unique Raman active molecular layer, trans-1,2-bis(4-pyridyl)-ethylene, adsorbed onto a 60 nm-diameter Au core coated with silica, making the entire diameter of the nanoparticle on the order of 120 nm (Supporting Information (SI), Figure S1).[15] The Au nanoparticle core acts as a substrate for SERS and can increase the effective Raman scattering efficiency by several orders of magnitude,[16] allowing for more sensitive detection and making it ideal for early detection diagnostic imaging. Upon excitation with a 785 nm laser, the SERS nanoparticles display a unique spectrum based on the inelastic Raman scattering of the incident laser light that comes from interacting with the molecular structure of the adsorbed Raman active layer trans-1,2-bis(4-pyridyl)-ethylene.[15] Like most optical techniques, this strategy is depth-limited, which is why we intend to eventually utilize a fiber optic-based endoscopic approach to overcome this depth issue while still taking full advantage of Raman’s ultrasensitive properties and multiplexing characteristics. However, before we can implement this unique strategy for patient studies, we must first thoroughly understand the distribution and localization of our SERS nanoparticles after being administered to the body, preferably by using an imaging modality such as PET that is not vulnerable to depth. In order to fully assess the biodistribution properties of these SERS nanoparticles both longitudinally and noninvasively, a relatively long-lived (half life = 12 h) positron emitting radioisotope, 64Cu, was conjugated to their surface (SI, Figure S2, and see Experimental Section for more details), enabling us to monitor/localize them using microPET.
2.2. MicroPET Imaging
A series of dynamic microPET images were acquired over the first 13 min post IV injection (see video provided in the SI), and revealed immediate uptake of SERS nanoparticles within the liver and spleen, the two major organs that comprise the reticuloendothelial system and are responsible for breaking down nanoparticles on the order of 120 nm. Rapid accumulation of SERS nanoparticles was observed within the first 2 min post IV injection in both the liver and spleen followed by continuous localization for the remainder of the 13 min dynamic imaging series (SI, Figure S3). Although the majority of accumulation was seen in the liver and spleen, the lungs also showed minimal accumulation of SERS nanoparticles with a maximum uptake at approximately 15 s post injection, most likely due to the first pass of the SERS nanoparticles encountering the lungs after being administered as a bolus IV.
Static microPET images acquired at various time points post injection over 24 h revealed clear differences in the distribution patterns of SERS nanoparticles injected IV versus IR (Figure 1). Mice injected IV showed immediate accumulation of 64Cu–SERS nanoparticles in the liver and spleen after IV injection with continuous localization in the liver and spleen over 24 h (spleen not visible in coronal slices shown in Figure 1). In contrast, the mice receiving an IR injection, displayed an initial uptake of 64Cu–SERS nanoparticles localized in the colon, followed by a rapid decrease in uptake over the 24 h period (see SI, Figure S4), where the majority of the SERS nanoparticles appear to have cleared the colon and thus the body, likely via fecal excretion.
Figure 1.
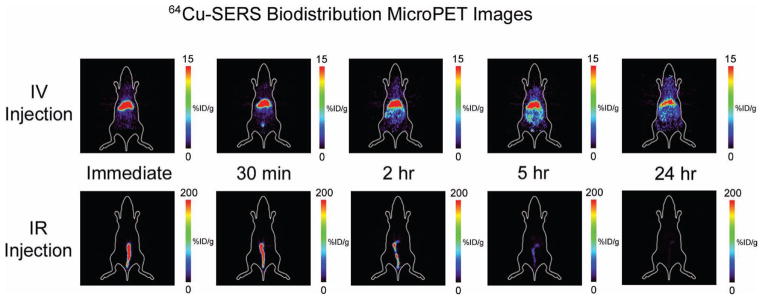
MicroPET images of the accumulation of 64Cu–SERS nanoparticles post IV injection (top panel) versus post IR injection (bottom panel). The images represent a coronal slice of a single mouse taken at various time points; immediately, 30 min, 2 h, 5 h, and 24 h after either IV or IR injection. Notice the significant difference in the accumulation of 64Cu–SERS nanoparticles in mice receiving an IV injection, where uptake is localized to the liver, versus mice receiving an IR injection, where uptake is localized to the colon. Colored scale bar to the right of each image represents 64Cu–SERS uptake where red represents most uptake and black represents no uptake in units of %ID g−1.
2.3. Biodistribution Data
Tissues were harvested from mice for gamma counting at necropsy 2, 5, and 24 h either post IV or IR injection to quantitatively assess the biodistribution of SERS nanoparticles within various organs and to correlate their localization with their respective microPET images. Quantitative biodistribution (%ID g−1) data obtained from each organ correlated well with the corresponding microPET images, and revealed significant uptake of SERS nanoparticles in several organs of mice injected IV as opposed to those injected IR as seen in Figure 2. For instance, mice injected IV had significantly higher uptake (p < 0.05) in the liver (2 h = 11.35% ID g−1; 5 h = 8.96% ID g−1; 24 h = 8.27% ID g−1), as opposed to mice injected IR (2 h = 0.55% ID g−1; 5 h = 0.09% ID g−1; 24 h = 0.08% ID g−1). This significant increase in SERS nanoparticle uptake in mice receiving IV injections as opposed to IR injections was also seen in several other organs including the spleen, kidneys, stomach, and lungs.
Figure 2.

Biodistribution data taken from various excised organs after either IV or IR injection of SERS nanoparticles at a) 2 h, b) 5 h, and c) 24 h post injection. Notice significant differences represented by * (p < 0.05) between each of the injection groups, particularly in the accumulation of SERS nanoparticles in almost all tissues after IV injection, as compared to those mice injected IR. This data shows that mice injected IR had localized accumulation of SERS nanoparticles to predominantly the large intestine and cecum out to 5 h post injection. However, by 24 h post injection, most of the SERS nanoparticles had cleared, presumably via the feces, whereas the mice injected IV still showed uptake in most tissues as seen in the bottom graph.
Mice injected IR, however, showed localized SERS nanoparticle uptake in the large intestine (2 h = 123.72% ID g−1; 5 h = 10.37% ID g−1; 24 h = 0.42% ID g−1) with minimal uptake (less than 0.13% ID g−1) in every other organ at 24 h. Quantitative microPET analysis also reveals that this minimal uptake seen in other organs (i.e., liver) after IR injection correlates well with free 64Cu as seen over the 24 h period thus suggesting the activity is likely due to the dissociation of the 64Cu from the SERS nanoparticles (SI, Figure S5). SERS nanoparticle uptake was also observed in the cecum at 2 and 5 h post IR injection. This was likely due to the slight size variability between mice and the volume of SERS nanoparticles that was estimated to fill the entire colon, therefore during IR injection slight overflow from the large intestine into the cecum may have occurred.
Overall, SERS nanoparticles appear to be retained in several organs, even at 24 h post IV injection, whereas mice receiving ‘topical’ IR injections showed localized accumulation initially in the cecum/colon with minimal retention at 24 h and no signs of SERS nanoparticle accumulation in any other organs throughout the entire study.
2.4. Serum Stability of SERS Nanoparticles and Raman Imaging of Excised Tissues
Serum stability studies on the SERS nanoparticles revealed consistent Raman signal associated with the active molecular layer, trans-1,2-bis(4-pyridyl)-ethylene on the SERS nanoparticle over 24 h incubation. The spectral fingerprint was found to be unaffected and no differences in signal intensity were observed as compared to SERS nanoparticles incubated with distilled water or phosphate buffered saline (PBS, see SI for details). Raman maps were acquired of various excised tissues, particularly those mentioned above displaying an increased 64Cu uptake, to confirm the presence of SERS nanoparticles injected. Raman imaging revealed the exact spectral fingerprint associated with the SERS nanoparticles administered IV within the liver, spleen, lungs, and kidneys across all time points (Figure 3). However, mice injected IR only displayed enough SERS nanoparticle accumulation in the colon to produce an adequate Raman signal at 2 and 5 h post injection with no other detectable accumulation in the liver, spleen, lungs, or kidneys over the entire 24 h (SI, Figure S6).
Figure 3.
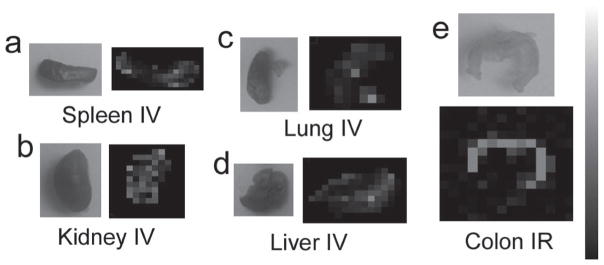
Raman images of various excised tissues at 2 h post injection a) spleen IV injected, b) kidney IV injected, c) lung IV injected, d) liver IV injected, e) colon IR injected. These organs were chosen to image with Raman mapping based on the increased accumulation of SERS nanoparticles seen from the biodistribution data. These Raman intensity maps confirm the presence of SERS nanoparticles within these tissues of interest. Scale bar to the right represents Raman intensity, where white represents the highest Raman signal and black represents no associated Raman signal.
2.5. Histopathology via TEM Imaging of SERS Accumulation
Another group of mice were evaluated separately where mice were injected either IV or IR using the same administration technique implemented above. The mice were sacrificed at 5 min and 2 weeks post injection in order to microscopically assess the presence or absence of these SERS nanoparticles within the liver, the main organ responsible for the trapping and degradation of these size nanoparticles. TEM of fixed liver tissues revealed several clusters of our gold SERS nanoparticles within the liver at both 5 min and 2 weeks post IV injection, whereas mice that were administered IR injections revealed no trace of gold SERS nanoparticles at either 5 min or 2 weeks post injection (Figure 4). Of the hundreds of cell sections within the 81 000 μm2 area examined for each tissue, not a single SERS nanoparticle was found in the liver after IR injection.
Figure 4.

TEM images of SERS nanoparticle accumulation in liver tissue at 5 min and 2 weeks post injection of SERS nanoparticles. a) Bright-field scanning TEM (STEM) image of liver tissue from mouse injected IR at 5 min. b) Bright-field STEM image of liver tissue from mouse injected IV at 5 min. Inset is a magnified view of the SERS nanoparticles boxed in the STEM image (scale bar = 250 nm). c) Bright-field STEM image of liver tissue from mouse injected IR at 2 weeks. d) Bright-field STEM image of liver tissue from mouse injected IV at 2 weeks. Inset is a magnified view of the SERS nanoparticles boxed in the STEM image (scale bar = 250 nm). Notice the absence of SERS nanoparticles in the liver tissue from the mice that received an IR injection, as shown in panels (a) and (c).
3. Discussion
SERS nanoparticles possess extraordinary spectral properties, including their ability to be sensitively detected and multiplexed, making them ideal to be utilized as tumor targeting molecular imaging agents. Several novel nanoparticle constructs with great potential for either diagnostic or therapeutic applications are currently being investigated.[17–20] However, two major obstacles have kept most of them from being clinically translated: 1) effective delivery to tumor site, and 2) toxicity issues. Since most nanomedicines, to date, are administered systemically, several factors (e.g., size, surface charge, hydro phobicity) need to be considered during their development in order to help overcome these obstacles. Size, for instance, plays an important role in determining where these nanoparticles will accumulate in the body over time and how they will be broken down and eventually cleared (via liver/ spleen or kidney). Nanoparticle size has also been shown to significantly influence both their circulation half life and their ability to extravasate into the tumor space, both of which determine tumor targeting efficiency. Although most nanocarriers rely on the enhanced permeability and retention effect to extravasate through leaky tumor vasculature and selectively accumulate in the tumor tissue, it has recently been reported that not all tumors display the same degree of ‘leakiness’,[21] making it even more difficult to effectively deliver these nanoparticles out of the vasculature to their targets within a tumor. With this in mind, we have devised a way to circumvent these obstacles of delivery and toxicity by topically administering our nanoparticles to an area of interest (i.e., colon). That way the nanoparticles won’t have to extravasate out of the vasculature in order to find their target, since they will be directly applied to the area of interest (i.e., colon) and adverse systemic toxicity affects could potentially be avoided as well by avoiding IV administration.
In this study, we have evaluated the biodistribution of our SERS nanoparticles (≈120 nm) after both IV and IR administration. The SERS nanoparticles were radio-labeled with 64Cu using a DOTA chelator (Experimental Section and SI, Figure S2). These studies were performed under the assumption that the DOTA–SERS nanoparticles behave identically to SERS nanoparticles alone, in terms of biodistribution, and that the DOTA, being a small entity, does not contribute significantly to the natural biodistribution of the nanoparticle as previously described by Schipper et al.[22] In addition, our results show a different biodistribution pattern than that of free 64Cu (mostly accumulating in the kidney and bladder due to its natural route of excretion) suggesting minimal dissociation of the 64Cu from the SERS nanoparticles. Furthermore, the minimal %ID g−1 uptake seen in other organs (Figure 2) besides the cecum/large intestine after IR administration is most likely due to the dissociation of 64Cu from the SERS nanoparticles. The distribution patterns of free 64Cu behave similarly to 64Cu-labled SERS nanoparticles in other organs outside the large intestine (i.e., liver; see SI, Figure S5) suggesting that the uptake represents the free dissociated 64Cu and not the accumulation of the actual SERS nanoparticles themselves.
After thorough microPET and tissue uptake analysis, the results clearly show a difference in nanoparticle distribution after administration between the IV and IR groups, where mice receiving a ‘topical’ IR administration showed localized accumulation of our SERS nanoparticles within the colon and its neighboring organ, the cecum. No absorption of the SERS nanoparticles was observed within any other organ over the 24 h microPET imaging sequence, and the liver was clear of SERS nanoparticles out to 2 weeks post IR administration via TEM imaging. Additionally, the SERS nanoparticles cleared the colon relatively quickly (SI, Figure S4) where less than 1% ID g−1 was left in the large intestine after 24 h post IR injection. Mice injected IV, on the other hand, revealed immediate accumulation of our SERS nanoparticles, in the lungs, liver, and spleen, with continued uptake in both the liver and spleen over the entire 24 h microPET imaging sequence. TEM imaging also confirmed the presence of our SERS nanoparticles within the liver at both early and late stage time points post IV injection (Figure 4). These results support the use of these SERS nanoparticles as a topically applied contrast agent within the colon for the potential earlier detection of colon cancer.
Although beyond the scope of this paper, it should be noted that further studies are ongoing in our lab to determine the effect that functionalized (tumor targeting) Raman nanoparticles may have after IR injection. Thus far, no significant differences in biodistribution patterns have been observed between mice injected IR with functionalized Raman nanoparticles versus nonfunctionalized Raman nanoparticles. In fact, preliminary analysis using inductively coupled plasma to measure gold content has shown gold levels below the limit of detection within the two sentinel organs (liver and colon) in all mice (n = 10) 3 days post IR injection.
Thus far, the use of Raman nanoparticles as imaging contrast agents for clinical utility has never been demonstrated before, predominantly due to the weak signal generally associated with Raman spectroscopy and the limited depth of penetration that comes from using an optical technique. With this in mind, we propose to exploit the SERS effect, a metal based phenomenon that utilizes surface plasmon resonance, to significantly enhance the Raman signal coming from our contrast agent (i.e., SERS nanoparticles). In addition, we will employ an endoscopic imaging device, modified for acquiring Raman spectra within the colon, to localize the accumulation of our tumor targeting SERS nanoparticles in order to overcome the limited depth of penetration issue.
Other localized routes of administration have recently been investigated including the fate of various sized gold nanoparticles after either intratacheal instillation or inhalation into the lungs.[23,24] Their finding suggest no detectable amounts of gold on the order of 40 and 100 nm in diameter get translocated from the lungs to the systemic circulation in mice, and that only trace amounts of gold nanoparticles on the order of 2 nm are found in the blood when instilled directly into the trachea.[23] However a larger degree of nanoparticles, on the order of 20 nm, get translocated into the blood stream when inhaled by rats.[24] These studies show promise for our Raman nanoparticles (≈120 nm) to be directly instilled into the lung for tumor targeting and detection during bronchoscopy without causing adverse systemic toxicity effects.
The issue of nanoparticle induced toxicity has generated quite a bit of interest amongst the biomedical community, especially now with the approval of several nanoparticle constructs for clinical use.[25] Several reports have recently been published discussing the toxicity effects of various nanoparticles after being administered intravenously,[18,25–30] all with similar concerns as to exactly how long these nanoparticles seem to stay in the body (i.e., liver, spleen, and kidneys), with some reports claiming up to several months post IV injection.[27,31–33] A huge advantage to administering these nanoparticles topically is their ability to be cleared without crossing into the systemic circulation and thus avoiding the issue of prolonged retention in vital organs like the liver, spleen, and kidneys.
Another major advantage to utilizing SERS nanoparticles as tumor targeting contrast agents is their unique ability to multiplex. We currently have 10 different batches of SERS nanoparticles, each displaying a unique spectral fingerprint when imaged, thus giving us the capability to interrogate several different targets simultaneously.[15] Several colon cancer biomarkers have recently been identified along with their associated tumor targeting ligands.[34,35] If one were to conjugate each batch of SERS nanoparticles with different colon cancer targeting ligands this multiplexing technique could enable us to evaluate the targeting efficiency of several tumor targeting SERS nanoparticles simultaneously, thus offering us increased specificity as to which biomarker is overexpressed on different regions of the diseased colon. No other imaging modality has the capability of offering this kind of multiplexed information to the degree of being able to spectrally unmix and identify 10 unique individually dispersed nanoparticles.
Although we intend to initially interrogate colon cancer to demonstrate this novel approach, for reasons of tumor targeted ligand availability, reduced toxicity, and the need for improved detection, this technique is in no way limited to diseases of the colon. In fact, several tissues could be interrogated for cancer detection utilizing this procedure including skin, bladder, lungs, esophagus, cervix, and vagina; all of which are easily accessible and can be imaged with a Raman endoscopic device.
4. Conclusion
In conclusion, this novel endoscopic approach which utilizes the ultrasensitive detection and multiplexing properties of Raman spectroscopy in conjunction with SERS nanoparticles has great potential for clinical utility, not only for colon assessment but also for other endoscopic applications (i.e., esophagus, cervix, and bladder). Although more thorough toxicity testing needs to be performed on these SERS nanoparticles, which is currently ongoing in our lab, these initial biodistribution results hold significant promise in translating this novel technique to the clinic, with the hope of improving early cancer detection and thus the prognosis for cancer patients.
5. Experimental Section
5.1. Chemical Conjugation and Radio-Labeling of SERS Nanoparticles
SERS Nanoparticles
SERS nanotags were provided by Cabot Security Systems (formerly Oxonica Materials Inc., Mountain View, CA) and comprised a 60 nm-diameter Au core coated with a monolayer of the Raman-active organic molecule, trans-1,2-bis(4-pyridyl)-ethylene, and encapsulated with a 30 nm-diameter silica shell, making the entire particle on the order of ≈120 nm. The particular lot used in this study was the S440 batch, which consists of a unique Raman-active material and its associated spectrum, which can be seen in our previous work.[15] Reproducibility of experiments conducted with these SERS nanoparticles was previously evaluated in our lab, revealing a 1.9% coefficient of variance among multiple sample measurements.[6]
Preparation of Pegylated SERS Nanoparticles
To stabilize the gold nanospheres against aggregation under various conditions, both long- and short-chain polyethylene glycol (PEG) molecules were conjugated to the nanosphere’s silica surface (in a molar ratio of 1:5, long:short). Specifically; a solution of maleimide-PEG5000-N-hydroxysuccinimide ester (Mal-PEG5000-NHS, 2 mg, 0.4 μm) and maleimide-PEG2000-methoxy (Mal-PEG2000-OCH3, 4 mg, 2 μm) in 2-morpholinoethanesulfonic acid (MES) buffer (pH = 7.2) was added to thiolated SERS particles (0.5 mL, 0.02 nm) and stirred at room temperature for 1 h. Excess PEG molecules were separated from pegylated nanoparticles by three rounds of centrifugation (10 000 RPM, 4 min), and resuspension in MES buffer (pH = 7.2).
Conjugation with DOTA
Pegylated gold nanospheres were functionalized with DOTA (1,4,7,10-tetraazacyclododecane-1,4,7,10-tetraacetic acid) to enable chelation of radioactive metal ions (in this case Copper-64, half life = 12.7 h). Specifically; primary amine-DOTA was covalently conjugated to NHS ester terminated long-chain PEG molecules on gold nanoparticles via the addition of p-NH2-Bn-DOTA (0.9 mg, 1.3 μmol) in 0.5 mL MES buffer (pH = 7.2) to pelleted pegylated particles. Solution was stirred at room temperature overnight. Excess DOTA was separated from functionalized nanoparticles by three rounds of centrifugation (10 000 RPM, 4 min), and resuspension in MES buffer (pH = 7.2). DOTA-functionalized nanoparticles were finally suspended in deionized water (0.5 mL) for radiolabeling.
Protocol of SERS Copper-64 Labeling
The SERS nanoparticles were radiolabeled with 64Cu by addition of 185–259 MBq (≈5–7 mCi) 64CuCl2 [1 pmol SERS nanoparticles per 1.62 GBq 64Cu] in 0.01 n NaOAc (pH 5.0) buffer followed by a 1 h incubation at 37 °C with gentle shaking. SERS nanoparticles were centrifuged and washed with deionized sterile water three times to remove nonchelated copper. Labeling yield is ≈20–30%, therefore the resulting specific activity was 324–486 MBq per 1 pmol SERS nanoparticles (8.76–13.14 mCi pmol−1). Rinsed SERS nanoparticles were resuspended in 400 μL of PBS by sonicating and vortexing. According to N-succinimidyl-3-(2-pyridyldithio) propionate (SPDP) spectrographic analysis[36] of our 64Cu-tagged SERS nanoparticles this method attaches ≈60 000 64Cu molecules per nanoparticle (≈1 64Cu molecule per 3 nm2 surface area).
5.2. Animal Experiments
Female 8-week-old nude mice (Charles River) were used for all biodistribution studies. All procedures performed on the animals were approved by the University’s Institutional Animal Care and Use Committee, and were within the guidelines of humane care of laboratory animals.
Mice were divided into two injection groups to evaluate differences in biodistribution between administering SERS nanoparticles intravenously (IV) versus intrarectally (IR). Each group contained subgroups where mice were further separated to evaluate biodistribution at various time points post injection. Three mice from each group were sacrificed at 2 h, 5 h and 24 h to evaluate accumulation of SERS nanoparticles within specific organs of interest. Mice in the IV group were given a 200 μL injection of approximately 100 μCi of 64Cu-SERS nanoparticles via the tail vein using a 26 gauge needle. Mice in the IR group also received a 200 μL injection of approximately 100 μCi of 64Cu-SERS nanoparticles using the hollow flexible portion of a 25 gauge angiocatheter inserted via the rectum.
5.3. MicroPET Imaging
On the day of imaging, each mouse was anesthetized with 2.5–3% isoflurane delivered by 100% oxygen as the carrier gas at 2 L min−1 through an isoflurane vaporizer. MicroPET imaging commenced immediately after injection of the 64Cu-SERS nanoparticles. The mice were placed prone on the microPET bed and imaged with a Rodent R4 MicroPET system manufactured by CTI Concorde Microsystems (Knoxville, TN). Five minute static images were acquired at various time points post injection: immediately, 30 min, 2 h, 5 h, and 24 h. The images were then reconstructed using a 2D ordered subset expectation maximization (2D-OSEM) algorithm with a spatial resolution of 1.66 to 1.85 mm[37] and analyzed using both Amide[38] and AsiPRO image processing software. No attenuation correction or partial volume correction were applied.
5.4. Biodistribution
After imaging, mice were euthanized by cervical dislocation under deep isoflurane anesthesia. In each injection group (IV and IR) mice were sacrificed at 2 h (n = 3), 5 h (n = 3), and 24 h (n = 3). Tissues were harvested, weighed and placed in scintillation vials for gamma counting. Organs of interest such as the liver spleen and colon were placed in vials containing a 2:1:1 solution of 0.2 m sodium cacodylate buffer: 10% glutaraldehyde: 8% paraformaldehyde (EMSdiasum) for transmission electron microscopy (TEM) analysis. All tissues harvested were counted for 1 min in a Cobra II γ-counter (Packard/Perkin Elmer). Results in Figure 2 are expressed as % injected dose per gram of tissue (%ID g−1).
TEM Analysis
Organs of interest such as the liver, spleen, and colon were fixed and prepared for TEM analysis in order to verify the microscopic location of the SERS nanoparticles after either IV or IR administration. Ten grid spacings corresponding to a 81 000 μm2 area were examined. Each section was 150 nm thick corresponding to a total of 12 500 μm3 of material examined for each tissue sample. More details on the methods of sample preparation are provided in SI Text.
Raman Spectroscopic Imaging in Excised Tissues
Raman measurements on excised tissues were performed with a Renishaw microscope system to verify the presence of SERS nanoparticles within specific organs of interest. A semiconductor diode NIR laser operating at λ = 785 nm was used as the excitation source with a laser power of 60 mW measured at the surface of the tissues. Raman images were obtained by using a Raman point mapping method. A computer-controlled x–y translation stage was used to raster-scan the tissues creating a spectral image by measuring the Raman spectrum of each individual pixel in the area of interest with a 750 μm or 1 mm step size. Integration times of 3 s per step were acquired for each tissue Raman map. The objective lens used was a 12× open field in a dimly lit room.
Spectral Analysis
The direct classical least squares (DCLS) method, also called linear unmixing and K-matrix methods, was used in this work to perform analysis of Raman spectroscopy.[39,40] For more details see SI Text.
Statistical Analysis
The data collected from these experiments were analyzed for statistical differences using a 95% confidence interval (p < 0.05). More details provided in SI Text.
Supplementary Material
Acknowledgments
This work was funded in part by NCI CCNE U54 CA119367 (SSG), NCI CCNE U54 U54 CA151459, NIBIB BRP 5-RO1-EBB000312 (SSG), ICMIC P50 CA114747 (SSG) and Canary Foundation (SSG), U54 CA105296 NCI NTR (CHC). C. Zavaleta was supported from a Research Supplement to Promote Diversity in Health-Related Research through CCNE U54 CA119367. We would like to thank Ian Walton and Michael Natan at Cabot Security Systems (formerly Oxonica Inc.) for helpful discussions.
Footnotes
Supporting Information is available from the Wiley Online Library or from the author.
Contributor Information
Dr. Cristina L. Zavaleta, Molecular Imaging Program at Stanford, Department of Radiology and Bio-X Program, 318 Campus Drive, Stanford CA, 94305, USA, Ph: 650–725-2309; Fax: 650–724-4948
Dr. Keith B. Hartman, Molecular Imaging Program at Stanford, Department of Radiology and Bio-X Program, 318 Campus Drive, Stanford CA, 94305, USA, Ph: 650–725-2309; Fax: 650–724-4948
Dr. Zheng Miao, Molecular Imaging Program at Stanford, Department of Radiology and Bio-X Program, 318 Campus Drive, Stanford CA, 94305, USA, Ph: 650–725-2309; Fax: 650–724-4948
Dr. Michelle L. James, Molecular Imaging Program at Stanford, Department of Radiology and Bio-X Program, 318 Campus Drive, Stanford CA, 94305, USA, Ph: 650–725-2309; Fax: 650–724-4948
Paul Kempen, Materials Science and Engineering Department, Stanford University 416, Escondido Mall, Building 550, 94305-2205, USA.
Dr. Avnesh S. Thakor, Molecular Imaging Program at Stanford, Department of Radiology and Bio-X Program, 318 Campus Drive, Stanford CA, 94305, USA, Ph: 650–725-2309; Fax: 650–724-4948
Carsten H. Nielsen, Molecular Imaging Program at Stanford, Department of Radiology and Bio-X Program, 318 Campus Drive, Stanford CA, 94305, USA, Ph: 650–725-2309; Fax: 650–724-4948. Cluster for Molecular Imaging & Department of Clinical Physiology, Nuclear Medicine and PET, Rigshospitalet, University of Copenhagen, Blegdamsvej 9, DK-2100 Copenhagen Ø, Denmark
Prof. Robert Sinclair, Materials Science and Engineering Department, Stanford University 416, Escondido Mall, Building 550, 94305-2205, USA
Prof. Zhen Cheng, Molecular Imaging Program at Stanford, Department of Radiology and Bio-X Program, 318 Campus Drive, Stanford CA, 94305, USA, Ph: 650–725-2309; Fax: 650–724-4948
Prof. Sanjiv S. Gambhir, Email: sgambhir@stanford.edu, Molecular Imaging Program at Stanford, Department of Radiology and Bio-X Program, 318 Campus Drive, Stanford CA, 94305, USA, Ph: 650–725-2309; Fax: 650–724-4948. Department of Bioengineering, Stanford University, 318 Campus Drive, Stanford, CA, 94305, USA
References
- 1.Harris DC, Bertolucci MD. Symmetry and Spectroscopy: An Introduction to Vibrational and Electronic Spectroscopy. Dover Publications; Mineola, NY: 1989. p. 550. [Google Scholar]
- 2.Haka AS, Shafer-Peltier KE, Fitzmaurice M, Crowe J, Dasari RR, Feld MS. PNAS. 2005;102:12371. doi: 10.1073/pnas.0501390102. [DOI] [PMC free article] [PubMed] [Google Scholar]
- 3.Kanter EM, Vargis E, Majumder S, Keller MD, Woeste E, Rao GG, Mahadevan-Jansen A. J Biophotonics. 2009;2:81. doi: 10.1002/jbio.200910001. [DOI] [PMC free article] [PubMed] [Google Scholar]
- 4.Maheedhar K, Bhat RA, Malini R, Prathima NB, Keerthi P, Kushtagi P, Krishna CM. Photomed Laser Surg. 2008;26:83. doi: 10.1089/pho.2007.2128. [DOI] [PubMed] [Google Scholar]
- 5.Motz JT, Gandhi SJ, Scepanovic OR, Haka AS, Kramer JR, Dasari RR, Feld MS. J Biomed Opt. 2005;10:031113. doi: 10.1117/1.1920247. [DOI] [PubMed] [Google Scholar]
- 6.Keren S, Zavaleta C, Cheng Z, de la Zerda A, Gheysens O, Gambhir SS. Proc Natl Acad Sci USA. 2008;105:5844. doi: 10.1073/pnas.0710575105. [DOI] [PMC free article] [PubMed] [Google Scholar]
- 7.Shachaf CM, Elchuri SV, Koh AL, Zhu J, Nguyen LN, Mitchell DJ, Zhang J, Swartz KB, Sun L, Chan S, Sinclair R, Nolan GP. PLoS One. 2009;4:e5206. doi: 10.1371/journal.pone.0005206. [DOI] [PMC free article] [PubMed] [Google Scholar]
- 8.Song C, Wang Z, Zhang R, Yang J, Tan X, Cui Y. Biosens Bio-electron. 2009;25:826. doi: 10.1016/j.bios.2009.08.035. [DOI] [PubMed] [Google Scholar]
- 9.Yu KN, Lee SM, Han JY, Park H, Woo MA, Noh MS, Hwang SK, Kwon JT, Jin H, Kim YK, Hergenrother PJ, Jeong DH, Lee YS, Cho MH. Bioconjug Chem. 2007;18:1155. doi: 10.1021/bc070011i. [DOI] [PubMed] [Google Scholar]
- 10.Qian X, Peng XH, Ansari DO, Yin-Goen Q, Chen GZ, Shin DM, Yang L, Young AN, Wang MD, Nie S. Nat Bio-technol. 2008;26:83. doi: 10.1038/nbt1377. [DOI] [PubMed] [Google Scholar]
- 11.Zavaleta C, de la Zerda A, Liu Z, Keren S, Cheng Z, Schipper M, Chen X, Dai H, Gambhir SS. Nano Lett. 2008;8:2800. doi: 10.1021/nl801362a. [DOI] [PMC free article] [PubMed] [Google Scholar]
- 12.Soetikno RM, Kaltenbach T, Rouse RV, Park W, Maheshwari A, Sato T, Matsui S, Friedland S. J Amer Med Assoc. 2008;299:1027. doi: 10.1001/jama.299.9.1027. [DOI] [PubMed] [Google Scholar]
- 13.Doering WE, Piotti ME, Natan MJ, Freeman RG. Adv Mater. 2007;19:3100. [Google Scholar]
- 14.Sha MY, Xu H, Natan MJ, Cromer R. J Am Chem Soc. 2008;130:17214. doi: 10.1021/ja804494m. [DOI] [PMC free article] [PubMed] [Google Scholar]
- 15.Zavaleta CL, Smith BR, Walton I, Doering W, Davis G, Shojaei B, Natan MJ, Gambhir SS. Proc Natl Acad Sci USA. 2009;106:13511. doi: 10.1073/pnas.0813327106. [DOI] [PMC free article] [PubMed] [Google Scholar]
- 16.Fleischmann M, Hendra PJ, McQuillan AJ. Chem Phys Lett. 1974;26:163. [Google Scholar]
- 17.Debbage P, Jaschke W. Histochem Cell Biol. 2008;130:845. doi: 10.1007/s00418-008-0511-y. [DOI] [PubMed] [Google Scholar]
- 18.McNeil SE. Wiley Interdiscip Rev Nanomed Nanobiotechnol. 2009;1:264. doi: 10.1002/wnan.6. [DOI] [PubMed] [Google Scholar]
- 19.Medintz IL, Mattoussi H, Clapp AR. Int J Nanomed. 2008;3:151. doi: 10.2147/ijn.s614. [DOI] [PMC free article] [PubMed] [Google Scholar]
- 20.Powell AC, Paciotti GF, Libutti SK. Methods Mol Biol. 2010;624:375. doi: 10.1007/978-1-60761-609-2_25. [DOI] [PubMed] [Google Scholar]
- 21.Smith BR, Cheng Z, De A, Rosenberg J, Gambhir SS. Small. 2010;6:2222. doi: 10.1002/smll.201001022. [DOI] [PMC free article] [PubMed] [Google Scholar]
- 22.Schipper ML, Cheng Z, Lee SW, Bentolila LA, Iyer G, Rao J, Chen X, Wu AM, Weiss S, Gambhir SS. J Nucl Med. 2007;48:1511. doi: 10.2967/jnumed.107.040071. [DOI] [PMC free article] [PubMed] [Google Scholar]
- 23.Sadauskas E, Jacobsen NR, Danscher G, Stoltenberg M, Vogel U, Larsen A, Kreyling W, Wallin H. Chem Cent J. 2009;3:16. doi: 10.1186/1752-153X-3-16. [DOI] [PMC free article] [PubMed] [Google Scholar]
- 24.Yu YLL LE, Ong CN, Tan Y, Balasubramaniam KS, Hartono D, Shui G, Wenk MR, Ong WY. Nanotoxicology. 2007;1:235. [Google Scholar]
- 25.Adiseshaiah PP, Hall JB, McNeil SE. Wiley Interdiscip Rev Nanomed Nanobiotechnol. 2010;2:99. doi: 10.1002/wnan.66. [DOI] [PubMed] [Google Scholar]
- 26.Dobrovolskaia MA, McNeil SE. Nat Nanotechnol. 2007;2:469. doi: 10.1038/nnano.2007.223. [DOI] [PubMed] [Google Scholar]
- 27.Schipper ML, Nakayama-Ratchford N, Davis CR, Kam NW, Chu P, Liu Z, Sun X, Dai H, Gambhir SS. Nat Nanotechnol. 2008;3:216. doi: 10.1038/nnano.2008.68. [DOI] [PubMed] [Google Scholar]
- 28.Stern ST, McNeil SE. Toxicol Sci. 2008;101:4. doi: 10.1093/toxsci/kfm169. [DOI] [PubMed] [Google Scholar]
- 29.Xie G, Sun J, Zhong G, Shi L, Zhang D. Arch Toxicol. 2009;84:183. doi: 10.1007/s00204-009-0488-x. [DOI] [PubMed] [Google Scholar]
- 30.Yong KT, Roy I, Ding H, Bergey EJ, Prasad PN. Small. 2009;5:1997. doi: 10.1002/smll.200900547. [DOI] [PubMed] [Google Scholar]
- 31.Balasubramanian SK, Jittiwat J, Manikandan J, Ong CN, Yu LE, Ong WY. Biomaterials. 2010;31:034. doi: 10.1016/j.biomaterials.2009.11.079. [DOI] [PubMed] [Google Scholar]
- 32.Goel R, Shah N, Visaria R, Paciotti GF, Bischof JC. Nano-medicine (Lond) 2009;4:401. doi: 10.2217/nnm.09.21. [DOI] [PMC free article] [PubMed] [Google Scholar]
- 33.Lin P, Chen JW, Chang LW, Wu JP, Redding L, Chang H, Yeh TK, Yang CS, Tsai MH, Wang HJ, Kuo YC, Yang RS. Environ Sci Technol. 2008;42:6264. doi: 10.1021/es800254a. [DOI] [PubMed] [Google Scholar]
- 34.Cappellani A, Di Vita M, Zanghi A, Veroux P, Cavallaro A, Lo Menzo E, Cacopardo B, Canzonieri V, Murabito P, Tirelli U, Berretta M. Front Biosci (Schol Ed) 2010;2:422. doi: 10.2741/s75. [DOI] [PubMed] [Google Scholar]
- 35.Hsiung PL, Hardy J, Friedland S, Soetikno R, Du CB, Wu AP, Sahbaie P, Crawford JM, Lowe AW, Contag CH, Wang TD. Nat Med. 2008;14:454. doi: 10.1038/nm1692. [DOI] [PMC free article] [PubMed] [Google Scholar]
- 36.Ngo TT. J Biochem Biophys Methods. 1986;12:349. doi: 10.1016/0165-022x(86)90072-2. [DOI] [PubMed] [Google Scholar]
- 37.Knoess C, Siegel S, Smith A, Newport D, Richerzhagen N, Winkeler A, Jacobs A, Goble RN, Graf R, Wienhard K, Heiss WD. Eur J Nucl Med Mol Imaging. 2003;30:737. doi: 10.1007/s00259-002-1052-6. [DOI] [PubMed] [Google Scholar]
- 38.Loening AM, Gambhir SS. Mol Imaging. 2003;2:131. doi: 10.1162/15353500200303133. [DOI] [PubMed] [Google Scholar]
- 39.Haaland DM, Easterling RG. Appl Spec. 1980;34:539. [Google Scholar]
- 40.Pelletier MJ. Appl Spect. 2003;57:20A. doi: 10.1366/000370203321165133. [DOI] [PubMed] [Google Scholar]
Associated Data
This section collects any data citations, data availability statements, or supplementary materials included in this article.