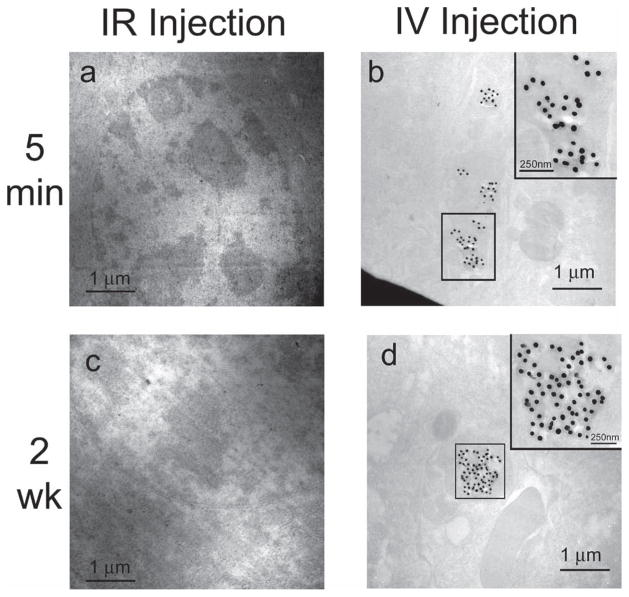
Figure 4.
TEM images of SERS nanoparticle accumulation in liver tissue at 5 min and 2 weeks post injection of SERS nanoparticles. a) Bright-field scanning TEM (STEM) image of liver tissue from mouse injected IR at 5 min. b) Bright-field STEM image of liver tissue from mouse injected IV at 5 min. Inset is a magnified view of the SERS nanoparticles boxed in the STEM image (scale bar = 250 nm). c) Bright-field STEM image of liver tissue from mouse injected IR at 2 weeks. d) Bright-field STEM image of liver tissue from mouse injected IV at 2 weeks. Inset is a magnified view of the SERS nanoparticles boxed in the STEM image (scale bar = 250 nm). Notice the absence of SERS nanoparticles in the liver tissue from the mice that received an IR injection, as shown in panels (a) and (c).

