

Abstract
Exosomes are endosome-derived membrane vesicles carrying proteins and nucleic acids that are involved in cellular functions such as intercellular communication, protein and RNA secretion, and antigen presentation. Therefore, exosomes serve as potential biomarkers for many diseases including cancer. Because exosomes are difficult to enrich or purify from biofluids, quantification of exosomes is tedious and inaccurate. Here, we present a real-time, label-free, and quantitative method to detect and characterize tumor-derived exosomes without enrichment or purification. Utilizing surface plasmon resonance imaging (SPRi) in combination with antibody microarrays specific to the extracellular domains of exosome membrane proteins, exosomes in tumor cell culture medium can be quantitatively detected. We found a positive correlation between the metastatic potential of tumor cell lines and exosome secretion. This method provides an easy, efficient, and novel way to detect exosome secretion and thus an avenue toward the diagnosis and prognosis prediction of cancer.
Exosomes are small (30–100 nm in diameter) membrane vesicles secreted by various normal and tumor cells.1 They are formed by inward budding of endosome membranes to the intraluminal side, generating multivesicular bodies (MVBs) with exosomes enclosed inside. The MVBs then fuse with the plasma membrane and release the intraluminal exosomes to the extracellular environment.2 As a result of this remodeling process, exosomes carry membrane proteins (e.g., tetraspanin (CD9, CD63, CD81) and heat shock protein (HSP70)), cytosol proteins, mRNA, and miRNA, and participate in biological functions such as intercellular communication, protein and RNA secretion, and antigen presentation.1a,3 Recently, exosomes have drawn a lot of attention as a source of tumor antigens for dendritic cells (DCs) to induce antitumor immune response.1b,4 However, accumulating evidence has shown that tumor-derived exosomes can also suppress antitumor immune response by impairing the function of lymphocytes5 or by inducing their apoptosis.6 Moreover, exosomes are found to promote angiogenesis,7 to contribute to cancer progression and metastasis,8 and to serve as potential cancer biomarkers. Therefore, there is an increasing need for developing effective and practical method to detect and quantify tumor-derived exosomes for cancer diagnosis and prognosis prediction.
Conventional methods to purify and characterize exosomes in cell culture supernatant (CCS) and body fluids are based on differential ultracentrifugation alone9 or in combination with ultrafiltration and density gradient separation,10 followed by electron microscopy,11 western blot,12 or enzyme-linked immunosorbent assay (ELISA).10c These methods tend to be time-consuming and inefficient.13 Newly reported methods include the isolation of exosome by immunoaffinity beads followed by flow cytometry14 or fluorescence-activated cell sorting (FACS) anaysis.15 Yet, convenient, direct, and quantitative measurement techniques are still largely needed.13b,16 As demonstrated by the immunoaffinity bead method, exosomes can be captured by antibodies specific to their transmembrane proteins, but this method does not take advantage of the fact that exosomes are much larger than soluble proteins or protein complexes and can therefore be distinguished from them in body fluids. In this respect, surface plasmon resonance imaging (SPRi) is one such convenient biosensing technology that is mass-sensitive.
Surface plasmon resonance (SPR) is a label-free, real-time sensor technique to detect molecular interactions occurring in proximity to a precious metal (gold/silver) surface based on monitoring changes in refractive index resulting from molecular binding, which causes a thickness increase of the adsorbed layer.17 In SPRi, a charge-coupled device (CCD) camera is used for reflection detection and surface imaging. At a fixed angle of incidence, the detected reflection changes can be transformed into the refractive index changes resulting from molecular binding. In this way, both sensorgrams (i.e., resonance signal vs time) and images of the sensor chip can be recorded, allowing high-throughput analysis of up to 1000 interactions (Figure 1).18 Typical SPR instruments are sensitive to binding events occurring within 200 nm of the surface.19 Therefore, particles of around 100 nm, such as exosomes, are perfectly suited to SPRi detection. When we were preparing this paper, Im et al.20 reported an exosome assay utilizing transmission SPR through periodic nanohole arrays functionalized with antibodies specific to exosome surface proteins. Utilizing this method, they identified exosomes purified from ovarian cancer cell culture and exosomes in ascites from ovarian cancer patients.
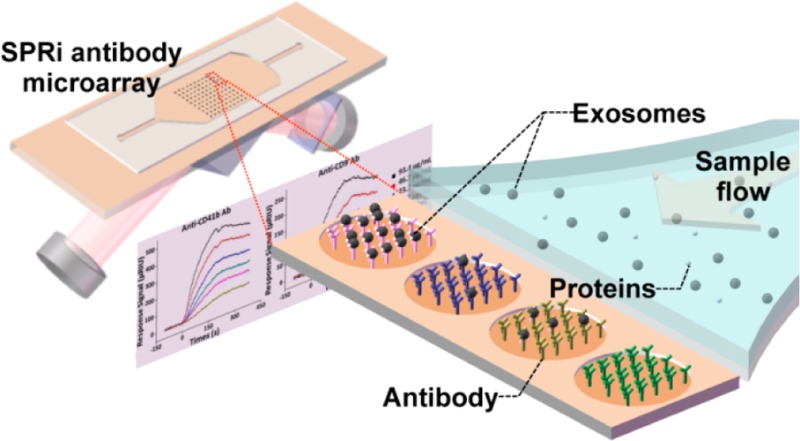
Figure 1.

Schematic view of SPRi in combination with antibody microarray to capture and detect exosomes in cell culture supernatant. Antibodies specific to exosome transmembrane proteins were printed on the gilded gold chip. The optical path from the laser passes through the coupling prism at a fixed angle of incidence, and the reflection is recorded by a CCD camera. Upon injection of sample into the flow cell, exosomes can be captured by antibodies on the chip, resulting in changes in the refractive index and therefore changes in the reflection intensities, which is monitored by the CCD camera.
Here, we used conventional SPRi in combination with antibody microarrays to detect and quantify exosomes in CCS. Antibodies specific to exosome transmembrane proteins including tetraspanins (e.g., CD9),1 glycoprotein CD41b,21 and tyrosine kinase receptor MET8a were printed and immobilized on the gold-coated glass sensor chip (Figure 1). Using this sensor chip, we detected exosomes in CCS from human hepatoma cell lines MHCC97H/L and mouse melanoma cell lines B16-F1/10 without purification, and we monitored changes in the exosome abundance in CCS. We also observed a positive correlation between the metastatic potential of the cell lines and the exosome level. This method provides an efficient way for exosome detection and monitoring, and may be valuable for application in biological and clinical studies.
Experimental Section
Antibodies
Antibodies used in this study are as follows. Anti-extracellular part: mouse anti-human CD9 (MAB1880, R&D), rabbit anti-human CD63 (MAB5048, R&D), mouse anti-human CD41b (555468, BD), mouse anti-human CD81 (MAB4165, R&D), mouse anti-human CD82 (MAB4616, R&D), mouse anti-human E-cadherin (AB8993, Abcam), and mouse anti-human EpCAM (MAB9601, R&D). Anti-intracellular part: rabbit anti-human CD9 N-term (AP1482a, Abgent), rabbit anti-human CD81 C-term (AP6631b, Abgent), anti-CD82 C-term (AB66400, Abcam), and mouse anti-human E-cadherin C-term (AB76055, Abcam). Anti-mouse IgG (557273, BD Biosciences), mouse anti-human MET (5631, Cell Signaling), and HRP-conjugated secondary antibodies (Jackson Immunoresearch) were also used.
Cell Culture
Human hepatocellular carcinoma cell lines (MHCC97L, MHCC97H) and mouse melanoma cell lines (B16-F1, B16-F10) were cultured in Dulbecco’s modified Eagle medium (DMEM) (Gibco, Karlsruhe, Germany) supplemented with 10% (v/v) fetal bovine serum (FBS) (Hyclone, Gibco), 50 units penicillin/50 mg streptomycin, 20 mM HEPES, 50 mM 2-mercaptoethanol, 1 mM sodium pyruvate, and 0.1 mM nonessential amino acids (Gibco) at 37 °C (5% CO2). The cells were split every 2 to 3 days under sterile conditions.
Exosome Isolation and CCS Filtering
Cells (1 × 10⁸ cells) were washed twice with 30 mL DMEM and cultured in vesicle-depleted medium (100 mL DMEM with or without depleted FBS) for 48 h. Exosomes were isolated from CCS using the standard ultracentrifugation protocol9b,22 with modification. Briefly, cell culture medium (DMEM without FBS) was centrifuged at 500g for 5 min followed by 2000g for 10 min and then 12 000g for 10 min at 4 °C to remove intact cells, cell debris, and large microvesicles. The supernatant was collected as CCS. CCS was then centrifuged at 100 000g for 120 min to sediment exosomes. The sediment exosomes were resuspended in PBS. In each exosome preparation, the concentration of total protein was quantified by BCA assay (Pierce Chemical, Rockford, IL, USA). CCS filtrate was obtained by passing the CCS (cultured in 10% depleted FBS in DMEM instead of serum-free DMEM) through a 300 kDa filter (Millipore, MA, USA).
Western Blot
Cells and exosomes were resuspended in ice-cold lysis buffer (0.5% NP-40, 20 mM Tris-Cl, pH 7.6, 250 mM NaCl, 3 mM EDTA, 3 mM EGTA, 1 mM sodium orthovanadate, 1 mM DTT, 10 mM PNPP, and 10 μg/mL aprotinin) for 30 min at 4 °C. Cell and exosome lysates were resolved by SDS-PAGE before being transferred to nitrocellulose membranes (Pall Corporation, Pensacola, FL). Nitrocellulose membranes were blocked with 5% (w/v) non-fat milk in TBST buffer (20 mM Tris-Cl, pH 7.6, 150 mM NaCl, and 0.1% Tween 20) for 60 min at room temperature. Primary antibodies were diluted (1:500) in TBST buffer containing 5% (w/v) non-fat dry milk and then applied to the membranes overnight at 4 °C. After washing with TBST three times, the membranes were incubated with peroxidase-conjugated secondary antibodies for 60 min at room temperature and then washed again. Immunoreactive bands were visualized by Super Signal chemiluminescence (Pierce Chemical, Rockford, IL).
Antibody Microarray Fabrication and Surface Plasmon Resonance Imaging (SPRi) Measurement
Antibodies were diluted to a final concentration of 0.5 mg/mL with PBS and printed onto the bare gold-coated (thickness 47 nm) PlexArray Nanocapture Sensor Chip (Plexera Bioscience, Seattle, WA, USA) at 40% humidity using SmartArrayer 48 microarray printer (CapitalBio, China). Each antibody was printed in replicate on the chip, and each spot contained 0.1 μL of antibody solution. The chip was incubated in 80% humidity at 4 °C overnight before being rinsed with 1× PBS for 30 min, 0.1× PBS for 10 min, and deionized water for 10 min. Following that, the chip was blocked with 5% (w/v) non-fat milk in PBS overnight and washed with 1× PBS for 30 min, 0.1× PBS for 10 min, and deionized water for 10 min before being dried under a stream of nitrogen prior to use.
SPRi measurements were performed with PlexAray HT (Plexera Bioscience, Seattle, WA, USA). Collimated light (660 nm) passes through the coupling prism, reflects off the SPR-active gold surface, and is received by the CCD camera. Buffers and samples were injected by a nonpulsatile piston pump into the 30 μL flow cell, which was mounted on the coupling prim. For each measurement cycle, PBS running buffer was first flowed through the surface at a constant rate of 2 μL/s to obtain a stable baseline, and then the sample was injected at 5 μL/s for binding; after binding, the surface was washed with PBS at 2 μL/s for 300 s and regenerated with 0.5% (v/v) H3PO4 at 2 μL/s for 300 s. All measurements were performed at 4 °C. The signal changes after binding and washing (in RIU) are recorded as the assay value.
Selected antibody-grafted regions in the SPR images were analyzed, and the average reflectivity variations of the chosen areas were plotted as a function of time. Real-time binding signals were recorded and analyzed by Data Analysis Module (DAM, Plexera Bioscience, Seattle, WA, USA).
Transmission Electron Microscope (TEM)
Twenty microliters (5 μg) of exosomes in PBS was placed onto carbon-coated EM grids and fixed for 20 min with 2% glutaraldehyde (Sigma, Deisenhofen, Germany) in 0.1 M phosphate buffer. Exosomes were stained by 2% uranyl acetate for 5 min. Samples were observed under a Philips CM120 electron microscope (FEI Company, Eindhoven, The Netherlands) equipped with a digital camera Keen View (SIS, Germany).
Results and Discussion
Identification of Purified Exosomes
We first determined whether the antibody microarray SPRi sensor chip could identify purified exosomes. Exosomes were purified from the CCS of human hepatoma cell line MHCC97H by ultracentrifugation. Morphologies of the purified exosomes were characterized by TEM, showing a mean diameter of ∼70 nm (Figure 2a), consistent with the size of reported exosomes.23 SPRi measurements were performed as illustrated in Figure 1. Antibodies specific to the widely reported exosome transmembrane proteins CD9, CD63, and CD82,1 the tumor-related transmembrane proteins CD41b,21 EpCAM,16a and E-cadherin,7b as well as the negative control anti-mouse IgG were printed on the sensor chip. Each antibody was printed at the same concentration of 0.5 mg/mL. The purified exosomes were injected into the flow cell at a concentration of 5 μg/mL and at a rate of 5 μL/s. Sensorgrams showed that all of the antibodies have much higher binding signals compared to that of the negative control anti-mouse IgG (red curve) (Figure 2b), indicating their binding with exosomes. Typically, the binding signals at the spots with anti-CD9 (cyan curve) and CD41b (purple curve) were extremely high, indicating that these two antibodies have a strong binding ability for exosomes from MHCC97H. This is reasonable considering that different classes of exosomes might exihibit distinct membrane protein profiles. Indeed, exosomes isolated by anti-A33- or anti-EpCAM-coated magnetic beads have been shown to have different compositions of membrane proteins, intracellular proteins, and nucleic acids.16a,24 The binding signal of anti-mouse IgG was slightly higher than the baseline due to nonspecific binding. The expression of CD9 and CD41b in the purified exosomes was verified by western blot, using MHCC97H cell lysates as a positive control (Figure 2c). These results suggested that the antibody microarray SPRi sensor chip was able to capture purified exosomes and to characterize their transmembrane protein profile.
Figure 2.
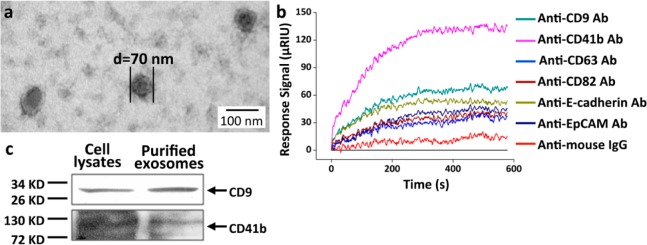
Characterization and identification of exosomes purified from MHCC97H cell CCS. (a) Transmission electron microscopy (TEM) characterization of purified exosomes. The mean diameter of exosomes was ∼70 nm. (b) Detection of purified exosomes through antibody microarray sensor chip. SPRi sensorgrams showing binding of exosomes to various antibodies: anti-CD9, CD41b, CD63, CD82, E-cadherin, EpCAM, and anti-mouse IgG. Reflective index (μRIU) changes are plotted as a function of time (s). Anti-mouse IgG was used as a negative control. (c) Western blot detection of the expression of CD9 and CD41b in exosomes. MHCC97H cell lysates were used as a positive control.
Identification of Exosomes in CCS without Purification
We then checked whether the antibody microarray SPRi sensor chip could identify exosomes in CCS directly without enrichment or purification. Exosomes contain various transmembrane proteins and cytosol contents; hence, they have much higher molecular weights compared to that of the free proteins in CCS and can therefore be removed from CCS by passing through a 300 kDa filter. We checked the existence of exosomes in unfiltered CCS and CCS filtrate by western blot, which revealed the expression of two exosome marker transmembrane proteins, CD9 and CD41b,25 in CCS using cell lysate as a positive control, whereas no bands were observed in CCS filtrate. These results indicated the existence of exosomes in CCS and the absence of exosomes in CCS filtrate (Figure 3a). We then compared SPRi binding signals of exosome-containing CCS, exosome-excluded CCS filtrate, and cell culture medium to anti-CD9 and anti-CD41b, which were demonstrated to have strong affinity to purified exosomes (Figure 2b,c). Anti-mouse IgG was used as a negative control. As expected, both anti-CD9 and anti-CD41b demonstrated significant signals for binding using CCS compared to that from CCS filtrate, and nearly no binding signal was observed using cell culture medium, indicating that exosomes in CCS were captured by these two antibodies (Figure 3b). There was still a noticeable binding signal generated from the filtered CCS with the anti-CD41b antibody (Figure 3b), suggesting that, besides exosomes, free CD41b protein might also be present in CCS. Another explanation is that there was nonspecific binding of filtered CCS to anti-CD41b antibody. The latter might be more plausible considering the western blot results that showed that anti-CD41b did not detect any band in CCS filtrate (Figure 3a).
Figure 3.

Direct identification of exosomes in CCS. (a) Detection of CD9 and CD41b in CCS and CCS filtrate by western blot. Cell lysates were used as a positive control. The proteins were concentrated by trichloroacetic acid (TCA) from CCS/CCS filtrate. (b) SPRi response signals of anti-CD9/CD41b and anti-mouse IgG to cell culture medium (DMEM), CCS, and CCS filtrate. The results are representative of three independent experiments. *p < 0.01 (Student’s t test). (c) Schematic representation of the biogenesis of exosomes. Exosomes originate from the inward budding of endosome membranes, generating multivesicular bodies (MVBs) with exosomes inside. The MVBs then fuse with the plasma membrane and release the intraluminal exosomes to the extracellular environment. (d) SPRi response signals of exosomes in CCS to antibodies specific to extracellular or intracellular domains of the transmembrane proteins CD9, CD81, CD82, and E-cadherin. Exosomes bound only to antibodies recognizing the extracellular domains, not to the ones recognizing the intracellular domains. The results are representative of three independent experiments. *p < 0.01 (Student’s t test).
It has been generally accepted that exosomes are formed by the inward budding of endosome membranes and are secreted through fusion with the cell membrane. As a result of this membrane remodeling, exosomes have the same membrane orientation as that of the parent cell. In other words, the extracellular domains of the parent cell transmembrane proteins are still exposed to the outside of the exosomes (Figure 3c).1a,3b,25a Using the antibody microarray SPRi sensor chip, we compared the binding of exosomes in CCS to the antibodies recognizing the intracellular or extracellular domains of the transmembrane proteins CD9, CD81, CD82, and E-cadherin. As expected, exosomes bound only to antibodies recognizing the extracellular domains, not to the ones recognizing the intracellular domains (Figure 3d), indicating that the extracellular domains face the outside of the exosome, which means that the exosomes have the same membrane orientation as that of the parent cell, supporting the inward budding biogenesis pathway of exosomes (Figure 3c). These results also supported the notion that the binding signal on SPRi originated from exosome membrane proteins, not from the free protein or membrane debris in CCS.
Monitoring the Regulation of Exosome Secretion
We further determined whether the SPRi antibody microarray was a sensitive method to monitor the changes of exosome levels in CCS by modulating exosome secretion in MHCC97H cells using siRNA-Rab27a and monensin. Rab27a is an important gene in the exosome secretion pathway whose inhibition has been reported to decrease the secretion of exosomes in both HeLa cervical cancer cells and MAD-MB-231 breast cancer cells, as determined by binding to antibody-coated beads followed by flow cytometry, and by nanoparticle tracking analysis.15c,26 Here, we used siRNA to knockdown the expression of Rab27a in order to suppress exosome secretion. As expected, the binding signal of anti-CD9 and anti-CD41b to CCS from cells transfected with siRNA-Rab27a was significantly lower than that from cells transfected with negative control siRNA (siRNA-NC) (Figure 4a), indicating decreased exosome secretion with siRNA-Rab27a. Monensin is a Na+, K+-exchanger that was reported to increase exosome secretion in K562 cells, a human erythroleukemia cell line.27 Here, we showed that after monensin treatment the binding signals of anti-CD9 and anti-CD41b to CCS was significantly higher than that from the ones treated with the solvent control, indicating elevated exosome secretion after monensin treatment. This was further confirmed by western blot, which showed significant bands of both CD9 and CD41b in purified exosomes from MHCC97H cells with monensin treatment compared to that from the ones without treatment (Figure 4c). These results demonstrate the validity of the antibody microarray SPRi sensor chip to monitor exosome level changes in CCS.
Figure 4.

Regulation of exosome secresion. (a) Exosome secresion was suppressed by siRNA-Rab27a. SPRi response signals from anti-CD9 and anti-CD41b decreased with siRNA-Rab27a, using siRNA-NC as a negative control. Lipofectamine 2000 was used for the transfection. (b) Exosome secresion was increased by monensin treatment. The cells were treated with monensin at a concentration of 1 μM and incubated for 48 h before being detected by SPRi. Methanol, which was used to dilute monensin, was used as a negative control. SPRi response signals from anti-CD9 and anti-CD41b increased with monensin treatment. The results are representative of three independent experiments. *p < 0.01 (Student’s t test). (c) Detection of CD9 and CD41b in purified exosomes from MHCC97H cells with (+) or without (−) monensin treatment by western blot.
SPRi sensitivity is dependent on target analyte mass, immobilized ligand density, and analyte–ligand affinity.28 The lipid mass of exosomes provides binding signals that are sensitive enough for SPRi to detect and possibly quantify exosomes. This was proven by Jung et al.,29 who quantified biotin-functionalized vesicles bound to a streptavidin-coated chip from the SPR signal based on the mass of lipids in the vesicles using a method described elsewhere18,30 and showed that the SPR signal was proportional to the number of bound vesicles per unit area. Here, we used the same method according to eqs 10 and 11 in ref (30b) to quantify exosomes captured by antibody microarray chip. Basically, the measured SPRi signals were converted to effective adlayer thickness using the known refractive index of the solvent and the adsorbate and the calibration of SRPi signals verus bulk refractive index changes. The estimated effective adlayer thickness was then converted to surface coverage (number of molecules per unit area) using the molar volume of the adsorbate in the same buffer. Unlike the vesicles in Jung et al.29 that contained only one type of lipid, exosomes are composed of various lipids, among which phospholipids such as phosphatidyl choline (PC) were the most abundant.31 Therefore, we estimated the surface coverage of exosomes assuming that they were composed of DOPC whose refractive index was estimated to be 1.49,32 and the volume was 0.92 mL/g lipids.33 The SPRi signal of ∼28 μRIU (Figure 4a) corresponded to ∼1.83 × 10¹² lipids/cm2, or ∼4.87 × 10⁷ exosomes/cm2 based on the diameter (∼70 nm) of exosomes.
The Highly Metastatic Cell Line Secreted More Exosomes than the Poorly Metastatic One
Tumor metastasis is a leading cause of cancer death. However, the mechanism of tumor metastasis is largely unknown. It has been reported that exosomes participate in the process of tumor metastasis.4c,34 To test if exosome levels related to metastasis can be observed by the antibody microarray SRPi sensor chip, we compared two human hepatocellular carcinoma cell lines with different metastatic potentials, MHCC97H and MHCC97L. The former is highly metastatic compared to the latter.35 We found that both anti-CD9 and anti-CD41b had much higher SPRi binding signals to CCS from MHCC97H compared to that from MHCC97L, indicating that MHCC97H secreted more exosomes into CCS than MHCC97L. We then isolated exosomes from the same number of MHCC97H and MHCC97L cells and used western blot to quantify CD9 and CD41b. As expected, both proteins had higher expression levels in the isolated exosomes from MHCC97H than in those from MHCC97L (Figure 5b,c), in accordance with the SPRi results. Additionally, two melanoma cell lines, B16-F1 and B16-F10, were analyzed by SPRi using an anti-CD9/CD41b/MET array. B16-F10 has been reported to be highly metastatic compared to B16-F1. Moreover, exosomes secreted from B16-F10 have much higher levels of tyrosine kinase reporter MET than those from B16-F1.8a As expected, both anti-CD9 and anti-CD41b had higher binding signals to CCS from B16-F10 compared to that from B16-F1 (Figure 5d), which is in agreement with previous reports8a as well as with the trend observed with MHCC97H and MHCC97L whereby highly metastatic cells secreted more exosomes than the poorly metastatic ones. The binding signal of anti-MET to CCS from B16-F10 was also much higher than the that from B16-F1 (Figure 5d), confirming a higher level of MET in exosomes from B16-F10. These results not only reveal a positive correlation between exosome secretion and metastatic potential but also prove the capability of this method to test cancer metastasis, proposing the possible application of this method for clinical use.
Figure 5.

Correlation between exosome secretion and metastatic potential. (a) SPRi response signals from anti-CD9 and anti-CD41b were higher in CCS from MHCC97H than that from MHCC97L. (b) Western blot detection of CD9 and CD41b in exosomes secreted from MHCC97H and MHCC97L cells. Exosomes were isolated from the same number (5 × 10⁷) of MHCC97H and MHCC97L cells. The purified exosomes were resuspended in lysis buffer and analyzed by western blot. (c) Quantification of the relative protein levels from the gray scan of the western blot in panel b. The expression level of each protein in MHCC97H was treated as 100, and the relative expression level in MHCC97L cells was calculated accordingly. (d) SPRi response signals of anti-CD9/CD41b/MET were higher in CCS from B16-F10 than in that from B16-F1. All histograms are representative of three independent experiments. *p < 0.01 (Student’s t test).
Conclusions
In this study, we showed a real-time, label-free, and quantitative method to detect exosomes in CCS using SPRi in combination with antibody microarrays specific to exosome transmembrane proteins. Using this method, changes in exosome levels in CCS can be monitored. A positive association between exosome secretion and metastatic potential was also observed. This method provides an avenue toward monitoring the progression and predicting the prognosis of cancer.
Acknowledgments
This work was supported by the International Cooperation Project (0102010DFB33880), National Natural Science Foundation of China (31270875), State Key Development Program for Basic Research of China (2011CB915502), and Center for Systems Biology (2p50GM076547).
Author Contributions
# L.Z., K.W., and J.C. contributed equally to this work.
The authors declare no competing financial interest.
Funding Statement
National Institutes of Health, United States
References
- a Thery C.; Zitvogel L.; Amigorena S. Nat. Rev. Immunol. 2002, 2, 569–79. [DOI] [PubMed] [Google Scholar]; b Andre F.; Schartz N. E.; Chaput N.; Flament C.; Raposo G.; Amigorena S.; Angevin E.; Zitvogel L. Vaccine 2002, 20, A28–31. [DOI] [PubMed] [Google Scholar]
- a Harding C.; Heuser J.; Stahl P. J. Cell Biol. 1983, 97, 329–39. [DOI] [PMC free article] [PubMed] [Google Scholar]; b Pan B. T.; Teng K.; Wu C.; Adam M.; Johnstone R. M. J. Cell Biol. 1985, 101, 942–8. [DOI] [PMC free article] [PubMed] [Google Scholar]
- a Schorey J. S.; Bhatnagar S. Traffic 2008, 9, 871–881. [DOI] [PMC free article] [PubMed] [Google Scholar]; b Thery C.; Ostrowski M.; Segura E. Nat. Rev. Immunol. 2009, 9, 581–593. [DOI] [PubMed] [Google Scholar]
- a Zitvogel L.; Regnault A.; Lozier A.; Wolfers J.; Flament C.; Tenza D.; Ricciardi-Castagnoli P.; Raposo G.; Amigorena S. Nat. Med. 1998, 4, 594–600. [DOI] [PubMed] [Google Scholar]; b Wolfers J.; Lozier A.; Raposo G.; Regnault A.; Thery C.; Masurier C.; Flament C.; Pouzieux S.; Faure F.; Tursz T.; Angevin E.; Amigorena S.; Zitvogel L. Nat. Med. 2001, 7, 297–303. [DOI] [PubMed] [Google Scholar]; c Andre F.; Schartz N. E.; Movassagh M.; Flament C.; Pautier P.; Morice P.; Pomel C.; Lhomme C.; Escudier B.; Le Chevalier T.; Tursz T.; Amigorena S.; Raposo G.; Angevin E.; Zitvogel L. Lancet 2002, 360, 295–305. [DOI] [PubMed] [Google Scholar]; d Chaput N.; Schartz N. E.; Andre F.; Zitvogel L. Adv. Exp. Med. Biol. 2003, 532, 215–21. [DOI] [PubMed] [Google Scholar]
- a Clayton A.; Mitchell J. P.; Court J.; Mason M. D.; Tabi Z. Cancer Res. 2007, 67, 7458–66. [DOI] [PubMed] [Google Scholar]; b Liu C.; Yu S.; Zinn K.; Wang J.; Zhang L.; Jia Y.; Kappes J. C.; Barnes S.; Kimberly R. P.; Grizzle W. E.; Zhang H. G. J. Immunol. 2006, 176, 1375–85. [DOI] [PubMed] [Google Scholar]; c Valenti R.; Huber V.; Filipazzi P.; Pilla L.; Sovena G.; Villa A.; Corbelli A.; Fais S.; Parmiani G.; Rivoltini L. Cancer Res. 2006, 66, 9290–8. [DOI] [PubMed] [Google Scholar]; d Ashiru O.; Boutet P.; Fernandez-Messina L.; Aguera-Gonzalez S.; Skepper J. N.; Vales-Gomez M.; Reyburn H. T. Cancer Res. 2010, 70, 481–9. [DOI] [PMC free article] [PubMed] [Google Scholar]
- a Ponnambalam S.; Baldwin S. A. Mol. Membr. Biol. 2003, 20, 129–39. [DOI] [PubMed] [Google Scholar]; b Andreola G.; Rivoltini L.; Castelli C.; Huber V.; Perego P.; Deho P.; Squarcina P.; Accornero P.; Lozupone F.; Lugini L.; Stringaro A.; Molinari A.; Arancia G.; Gentile M.; Parmiani G.; Fais S. J. Exp. Med. 2002, 195, 1303–16. [DOI] [PMC free article] [PubMed] [Google Scholar]
- a Skog J.; Wurdinger T.; van Rijn S.; Meijer D. H.; Gainche L.; Sena-Esteves M.; Curry W. T. Jr.; Carter B. S.; Krichevsky A. M.; Breakefield X. O. Nat. Cell Biol. 2008, 10, 1470–6. [DOI] [PMC free article] [PubMed] [Google Scholar]; b Park J. E.; Tan H. S.; Datta A.; Lai R. C.; Zhang H.; Meng W.; Lim S. K.; Sze S. K. Mol. Cell. Proteomics 2010, 9, 1085–99. [DOI] [PMC free article] [PubMed] [Google Scholar]
- a Peinado H.; Aleckovic M.; Lavotshkin S.; Matei I.; Costa-Silva B.; Moreno-Bueno G.; Hergueta-Redondo M.; Williams C.; Garcia-Santos G.; Ghajar C.; Nitadori-Hoshino A.; Hoffman C.; Badal K.; Garcia B. A.; Callahan M. K.; Yuan J.; Martins V. R.; Skog J.; Kaplan R. N.; Brady M. S.; Wolchok J. D.; Chapman P. B.; Kang Y.; Bromberg J.; Lyden D. Nat. Med. 2012, 18, 883–91. [DOI] [PMC free article] [PubMed] [Google Scholar]; b Barcellos-Hoff M. H. J. Mammary Gland Biol. Neoplasia 2013, 18, 3–13. [DOI] [PubMed] [Google Scholar]; c Pap E.; Pallinger E.; Falus A. Crit. Rev. Oncol. Hematol. 2011, 79, 213–23. [DOI] [PubMed] [Google Scholar]; d Al-Nedawi K.; Meehan B.; Micallef J.; Lhotak V.; May L.; Guha A.; Rak J. Nat. Cell Biol. 2008, 10, 619–24. [DOI] [PubMed] [Google Scholar]; e Somasundaram R.; Herlyn M. Nat. Med. 2012, 18, 853–4. [DOI] [PubMed] [Google Scholar]; f Jung T.; Castellana D.; Klingbeil P.; Cuesta Hernandez I.; Vitacolonna M.; Orlicky D. J.; Roffler S. R.; Brodt P.; Zoller M. Neoplasia 2009, 11, 1093–105. [DOI] [PMC free article] [PubMed] [Google Scholar]
- a Raposo G.; Nijman H. W.; Stoorvogel W.; Liejendekker R.; Harding C. V.; Melief C. J.; Geuze H. J. J. Exp. Med. 1996, 183, 1161–72. [DOI] [PMC free article] [PubMed] [Google Scholar]; b Mathias R. A.; Lim J. W.; Ji H.; Simpson R. J. Methods Mol. Biol. 2009, 528, 227–42. [DOI] [PubMed] [Google Scholar]
- a Thery C.; Boussac M.; Veron P.; Ricciardi-Castagnoli P.; Raposo G.; Garin J.; Amigorena S. J. Immunol. 2001, 166, 7309–18. [DOI] [PubMed] [Google Scholar]; b Ji H.; Erfani N.; Tauro B. J.; Kapp E. A.; Zhu H. J.; Moritz R. L.; Lim J. W.; Simpson R. J. Electrophoresis 2008, 29, 2660–71. [DOI] [PubMed] [Google Scholar]; c Lamparski H. G.; Metha-Damani A.; Yao J. Y.; Patel S.; Hsu D. H.; Ruegg C.; Le Pecq J. B. J. Immunol. Methods 2002, 270, 211–26. [DOI] [PubMed] [Google Scholar]; d Cantin R.; Diou J.; Belanger D.; Tremblay A. M.; Gilbert C. J. Immunol. Methods 2008, 338, 21–30. [DOI] [PubMed] [Google Scholar]; e Escola J. M.; Kleijmeer M. J.; Stoorvogel W.; Griffith J. M.; Yoshie O.; Geuze H. J. J. Biol. Chem. 1998, 273, 20121–7. [DOI] [PubMed] [Google Scholar]
- Wubbolts R.; Leckie R. S.; Veenhuizen P. T.; Schwarzmann G.; Mobius W.; Hoernschemeyer J.; Slot J. W.; Geuze H. J.; Stoorvogel W. J. Biol. Chem. 2003, 278, 10963–72. [DOI] [PubMed] [Google Scholar]
- Zhou H.; Yuen P. S.; Pisitkun T.; Gonzales P. A.; Yasuda H.; Dear J. W.; Gross P.; Knepper M. A.; Star R. A. Kidney Int. 2006, 69, 1471–6. [DOI] [PMC free article] [PubMed] [Google Scholar]
- a Rood I. M.; Deegens J. K.; Merchant M. L.; Tamboer W. P.; Wilkey D. W.; Wetzels J. F.; Klein J. B. Kidney Int. 2010, 78, 810–6. [DOI] [PubMed] [Google Scholar]; b Tauro B. J.; Greening D. W.; Mathias R. A.; Ji H.; Mathivanan S.; Scott A. M.; Simpson R. J. Methods 2012, 56, 293–304. [DOI] [PubMed] [Google Scholar]
- Clayton A.; Court J.; Navabi H.; Adams M.; Mason M. D.; Hobot J. A.; Newman G. R.; Jasani B. J. Immunol. Methods 2001, 247, 163–74. [DOI] [PubMed] [Google Scholar]
- a Koga K.; Matsumoto K.; Akiyoshi T.; Kubo M.; Yamanaka N.; Tasaki A.; Nakashima H.; Nakamura M.; Kuroki S.; Tanaka M.; Katano M. Anticancer Res. 2005, 25, 3703–7. [PubMed] [Google Scholar]; b Valadi H.; Ekstrom K.; Bossios A.; Sjostrand M.; Lee J. J.; Lotvall J. O. Nat. Cell Biol. 2007, 9, 654–9. [DOI] [PubMed] [Google Scholar]; c Ostrowski M.; Carmo N. B.; Krumeich S.; Fanget I.; Raposo G.; Savina A.; Moita C. F.; Schauer K.; Hume A. N.; Freitas R. P.; Goud B.; Benaroch P.; Hacohen N.; Fukuda M.; Desnos C.; Seabra M. C.; Darchen F.; Amigorena S.; Moita L. F.; Thery C. Nat. Cell Biol. 2010, 12, 19–30. [DOI] [PubMed] [Google Scholar]
- a Mathivanan S.; Lim J. W.; Tauro B. J.; Ji H.; Moritz R. L.; Simpson R. J. Mol. Cell. Proteomics 2010, 9, 197–208. [DOI] [PMC free article] [PubMed] [Google Scholar]; b Grant R.; Ansa-Addo E.; Stratton D.; Antwi-Baffour S.; Jorfi S.; Kholia S.; Krige L.; Lange S.; Inal J. J. Immunol Methods 2011, 371, 143–51. [DOI] [PubMed] [Google Scholar]
- a Lausted C.; Hu Z.; Hood L.; Campbell C. T. Comb. Chem. High Throughput Screening 2009, 12, 741–51. [DOI] [PubMed] [Google Scholar]; b Lausted C.; Hu Z.; Hood L. Mol. Cell. Proteomics 2008, 7, 2464–74. [DOI] [PubMed] [Google Scholar]
- Campbell C. T.; Kim G. Biomaterials 2007, 28, 2380–92. [DOI] [PubMed] [Google Scholar]
- Schneider A.; Simons M. Cell Tissue Res. 2012, 352, 33–47. [DOI] [PMC free article] [PubMed] [Google Scholar]
- Im H.; Shao H.; Park Y. I.; Peterson V. M.; Castro C. M.; Weissleder R.; Lee H. Nat. Biotechnol. 2014, 32, 490–5. [DOI] [PMC free article] [PubMed] [Google Scholar]
- Liu A. Y. Cancer Res. 2000, 60, 3429–34. [PubMed] [Google Scholar]
- Pisitkun T.; Shen R. F.; Knepper M. A. Proc. Natl. Acad. Sci. U.S.A. 2004, 101, 13368–73. [DOI] [PMC free article] [PubMed] [Google Scholar]
- Record M.; Subra C.; Silvente-Poirot S.; Poirot M. Biochem. Pharmacol. 2011, 81, 1171–82. [DOI] [PubMed] [Google Scholar]
- Tauro B. J.; Greening D. W.; Mathias R. A.; Mathivanan S.; Ji H.; Simpson R. J. Mol. Cell Proteomics 2012, 12, 587–98. [DOI] [PMC free article] [PubMed] [Google Scholar]
- a Zoller M. Nat. Rev. Cancer 2009, 9, 40–55. [DOI] [PubMed] [Google Scholar]; b Janowska-Wieczorek A.; Wysoczynski M.; Kijowski J.; Marquez-Curtis L.; Machalinski B.; Ratajczak J.; Ratajczak M. Z. Int. J. Cancer 2005, 113, 752–60. [DOI] [PubMed] [Google Scholar]
- Zheng Y.; Campbell E. C.; Lucocq J.; Riches A.; Powis S. J. Exp. Cell Res. 2013, 319, 1706–13. [DOI] [PubMed] [Google Scholar]
- a Savina A.; Furlan M.; Vidal M.; Colombo M. I. J. Biol. Chem. 2003, 278, 20083–90. [DOI] [PubMed] [Google Scholar]; b Barres C.; Blanc L.; Bette-Bobillo P.; Andre S.; Mamoun R.; Gabius H. J.; Vidal M. Blood 2010, 115, 696–705. [DOI] [PubMed] [Google Scholar]
- Kodoyianni V. BioTechniques 2011, 50, 32–40. [DOI] [PubMed] [Google Scholar]
- Jung L. S.; Shumaker-Parry J. S.; Campbell C. T.; Yee S. S.; Gelb M. H. J. Am. Chem. Soc. 2000, 122, 4177–84. [Google Scholar]
- a Jung L. S.; Campbell C. T.; Chinowsky T. M.; Mar M. N.; Yee S. S. Langmuir 1998, 14, 5636–48. [Google Scholar]; b Shumaker-Parry J. S.; Campbell C. T. Anal. Chem. 2004, 76, 907–17. [DOI] [PubMed] [Google Scholar]
- a Daleke D. L. J. Lipid Res. 2003, 44, 233–42. [DOI] [PubMed] [Google Scholar]; b van Meer G.; de Kroon A. I. J. Cell Sci. 2011, 124, 5–8. [DOI] [PubMed] [Google Scholar]
- a Denengelsen D. Surf. Sci. 1976, 56, 272–80. [Google Scholar]; b Huang W.; Levitt D. G. Biophys. J. 1977, 17, 111–28. [DOI] [PMC free article] [PubMed] [Google Scholar]; c Florin E. L.; Gaub H. E. Biophys. J. 1993, 64, 375–83. [DOI] [PMC free article] [PubMed] [Google Scholar]
- Small D. M.The Physical Chemistry of Lipids: From Alkanes to Phospholipids; Plenum Press: New York, 1986; Vol. 4. [Google Scholar]
- Balaj L.; Lessard R.; Dai L.; Cho Y. J.; Pomeroy S. L.; Breakefield X. O.; Skog J. Nat. Commun. 2011, 2, 180. [DOI] [PMC free article] [PubMed] [Google Scholar]
- Tang Z. Y.; Ye S. L.; Liu Y. K.; Qin L. X.; Sun H. C.; Ye Q. H.; Wang L.; Zhou J.; Qiu S. J.; Li Y.; Ji X. N.; Liu H.; Xia J. L.; Wu Z. Q.; Fan J.; Ma Z. C.; Zhou X. D.; Lin Z. Y.; Liu K. D. J. Cancer Res. Clin. Oncol. 2004, 130, 187–96. [DOI] [PMC free article] [PubMed] [Google Scholar]