

Abstract
Context:
Data on the incidence of injury in middle school sports are limited.
Objective:
To describe overall, practice, and game injury rate patterns in 29 middle school sports.
Design:
Descriptive epidemiology study.
Setting:
Injury data collected over a 20-year period (1988–2008) at a single school.
Patients or Other Participants:
Boy (n = 8078) and girl (n = 5960) athletes participating in 14 and 15 middle school sports, respectively.
Main Outcome Measure(s):
Injury status and athlete-exposures (AEs) were collected by certified athletic trainers. Incidence rates per 1000 AEs (injuries/AEs) were calculated for overall incidence, practices and games, injury location, injury type, and injury severity (time lost from participation). Rate ratios (RRs) and 95% confidence intervals (CIs) were used to compare injury rates for sex-matched sports.
Results:
Football had the highest injury rate for all injuries (16.03/1000 AEs) and for time-loss injuries (8.486/1000 AEs). In matched middle school sports, girls exhibited a higher injury rate for all injuries (7.686/1000 AEs, RR = 1.15, 95% CI = 1.1, 1.2) and time-loss injuries (2.944/1000 AEs, RR = 1.09, 95% CI = 1.0, 1.2) than boys (all injuries: 6.684/1000 AEs, time-loss injuries: 2.702/1000 AEs). Girls had a higher injury rate during practices (3.30/1000 AEs) than games (1.67/1000 AEs, RR = 1.97, 95% CI = 1.7, 2.4) for all sports. Only gymnastics (RR = 0.96, 95% CI = 0.3, 3.8) had a higher game injury rate for girls. Practice and game injury rates were nearly identical for boys in all sports (RR = 0.99, 95% CI = 0.9, 1.1). Only football (RR = 0.49, 95% CI = 0.4, 0.6) and boys' wrestling (RR = 0.50, 95% CI = 0.3, 0.8) reported higher game injury rates. Tendinitis injuries accounted for 19.1% of all middle school injuries.
Conclusions:
The risk for sport-related injury at the middle school level was greater during practices than games and greater for girls than boys in sex-matched sports. Conditioning programs may be needed to address the high rate of tendinitis injuries.
Key Words: epidemiology, sports, athletes, adolescents
Key Points
Injuries to middle school athletes were less frequent and less severe than those reported for secondary school and collegiate athletes.
Injuries were more often sustained in practices than in games.
In sex-matched sports, girls had a higher injury rate than boys. Football had the highest overall injury rate.
Understanding the incidence and risk factors for adolescent athletic injuries can lead to the implementation of injury-prevention strategies.1 The National Federation of High Schools Association has documented participation data for high school athletics since 1971–1972, with more than 7.6 million athletes participating in secondary school athletics nationally during the 2009–2010 school year.2 The risk of athletic injury at the high school level has become increasingly well documented.3–11 The sport-related injury risk is also problematic at ages below the high school level. The National Center for Sports Safety has reported that more than 3.5 million children ages 14 and under receive medical treatment for sport injuries annually.12 The observed increased popularity of boys' and girls' youth soccer participation has also resulted in a corresponding increase in injuries.13–17 The actual participation and injury rates for middle school athletes are less clear. Although McEwin and Swain18 stated that 96% of middle schools in the United States participated in interscholastic competition, participation data were not provided. The few studies of the incidence of injury among middle schoolers have focused on specific sports1,19,20 and contact injuries among boy athletes only.19,20
Despite the increased reports of injury risk at the secondary school level,3–7 a universally accepted injury definition is still lacking. Other limitations of prior studies include short-term injury tracking (eg, 1 to 2 years) and inconsistent use of an athlete-time denominator, such as athlete-exposures (AEs), that allows for comparison of injury rates by sex or across sports for severity of injury, practice and game settings, body part injured, and injury type.
McGuine21 noted contradictory results in secondary school data reporting both sex-specific and practice versus game injury rates. Girls had a higher injury rate than boys in some matched sports1,7,8 but similar risks in others.7 Previous reports have indicated a higher game injury risk in contact sports,20,22–24 whereas higher practice injury rates have been observed in noncontact sports.8,25,26
The purpose of our study was to describe the incidence and risk factors of injury for 29 middle school sports at a private school over a 20-year period. Studies of middle school populations are not comprehensive and do not address differences between boys and girls or practices and games. The exposure setting (ie, practice or game), injury location, injury type, and injury severity were evaluated for the overall sample and by sex.
METHODS
Participants and Setting
Punahou School, located in Honolulu, Hawaii, is a private, nonsectarian school with 3700 students in kindergarten through grade 12. Middle school athletes range in age from 12 to 15 years old and are in grades 7 to 9. The average enrollment for grades 7 and 8 is 740 students, with 57.4% of boys and 51.7% of girls participating in athletics. Although interscholastic league rules allow ninth graders (400 students) to participate at the middle school level, internal school policy limits ninth-grade participation in middle school sports (6.2% of ninth-grade girls, 21% of ninth-grade boys; Table 1). The ninth-grade boys may participate in middle school or high school football, depending on ability. Over 20 years, a total of 8081 boys participated in 14 sports and on 18 teams, with 5960 girls participating in 15 sports and on 19 teams (Table 2). Softball, baseball, basketball, soccer, and volleyball fielded 2 teams each for both boys and girls. During this study, 13 new sports were added to the athletic program. These consisted of boys' and girls' swimming (1994–1995), boys' and girls' diving and girls' water polo (1996), cheerleading and boys' and girls' tennis (1997), boys' and girls' golf (1998), girls' wrestling (1999), and boys' and girls' judo (2005). Gymnastics for girls was introduced in 1993 but dropped in 2007 (Table 2). This study was approved by the University of Hawaii Institutional Review Board.
Table 1.
Middle School Enrollment and Athletic Participation, 1988–2008
| Sex |
Grade |
Overall Student Enrollment, Mean |
Middle School Individual Athletes, Mean |
Athlete Participation, % |
| Boys | 7 | 185 | 93 | 50.30 |
| Girls | 7 | 187 | 87 | 48.70 |
| Boys | 8 | 179 | 116 | 65.00 |
| Girls | 8 | 188 | 107 | 57.30 |
| Boys | 9 | 221 | 45 | 20.30 |
| Girls | 9 | 216 | 14 | 6.20 |
Table 2.
Injury-Risk Sex Comparisons by Sport Among Middle School Athletes, 1988–2008
| Sport |
Participation, y |
Total Athletes |
Overall Injuries |
Time-Loss Injuries |
|||||||
| n |
AEs |
Injury Rate (/1000 AEs) |
Rate Ratio |
95% Confidence Interval |
n |
Injury Rate (/1000 AEs) |
Rate Ratio |
95% Confidence Interval |
|||
| Softball (girls) | 20 | 555 | 302 | 42 594 | 7.090 | 0.96 | 0.8, 1.1 | 109 | 2.559 | 0.78 | 0.6, 0.9a |
| Baseball (boys) | 20 | 712 | 340 | 46 116 | 7.373 | 1 | Referent | 152 | 3.296 | 1.00 | Referent |
| Basketball | |||||||||||
| Girls | 20 | 553 | 362 | 39 558 | 9.151 | 1.03 | 0.9,1.2 | 137 | 3.463 | 1.02 | 0.8, 1.3 |
| Boys | 20 | 592 | 378 | 42 630 | 8.867 | 1 | Referent | 145 | 3.401 | 1.00 | Referent |
| Cheerleading (girls) | 11 | 135 | 35 | 8775 | 3.989 | NA | NA | 21 | 2.393 | NA | NA |
| Cross-country | |||||||||||
| Girls | 20 | 756 | 411 | 37 830 | 10.864 | 1.36 | 1.2, 1.6 | 147 | 3.886 | 1.23 | 0.9, 1.3 |
| Boys | 20 | 710 | 285 | 35 630 | 7.999 | 1 | Referent | 113 | 3.171 | 1.00 | Referent |
| Diving | |||||||||||
| Girls | 13 | 47 | 11 | 3055 | 3.601 | 3.04 | 0.9, 130.9 | 6 | 1.964 | 0.00 | NA |
| Boys | 13 | 13 | 1 | 845 | 1.183 | 1 | Referent | 0 | 0.000 | 0.00 | Referent |
| Football (boys) | 20 | 1435 | 1600 | 99 810 | 16.030 | NA | NA | 847 | 8.486 | NA | NA |
| Golf | |||||||||||
| Girls | 11 | 39 | 0 | 2340 | 0.000 | 0.00 | NA | 0 | 0.000 | 0.00 | NA |
| Boys | 11 | 96 | 0 | 5760 | 0.000 | 0 | Referent | 0 | 0.000 | 0.00 | Referent |
| Gymnastics (girls) | 15 | 156 | 65 | 9390 | 6.922 | NA | NA | 29 | 3.088 | NA | NA |
| Judo | |||||||||||
| Girls | 4 | 21 | 7 | 1030 | 6.796 | 1.50 | 0.5, 4.2 | 4 | 3.883 | 1.05 | 0.2, 3.8 |
| Boys | 4 | 51 | 11 | 2435 | 4.517 | 1 | Referent | 9 | 3.696 | 1.00 | Referent |
| Soccer | |||||||||||
| Girls | 20 | 666 | 412 | 51 732 | 7.964 | 1.07 | 0.9, 1.2 | 165 | 3.190 | 1.10 | 0.9, 1.4 |
| Boys | 20 | 706 | 410 | 55 068 | 7.445 | 1 | Referent | 159 | 2.887 | 1.00 | Referent |
| Swimming | |||||||||||
| Girls | 14 | 386 | 33 | 25 090 | 1.315 | 1.86 | 1.0, 3.8 | 17 | 0.678 | 3.36 | 1.1, 13.7 |
| Boys | 14 | 305 | 14 | 19 825 | 0.706 | 1 | Referent | 4 | 0.202 | 1.00 | Referent |
| Tennis | |||||||||||
| Girls | 12 | 266 | 27 | 15 960 | 1.692 | 1.24 | 0.7, 2.3 | 15 | 0.940 | 1.01 | 0.5, 2.2 |
| Boys | 12 | 268 | 22 | 16 080 | 1.368 | 1 | Referent | 15 | 0.933 | 1.00 | Referent |
| Track | |||||||||||
| Girls | 20 | 1537 | 878 | 72 165 | 12.167 | 1.46 | 1.3, 1.6 | 352 | 4.878 | 1.46 | 1.2, 1.7 |
| Boys | 20 | 1589 | 619 | 74 505 | 8.308 | 1 | Referent | 249 | 3.342 | 1.00 | Referent |
| Volleyball | |||||||||||
| Girls | 20 | 572 | 191 | 41 184 | 4.638 | 0.90 | 0.7, 1.1 | 54 | 1.311 | 0.72 | 0.5, 1.0 |
| Boys | 20 | 529 | 196 | 37 932 | 5.167 | 1 | Referent | 69 | 1.819 | 1.00 | Referent |
| Water polo | |||||||||||
| Girls | 13 | 232 | 23 | 13 920 | 1.652 | 1.34 | 0.8, 2.4 | 6 | 0.431 | 1.45 | 0.4, 4.8 |
| Boys | 20 | 447 | 33 | 26 820 | 1.230 | 1 | Referent | 8 | 0.298 | 1.00 | Referent |
| Wrestling | |||||||||||
| Girls | 10 | 39 | 24 | 2340 | 10.256 | 1.03 | 0.7, 1.6 | 15 | 6.410 | 1.49 | 0.8, 2.5 |
| Boys | 20 | 625 | 370 | 37 170 | 9.954 | 1 | Referent | 160 | 4.305 | 1.00 | Referent |
| Total | |||||||||||
| Girlsb | 5669 | 2681 | 348 798 | 7.686 | 1.15 | 1.1, 1.2 | 1027 | 2.944 | 1.09 | 1.0, 1.2 | |
| Boysc | 6643 | 2679 | 400 816 | 6.684 | 1 | Referent | 1083 | 2.702 | 1.00 | Referent | |
| All | 12312 | 5360 | 749 614 | 7.150 | NA | 2110 | 2.815 | NA | |||
| Sex matched | |||||||||||
| Girls | 5960 | 2781 | 366 963 | 7.578 | 0.89 | 0.8, 0.9 | 1077 | 2.935 | 0.76 | 0.7, 0.8 | |
| Boys | 8078 | 4279 | 500 626 | 8.547 | 1 | Referent | 1930 | 3.855 | 1.00 | Referent | |
| All | 14038 | 7060 | 867 589 | 8.137 | NA | 3007 | 3.466 | NA | |||
Abbreviations: AE, athlete-exposures; NA, not available.
Boldface indicates significance.
Minus cheerleading and gymnastics.
Minus football.
Data Collection
Five certified athletic trainers were on staff during the study period, ensuring consistency of evaluation and treatment. Of the 3 full-time athletic trainers, 1 had been on staff for the full 20 years of this study and the others for 15 and 5 years, respectively. Two sports medicine physicians (physiatrists) were contracted by the school as team physicians for all levels and sports during the time of the study. They provided coverage for all football games and evaluated students referred by the athletic trainers in a weekly clinic. Athletes were then further referred to their primary care physicians for follow-up evaluation and treatment.
Injuries were evaluated by the athletic training staff and recorded daily into a database program designed by the principal author (G.B.). The data were initially recorded using AppleWorks integrated software (versions 2 and 3; Apple Inc, Cupertino, CA), but all injury data are now recorded and stored on FileMaker Pro (versions 5 to 11; FileMaker, Inc, Santa Clara, CA). The physician's diagnosis and time lost from activity were updated as the athlete returned to play. In 2001, the Vienna concussion guidelines27 were implemented and then revised to align with both the Prague28 and Zurich29 concussion guidelines.
The Athletic Training Room Evaluation Form was used to collect all injury data, including name, grade, sex, sport, coach, date of injury, date of return to activity, team session, body part, category (eg, strain, sprain), evaluation results, severity of injury, activity status, and the evaluator's impressions and proposed treatment and rehabilitation. The player's position, activity at the time of injury, and field surface and conditions were also recorded.
Injuries
Throughout the study, injury was defined as any athlete complaint that required the attention of the athletic trainer, regardless of the time lost from activity.3 Evaluation forms were completed for all athlete complaints. Lacerations requiring sutures or advanced medical care were recorded, but a nosebleed or simple abrasion was not recorded. Five injury-severity classifications were used: (1) minor, no time lost from activity; (2) mild, 1 to 7 days lost; (3) moderate, 8 to 21 days lost; (4) severe, 22 or more days lost; and (5) catastrophic, permanent disability, dismemberment, or death.3
Athlete-Exposures
An AE was defined as 1 athlete participating in 1 practice or game. Participation was not recorded daily. Exposures were estimated using team rosters and number of practice and game dates. The average middle school athletic season was 11 to 12 weeks of training and competition.
Data Analysis
The total injury rate was calculated as the total number of injuries divided by the total number of AEs and was expressed as injuries per 1000 AEs (injuries/1000 AEs). Total injury rates were calculated separately for all injuries and for time-loss (at least 1 day) injuries.
Sex-Matched Sports
The rate ratio (RR) was used to compare the injury rates in girl and boy athletes competing in the same sport (Table 2):
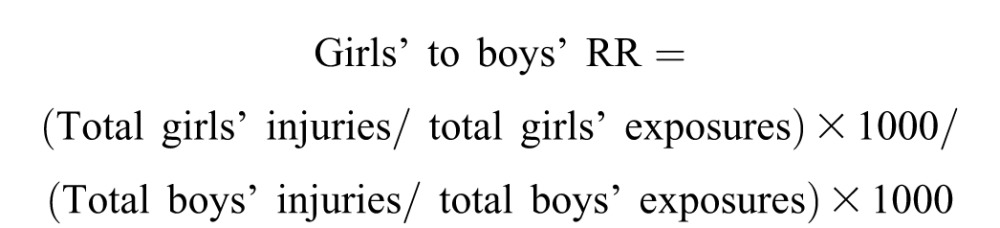 |
If the girls' to boys' sport RR was above 1.0, the girl was more likely to sustain an injury than the boy. If the girls' to boys' sport RR was below 1.0, the boy was more likely to sustain a higher injury rate.
Exposure Setting (Practices Versus Games)
Practice and game time-loss injury-rate comparisons were based on the following RR (Table 3):
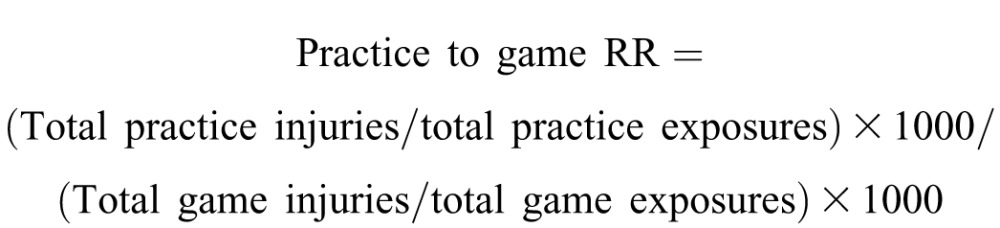 |
If the practice/game RR was above 1.0, the athlete was more likely to sustain an injury in practice than during a game. If the practice/game RR was below 1.0, the individual was more likely to sustain an injury during a game than in a practice.
Table 3.
Injury-Risk Estimates During Practices and Games by Sport and Sex, 1988–2008
| Sport |
Practices |
Games |
Practice/Game Rate Ratio |
95% Confidence Interval |
||||
| Exposures |
Time-Loss Injuries |
Injury Rate (/1000 AEs) |
Exposures |
Time-Loss Injuries |
Injury Rate (/1000 AEs) |
|||
| Softball | ||||||||
| Girls | 31 610 | 98 | 3.100 | 10 984 | 11 | 1.001 | 3.10 | 1.7, 6.4a |
| Baseball | ||||||||
| Boys | 32 168 | 121 | 3.762 | 13 948 | 31 | 2.223 | 1.69 | 1.1, 2.6 |
| Basketball | ||||||||
| Girls | 28 690 | 104 | 3.625 | 10 868 | 33 | 3.036 | 1.19 | 0.8, 1.8 |
| Boys | 30 966 | 119 | 3.843 | 11 664 | 26 | 2.229 | 1.72 | 1.1, 2.8 |
| Cheerleading (girls) | 6075 | 21 | 3.457 | 2700 | 0 | 0.000 | 0.00 | NA |
| Cross-country | ||||||||
| Girls | 31 776 | 129 | 4.060 | 6054 | 18 | 2.973 | 1.37 | 0.8, 2.4 |
| Boys | 29 924 | 105 | 3.509 | 5706 | 8 | 1.402 | 2.50 | 1.2, 6.0 |
| Diving | ||||||||
| Girls | 2585 | 6 | 2.321 | 470 | 0 | 0.000 | 0.00 | NA |
| Boys | 715 | 0 | 0.000 | 130 | 0 | 0.000 | 0.00 | NA |
| Football (boys) | 85 834 | 637 | 7.421 | 13 976 | 210 | 15.026 | 0.49 | 0.4, 0.6 |
| Golf | ||||||||
| Girls | 1989 | 0 | 0.000 | 351 | 0 | 0.000 | 0.00 | NA |
| Boys | 4896 | 0 | 0.000 | 864 | 0 | 0.000 | 0.00 | NA |
| Gymnastics (girls) | 8136 | 25 | 3.073 | 1254 | 4 | 3.190 | 0.96 | 0.3, 3.8 |
| Judo | ||||||||
| Girls | 925 | 4 | 4.324 | 105 | 0 | 0.000 | 0.00 | NA |
| Boys | 2180 | 9 | 4.128 | 255 | 0 | 0.000 | 0.00 | NA |
| Soccer | ||||||||
| Girls | 38 548 | 124 | 3.217 | 13 184 | 41 | 3.110 | 1.03 | 0.7, 1.5 |
| Boys | 41 076 | 119 | 2.897 | 13 992 | 40 | 2.859 | 1.01 | 0.7, 1.5 |
| Swimming | ||||||||
| Girls | 21 230 | 17 | 0.801 | 3860 | 0 | 0.000 | 0.00 | NA |
| Boys | 16 775 | 4 | 0.238 | 3050 | 0 | 0.000 | 0.00 | NA |
| Tennis | ||||||||
| Girls | 10 640 | 15 | 1.410 | 5320 | 0 | 0.000 | 0.00 | NA |
| Boys | 10 720 | 12 | 1.119 | 5360 | 3 | 0.560 | 2.00 | 0.5, 11.0 |
| Track | ||||||||
| Girls | 59 269 | 325 | 5.483 | 12 896 | 27 | 2.094 | 2.62 | 1.8, 4.0 |
| Boys | 61 193 | 212 | 3.464 | 13 312 | 37 | 2.779 | 1.25 | 0.9, 1.8 |
| Volleyball | ||||||||
| Girls | 29 984 | 52 | 1.734 | 11 200 | 2 | 0.179 | 9.71 | 2.6, 82.3 |
| Boys | 27 404 | 64 | 2.335 | 10 528 | 5 | 0.475 | 4.92 | 2.0, 15.7 |
| Water polo | ||||||||
| Girls | 11 600 | 6 | 0.517 | 2320 | 0 | 0.000 | 0.00 | NA |
| Boys | 22 350 | 7 | 0.313 | 4470 | 1 | 0.224 | 1.40 | 0.2, 63.1 |
| Wrestling | ||||||||
| Girls | 2028 | 14 | 6.903 | 312 | 1 | 3.205 | 2.15 | 0.3, 91.1 |
| Boys | 32 302 | 123 | 3.808 | 4868 | 37 | 7.601 | 0.50 | 0.3, 0.8 |
| Total | ||||||||
| Girls | 285 085 | 940 | 3.297 | 81 878 | 137 | 1.673 | 1.97 | 1.7, 2.4 |
| Boys | 398 503 | 1532 | 3.844 | 102 123 | 398 | 3.897 | 0.99 | 0.9, 1.1 |
| All | 683 588 | 2472 | 3.616 | 184 001 | 535 | 2.908 | 1.24 | 1.1, 1.4 |
Abbreviations: AEs, athlete-exposures; NA, not available.
Boldface indicates significance.
For time-loss injuries only, RR comparisons were also calculated for body location injured, type of injury, severity of injury, and specific injury types. The 95% confidence interval (95% CI) was used to determine the statistical significance for all rate ratios. Confidence intervals that did not include 1.0 indicated statistical significance (P ≤ .05).
All analyses were conducted with the STATA (version 5.0; STATA Corporation, College Station, TX) and SPSS (version 18.0; SPSS, Inc, Chicago, IL) statistical packages.
RESULTS
Sport Participation
Over the 20-year period, 14 038 athletes were included in this analysis, with a greater number of boys (n = 8078) than girls (n = 5960; Table 2). By sport, track had the greatest number of athletes participating (n = 3126; 1537 girls, 1589 boys), followed by cross-country (n = 1466; 756 girls, 710 boys), and football (n = 1435). Boys had a higher participation level (n = 500 626 AEs) than girls (n = 366 963 AEs; Table 2). By sport, track had the highest participation level (n = 146 670 AEs) followed by soccer (n = 106 800 AEs) and football (n = 99 810 AEs).
Injury Rate
Boy athletes reported 4279 injuries, with 1930 injuries (45.1%) resulting in at least 1 day lost from activity (Table 2). Girl athletes reported 2781 injuries, with 1077 injuries (38.7%) resulting in at least 1 day lost from activity. Most injuries (4053) were classified as minor (no time lost from participation) and accounted for 54.9% and 61.3% of all injuries for boys and girls, respectively.
The injury rate for girls was highest in 1990 and 1998 and gradually declined over the following 10-year period (Figure 1), even with the addition of 10 new sports for girls. The injury rate for boys remained relatively the same (Figure 2). The time-loss injury rate for girls rose gradually until 1998 and then gradually declined (Figure 1), whereas the time-loss injury rate for boys has gradually increased over the 20-year period (Figure 2).
Figure 1.

Annual non–time-loss and time-loss injuries for middle school girls (1988–2008).
Figure 2.

Annual non–time-loss and time-loss injuries for middle school boys (1988–2008).
Sex Comparisons
In sex-matched sports, middle school girls were more likely to sustain any injury (RR = 1.15, 95% CI = 1.1, 1.2) or a time-loss injury (RR = 1.09, 95% CI = 1.0, 1.2) than middle school boys (Table 2). Although middle school girls were more likely to sustain an injury in practice (RR = 1.97, 95% CI = 1.7, 2.4) than during a game, the risk of injury was similar during practices and games for middle school boys (RR = 0.99, 95% CI = 0.9, 1.1; Table 3).
Middle school girls were twice as likely to sustain a mild injury during a practice than in a game (RR = 2.05, 95% CI =1.7, 2.5), but no differences were noted during practices or games for moderate or severe injuries. For boys, the risk of a severe injury was 55% less during practices than during games (RR = 0.45, 95% CI = 0.3, 0.6; Table 4). We found no differences between practices and games for mild or moderate injuries.
Table 4.
Injury by Severity in Practice and Game Settings by Sex, 1988–2008
| Sex |
Setting |
AEs |
Injuries |
|||||||||||
| Milda |
Moderateb |
Severec |
||||||||||||
| Number |
Injury Rate |
Practice/ Game Rate Ratio |
95% Confidence Interval |
Number |
Injury Rate |
Practice/ Game Rate Ratio |
95% Confidence Interval |
Number |
Injury Rate |
Practice/ Game Rate Ratio |
95% Confidence Interval |
|||
| Girls | Practices | 285 085 | 843 | 2.957 | 2.05 | 1.7, 2.5d | 62 | 0.217 | 1.19 | 0.7, 2.3 | 31 | 0.109 | 1.11 | 0.5, 2.8 |
| Games | 81 878 | 118 | 1.441 | 1.00 | Referent | 15 | 0.183 | 1.00 | Referent | 8 | 0.098 | 1.00 | Referent | |
| Total | 366 963 | 961 | 2.619 | 77 | 0.210 | 39 | 0.106 | |||||||
| Boys | Practices | 398 503 | 1305 | 3.275 | 1.12 | 0.9, 1.3 | 132 | 0.331 | 0.89 | 0.6, 1.3 | 99 | 0.248 | 0.45 | 0.3, 0.6 |
| Games | 102 123 | 299 | 2.928 | 1.00 | Referent | 38 | 0.372 | 1.00 | Referent | 57 | 0.558 | 1.00 | Referent | |
| Total | 500 626 | 1604 | 3.204 | 170 | 0.340 | 156 | 0.312 | |||||||
| Overall | Practices | 683 588 | 2148 | 3.160 | 1.35 | 1.2, 1.5 | 194 | 0.284 | 0.99 | 0.7, 1.4 | 130 | 0.190 | 0.54 | 0.4, 0.7 |
| Games | 184 001 | 417 | 2.266 | 1.00 | Referent | 53 | 0.288 | 1.00 | Referent | 65 | 0.353 | 1.00 | Referent | |
| Total | 867 589 | 2565 | 2.956 | 247 | 0.285 | 195 | 0.225 | |||||||
Abbreviation: AEs, athlete-exposures.
Mild injury: 1 to 7 days lost from sport participation.
Moderate injury: 8 to 21 days lost from sport participation.
Severe injury: 22 or more days lost from sport participation.
Boldface indicates significance.
Specific sex-matched sport differences and specific injury differences are reported under these topics.
Injury Rate: All Injuries
For all injuries, the overall injury rate was 8.137/1000 AEs. Football recorded the highest injury rate for all sports at 16.030/1000 AEs, followed by girls' track (12.167/1000 AEs), girls' cross-country (10.864/1000 AEs), girls' wrestling (10.256/1000 AEs), and boys' wrestling (9.954/1000 AEs; Table 2). Diving, tennis, water polo, swimming, and golf reported the lowest injury rates. However, in sex-matched sports, girl athletes were more likely to incur an injury than boy athletes in cross-country (RR = 1.36, 95% CI = 1.2, 1.6), swimming (RR = 1.86, 95% CI = 1.0, 3.8), and track (RR = 1.46, 95% CI = 1.3, 1.6).
Injury Rate: Time-Loss Injuries
For time-loss injury rates, the overall injury rate was 3.466/1000 AEs. Football recorded the highest injury rate (8.486/1000 AEs), followed by girls' wrestling (6.410/1000 AEs), girls' track (4.878/1000 AEs), boys' wrestling (4.305/1000 AEs), and girls' (3.883/1000 AEs) and boys' judo (3.696/1000 AEs; Table 2). When all sex-matched sports were compared, girls were more likely to sustain a time-loss injury than their male counterparts (RR = 1.09, 95% CI = 1.0, 1.2). Girl track athletes (RR = 1.46, 95% CI = 1.2, 1.7) and girl swimmers (RR = 3.36, 95% CI = 1.1, 13.7) were at higher risk for time-loss injury than their male counterparts. Softball players were at lower injury risk than baseball players (RR = 0.78, 95% CI = 0.6, 0.9).
Exposure Setting (Practices Versus Games)
For the total sample, practice injury rates were higher than game injury rates (RR = 1.24, 95% CI = 1.1, 1.4; Table 3). For all girls' sports, a higher injury rate was recorded in practices (3.297/1000 AEs) than in games (1.673/1000 AEs) (RR = 1.97, 95% CI = 1.7, 2.4). For boys, the risk of injury was nearly identical during practices and games (RR = 0.99, 95% CI = 0.9, 1.1).
For softball (RR = 3.10, 95% CI = 1.7, 6.4), baseball (RR = 1.69, 95% CI = 1.1, 2.6), boys' cross-country (RR = 2.50, 95% CI = 1.2, 6.0), girls' track (RR = 2.62, 95% CI = 1.8, 4.0), boys' basketball (RR = 1.72, 95% CI = 1.1, 2.8), and girls' (RR = 9.71, 95% CI = 2.6, 82.3) and boys' volleyball (RR = 4.92, 95% CI = 2.0, 15.7), the injury risk was greater during practices than in games. Only in boys' wrestling (RR = 0.50, 95% CI = 0.3, 0.8) and football (RR = 0.49, 95% CI = 0.4, 0.6) was the likelihood of sustaining an injury greater during a game than during a practice.
Injury Severity
Minor injuries accounted for 57% of all reported middle school injuries. Middle school girls reported that 61.2% of all injuries involved no time loss, compared with 54.8% of all boys' injuries. Although mild injuries were more likely to occur during practices than during games (RR = 1.35, 95% CI = 1.2, 1.5), severe injuries were more likely to occur during games (RR = 0.54, 95% CI = 0.4, 0.7; Table 4). Girls were twice as likely to report a mild injury during practice than during a game (RR = 2.05, 95% CI = 1.7, 2.5), whereas boys were less likely to incur a severe injury in a practice than in a game (RR = 0.45, 95% CI, 0.3, 0.6; Table 4).
Body Part
Ankle, knee, thigh, shin/calf, and wrist/hand/finger injuries were the most frequently reported time-loss injuries by middle school athletes. Ankle and knee injuries were the time-loss injuries reported most overall (n = 581, rate = 0.669/1000 AEs, and n = 384, rate = 0.442/1000 AEs, respectively) and during practices (0.695/1000 AEs and 0.459/1000 AEs, respectively) and games (0.576/1000 AEs and 0.380/1000 AEs, respectively; Table 5).
Table 5.
Injury by Sex and Body Part in Practice and Game Settings, 1988–2008
| Sex |
Body Part |
Total Time-Loss Injuries |
Percentage of Total Injuriesa |
Time-Loss Practice Injuries |
Practice Injury Rate (/1000 AEs)b |
Time-Loss Game Injuries |
Game Injury Rate (/1000 AEs)c |
Practice/Game Rate Ratio |
95% Confidence Interval |
| Girls | Ankle | 265 | 24.61 | 224 | 0.786 | 41 | 0.501 | 1.59 | 1.1, 2.3d |
| Shin/calf | 182 | 16.90 | 175 | 0.614 | 7 | 0.085 | 7.18 | 3.4, 18.1 | |
| Knee | 156 | 14.48 | 135 | 0.474 | 21 | 0.256 | 1.85 | 1.2, 3.1 | |
| Thigh | 146 | 13.56 | 124 | 0.435 | 22 | 0.269 | 1.62 | 1.1, 2.7 | |
| Wrist/hand/finger | 56 | 5.20 | 46 | 0.161 | 10 | 0.122 | 1.32 | 0.7, 2.9 | |
| Foot/toe | 52 | 4.83 | 49 | 0.172 | 3 | 0.037 | 4.50 | 1.5, 22.6 | |
| Hip | 43 | 3.99 | 36 | 0.126 | 7 | 0.085 | 1.44 | 0.6, 3.8 | |
| Back | 42 | 3.90 | 33 | 0.116 | 9 | 0.110 | 1.02 | 0.5, 2.4 | |
| Shoulder/upper arm | 35 | 3.25 | 29 | 0.102 | 6 | 0.073 | 1.39 | 0.6, 4.1 | |
| Head/face | 33 | 3.06 | 27 | 0.095 | 6 | 0.073 | 1.29 | 0.5, 3.8 | |
| Elbow/forearm | 22 | 2.04 | 18 | 0.063 | 4 | 0.049 | 1.29 | 0.4, 5.3 | |
| Other | 20 | 1.86 | 19 | 0.067 | 1 | 0.012 | 5.17 | 0.8, 215.4 | |
| Neck | 13 | 1.21 | 11 | 0.039 | 2 | 0.024 | 1.58 | 0.4, 14.7 | |
| Trunk/abdomen | 12 | 1.11 | 12 | 0.042 | 0 | 0.000 | 0.00 | NA | |
| Boys | Ankle | 316 | 16.37 | 251 | 0.630 | 65 | 0.636 | 0.99 | 0.8, 1.3 |
| Knee | 228 | 11.81 | 179 | 0.449 | 49 | 0.480 | 0.94 | 0.7, 1.3 | |
| Thigh | 210 | 10.88 | 169 | 0.424 | 41 | 0.401 | 1.06 | 0.8, 1.5 | |
| Wrist/hand/finger | 198 | 10.26 | 158 | 0.396 | 40 | 0.392 | 1.01 | 0.7, 1.5 | |
| Back | 135 | 6.99 | 111 | 0.279 | 24 | 0.235 | 1.19 | 0.7, 1.8 | |
| Hip | 129 | 6.68 | 104 | 0.261 | 25 | 0.245 | 1.07 | 0.7, 1.7 | |
| Neck | 129 | 6.68 | 98 | 0.246 | 31 | 0.304 | 0.81 | 0.6, 1.4 | |
| Shin/calf | 118 | 6.11 | 108 | 0.271 | 10 | 0.098 | 2.77 | 1.7, 8.2 | |
| Shoulder/upper arm | 118 | 6.11 | 92 | 0.231 | 26 | 0.255 | 0.91 | 0.6, 1.5 | |
| Foot/toe | 115 | 5.96 | 103 | 0.258 | 12 | 0.118 | 2.20 | 1.2, 4.4 | |
| Head/face | 82 | 4.25 | 51 | 0.128 | 31 | 0.304 | 0.42 | 0.3, 07 | |
| Elbow/forearm | 63 | 3.26 | 43 | 0.108 | 20 | 0.196 | 0.55 | 0.3, 0.9 | |
| Trunk/abdomen | 55 | 2.85 | 38 | 0.095 | 17 | 0.166 | 0.57 | 0.3, 0.8 | |
| Other | 34 | 1.76 | 28 | 0.070 | 6 | 0.059 | 1.20 | 0.6, 4.1 | |
| Total | Ankle | 581 | 19.32 | 475 | 0.695 | 106 | 0.576 | 1.21 | 0.9, 1.5 |
| Knee | 384 | 12.77 | 314 | 0.459 | 70 | 0.380 | 1.21 | 0.9, 1.6 | |
| Thigh | 356 | 11.84 | 293 | 0.429 | 63 | 0.342 | 1.25 | 0.9, 1.7 | |
| Shin/calf | 300 | 9.98 | 283 | 0.414 | 17 | 0.092 | 4.48 | 3.0, 9.2 | |
| Wrist/hand/finger | 254 | 8.45 | 204 | 0.298 | 50 | 0.272 | 1.10 | 0.8, 1.5 | |
| Back | 177 | 5.89 | 144 | 0.211 | 33 | 0.179 | 1.17 | 0.8, 1.7 | |
| Hip | 172 | 5.72 | 140 | 0.205 | 32 | 0.174 | 1.18 | 0.8, 1.8 | |
| Foot/toe | 167 | 5.55 | 152 | 0.222 | 15 | 0.082 | 2.73 | 1.6, 4.9 | |
| Shoulder/upper arm | 153 | 5.09 | 121 | 0.177 | 32 | 0.174 | 1.02 | 0.7, 1.6 | |
| Neck | 142 | 4.72 | 109 | 0.159 | 33 | 0.179 | 0.89 | 0.6, 1.5 | |
| Head/face | 115 | 3.82 | 78 | 0.114 | 37 | 0.201 | 0.57 | 0.4, 0.9 | |
| Elbow/forearm | 85 | 2.83 | 61 | 0.089 | 24 | 0.130 | 0.68 | 0.4, 1.1 | |
| Trunk/abdomen | 67 | 2.23 | 50 | 0.073 | 17 | 0.092 | 0.79 | 0.4, 1.1 | |
| Other | 54 | 1.80 | 47 | 0.069 | 7 | 0.038 | 1.81 | 0.9, 5.1 |
Abbreviations: AEs, athlete-exposures; NA, not available.
Injuries: girls, 1077; boys, 1930; total, 3007.
Practice exposures: girls, 285 085; boys, 398 503; total, 683 588.
Game exposures: girls, 81 878; boys, 102 123; total, 184 001.
Boldface indicates significance.
Shin/calf (RR = 4.48, 95% CI = 3.0, 9.2) and foot/toe (RR = 2.73, 95% CI = 1.6, 4.9) injury rates were greater during practices than during games. Only the injury rate for head/face injuries (RR = 0.57, 95% CI = 0.4, 0.9) was higher during games than during practices.
For girl athletes, higher injury rates for the ankle (RR = 1.59, 95% CI = 1.1, 2.3), knee (RR = 1.85, 95% CI = 1.2, 3.1), thigh (RR = 1.62, 95% CI = 1.1, 2.7), shin/calf (RR = 7.18, 95% CI = 3.4, 18.1), and foot/toe (RR = 4.50, 95% CI = 1.5, 22.6) were reported during practice sessions than during games. For boys, although the risk of sustaining a head/face (RR = 0.42, 95% CI = 0.3, 0.7), elbow/forearm (RR = 0.51, 95% CI = 0.3, 0.9), or trunk/abdomen (RR = 0.46, 95% CI = 0.3, 0.8) injury was higher during games than during practices, shin/calf (RR = 3.46, 95% CI = 1.7, 8.2) and foot/toe injuries (RR = 2.20, 95% CI = 1.2, 4.4) were more likely to be reported during a practice than a game.
Injury Type
Overall, strains, sprains, and tendinitis were the injury types reported most frequently by middle school athletes (Table 6). The rates for strains (RR = 1.46, 95% CI = 1.3, 1.9), sprains (RR = 1.13, 95% CI = 0.9, 1.3), and tendinitis (RR = 7.14, 95% CI = 4.6, 11.5) were higher during practices than during games, whereas contusions (RR = 0.58, 95% CI = 0.4, 0.7) and fractures (RR = 0.77, 95% CI = 0.5, 0.9) were more likely to occur during games.
Table 6.
Injury Rates by Sex and Injury Type in Practice and Game Settings, 1988–2008
| Sex |
Injury Type |
Total Time-Loss Injuries |
Percentage of Total Injuriesa |
Time-Loss Practice Injuries |
Practice Injury Rate (/1000 AEs)b |
Time-Loss Game Injuries |
Game Injury Rate (/1000 AEs)c |
Practice/GameRate Ratio |
95% Confidence Interval |
| Girls | Tendinitis | 309 | 28.69 | 302 | 1.059 | 7 | 0.085 | 12.39 | 5.8, 30.5d |
| Sprain | 299 | 27.76 | 248 | 0.870 | 51 | 0.623 | 1.40 | 1.2, 2.4 | |
| Strain | 293 | 27.21 | 251 | 0.880 | 42 | 0.513 | 1.72 | 1.1, 1.9 | |
| Contusion | 69 | 6.41 | 47 | 0.165 | 22 | 0.269 | 0.61 | 0.4, 1.1 | |
| Other | 48 | 4.46 | 45 | 0.158 | 3 | 0.037 | 4.31 | 1.4, 21.7 | |
| Fracture | 44 | 4.09 | 36 | 0.126 | 8 | 0.098 | 1.29 | 0.6, 3.2 | |
| Neurotrauma | 15 | 1.39 | 10 | 0.035 | 5 | 0.061 | 0.57 | 0.2, 2.1 | |
| Boys | Strain | 541 | 28.03 | 461 | 1.157 | 80 | 0.783 | 1.48 | 1.2, 1.9 |
| Sprain | 532 | 27.56 | 415 | 1.041 | 117 | 1.146 | 0.91 | 0.7, 1.1 | |
| Tendinitis | 269 | 13.94 | 255 | 0.640 | 14 | 0.137 | 4.67 | 2.7, 8.7 | |
| Contusion | 245 | 12.69 | 167 | 0.419 | 78 | 0.764 | 0.55 | 0.4, 0.7 | |
| Fracture | 149 | 7.72 | 101 | 0.253 | 48 | 0.470 | 0.54 | 0.4, 0.8 | |
| Other | 114 | 5.91 | 87 | 0.218 | 27 | 0.264 | 0.83 | 0.5, 1.4 | |
| Neurotrauma | 80 | 4.15 | 49 | 0.123 | 31 | 0.304 | 0.41 | 0.2, 0.6 | |
| Total | Strain | 834 | 27.74 | 709 | 1.037 | 131 | 0.712 | 1.46 | 1.3, 1.9 |
| Sprain | 831 | 27.64 | 666 | 0.974 | 159 | 0.864 | 1.13 | 0.9, 1.3 | |
| Tendinitis | 578 | 19.22 | 557 | 0.815 | 21 | 0.114 | 7.14 | 4.6, 11.5 | |
| Contusion | 314 | 10.44 | 214 | 0.313 | 100 | 0.543 | 0.58 | 0.4, 0.7 | |
| Fracture | 193 | 6.42 | 146 | 0.214 | 51 | 0.277 | 0.77 | 0.5, 0.9 | |
| Neurotrauma | 95 | 3.16 | 123 | 0.180 | 35 | 0.190 | 0.95 | 0.8, 1.9 | |
| Other | 162 | 5.39 | 59 | 0.086 | 36 | 0.196 | 0.44 | 0.3, 0.7 |
Abbreviation: AEs, athlete-exposures.
Injuries: girls, 1077; boys, 1930; total, 3007.
Practice exposures: girls, 285 085; boys, 398 503; total, 683 588.
Game exposures: girls, 81 878; boys, 102 123; total, 184 001.
Boldface indicates significance.
For girl athletes, the injury rate of reporting tendinitis was 12 times higher (RR = 12.39, 95% CI = 5.8, 30.5) during practices than during games. Strains (RR = 1.72, 95% CI = 1.1, 1.9) and sprains (RR = 1.40, 95% CI = 1.2, 2.4) were also more likely to occur during practices than games. Tendinitis (RR = 4.67, 95% CI = 2.7, 8.7) and strain (RR = 1.48, 95% CI = 1.2, 1.9) rates were higher for boys during practice than during games, but the rates for contusions (RR = 0.55, 95% CI = 0.4, 0.7), fractures (RR = 0.54, 95% CI = 0.4, 0.8), and neurologic injuries (RR = 0.41, 95% CI = 0.2, 0.6) were greater during games than during practices.
Specific Injury Types
Concussions
The overall rate for concussion was 0.067/1000 AEs, with the rate almost 3 times higher (RR = 2.83, 95% CI = 1.5, 5.9) for boy athletes (0.092/1000 AEs) than girl athletes (0.033/1000 AEs) (Table 7). Middle school athletes were at higher risk of concussion during games than during practices (RR = 0.33, 95% CI = 0.2, 0.6). Football accounted for 35 of the 58 concussions (2.2% of all football injuries, rate = 0.35/1000 AEs) with 28 resulting in time lost from activity. The remaining concussions were spread among 6 sports, with basketball (n = 7, rate = 0.085/1000 AEs), soccer (n = 7, rate = 0.066/1000 AEs), and wrestling (n = 6, rate = 0.15/1000 AEs) participants recording the most injuries. The boys' concussion rate was 0.063/1000 AEs for practices and 0.206/1000 AEs for games (RR = 0.31, 95% CI = 0.2, 0.6). Concussions were more likely to occur during competition for boys. Girls participating in soccer (n = 6) and basketball (n = 5) accounted for the majority of concussions. Girls reported a higher rate of concussion during games (0.061/1000 AEs) than during practices (0.025/1000 AEs; RR = 0.40, 95% CI = 0.1, 1.6), but the difference was not significant.
Table 7.
Specific Injuries by Sex in Practice and Game Settings, 1988–2008
| Sex |
Injury |
Total Time-Loss Injuries |
Total Injury Rate (/1000 AEs)a |
Practice Time-Loss Injuries |
Practice Injury Rate (/1000 AEs)b |
Game Time-Loss Injuries |
Game Injury Rate (/1000 AEs)c |
Practice/Game Rate Ratio |
95% Confidence Interval |
| Girls | Concussion | 12 | 0.032 | 7 | 0.025 | 5 | 0.061 | 0.40 | 0.1, 1.6d |
| Rotator cuff injury | 7 | 0.019 | 6 | 0.021 | 1 | 0.012 | 1.72 | 0.2, 79.3 | |
| Anterior cruciate ligament | 3 | 0.008 | 2 | 0.007 | 1 | 0.012 | 0.57 | 0.1, 33.9 | |
| Medial tibial stress syndrome | 112 | 0.305 | 110 | 0.386 | 2 | 0.024 | 15.80 | 4.3, 132.1 | |
| Ankle sprain | 210 | 0.573 | 173 | 0.607 | 37 | 0.452 | 1.34 | 0.9, 2.0 | |
| Boys | Concussion | 46 | 0.092 | 25 | 0.063 | 21 | 0.206 | 0.31 | 0.2, 0.6 |
| Rotator cuff injury | 17 | 0.034 | 13 | 0.033 | 4 | 0.039 | 0.83 | 0.3, 3.5 | |
| Anterior cruciate ligament | 5 | 0.010 | 4 | 0.010 | 1 | 0.010 | 1.03 | 0.1, 50.5 | |
| Medial tibial stress syndrome | 52 | 0.104 | 51 | 0.128 | 1 | 0.010 | 13.07 | 2.2, 526.2 | |
| Ankle sprain | 223 | 0.445 | 176 | 0.442 | 47 | 0.460 | 0.96 | 0.7, 1.4 | |
| Total | Concussion | 58 | 0.067 | 32 | 0.047 | 26 | 0.141 | 0.33 | 0.2, 0.6 |
| Rotator cuff injury | 24 | 0.028 | 19 | 0.028 | 5 | 0.027 | 1.02 | 0.4, 3.5 | |
| Anterior cruciate ligament | 8 | 0.009 | 6 | 0.009 | 2 | 0.011 | 0.81 | 0.1, 8.2 | |
| Medial tibial stress syndrome | 164 | 0.189 | 161 | 0.236 | 3 | 0.016 | 14.45 | 4.9, 70.8 | |
| Ankle sprain | 433 | 0.499 | 349 | 0.511 | 84 | 0.457 | 1.12 | 0.9, 1.4 |
Abbreviation: AEs, athlete-exposures.
Total AEs: girls, 366 963; boys, 500 626.
Practice exposures: girls, 285 085; boys, 398 503; total, 683 588.
Game exposures: girls, 81 878; boys, 102 123; total, 184 001.
Boldface indicates significance.
Rotator Cuff Injuries
The rate of rotator cuff injury was nearly twice as high for boys (0.033/1000 AEs) as for girls (0.019/1000 AEs). Although girls were more likely to report a rotator cuff injury during practices (RR = 1.72, 95% CI = 0.2, 79.3) and boys during games (RR = 0.83, 95% CI = 0.3, 3.5), the differences were not significant.
Anterior Cruciate Ligament Injuries
Only 8 anterior cruciate ligament (ACL) injuries (0.009/1000 AEs) were reported during the 20-year recording period (Table 7), with no differences between practices and games (RR = 0.81, 95% CI = 0.1, 8.2). Football players accounted for all 5 of the boys' injuries; 4 of these were practice injuries. The 3 girls' injuries occurred during basketball, softball, and wrestling: 2 during practice and 1 during a game. No significant differences in ACL risk were seen during games or practices for boys (RR = 1.03, 95% CI = 0.1, 50.5) or girls (RR = 0.57, 95% CI = 0.1, 33.9). All 8 ACL injuries required surgical repair.
Medial Tibial Stress Syndrome
The overall injury rate for medial tibial stress syndrome (MTSS) was 0.189/1000 AEs, and the risk was almost 3 times higher (RR = 2.93, 95% CI = 2.1, 4.2) for girl athletes (0.30/1000 AEs) than boy athletes (0.10/1000 AEs). Middle school athletes were 14 times more likely to sustain an MTSS injury during practice (RR = 14.45, 95% CI = 4.9, 70.8; Table 7). The injury rate for MTSS among middle school girls was almost 16 times higher in practices than in games (RR = 15.80, 95% CI = 4.3, 132.1). Similar findings were noted for boys (RR = 13.07, 95% CI = 2.2, 526.2).
Ankle Sprains
Ankle sprains had the highest specific injury rate for boys and girls (Table 7). Girls had a higher injury rate for ankle sprains during practices (0.607/1000 AEs) than boys (0.442/1000 AEs), but boys had a slightly higher game injury rate (0.460/1000 AEs) than girls (0.452/1000 AEs). Although boys had a higher risk of ankle sprains during games and girls a higher rate of ankle sprains during practices, the differences were not significant.
Tendinitis
Tendinitis accounted for 19% of all reported injuries, with higher rates during practices (0.808/1000 AEs) than during games (0.114/1000 AEs; RR = 13.07, 95% CI = 4.6, 11.5). Patterns were similar for middle school boy and girl athletes.
DISCUSSION
Main Findings
Our results indicate that (1) the overall risk of injury was greater for boys for non–time-loss or time-loss injuries, (2) football had the highest rate of injury for both non–time-loss and time-loss injuries, (3) the risk of time-loss injuries varied for sex-matched sports, (4) the overall risk of injury was greater during practices than in games, especially for girls, (5) most injuries were mild in nature, (6) the ankle and knee had the highest incidences of injury, (7) strains, sprains, and tendinitis were the most common injury types, (8) ankle sprains were the most frequent specific injury, and (9) boy athletes were more likely to suffer concussions than girl athletes.
To our knowledge, this is the largest prospective, longitudinal study of middle school sport injuries to date. The compilation of 20 years of injury data at the same site and with the same athletic trainers is unique for both middle and secondary school programs. The duration of this study is also substantially longer than other studies at the secondary or middle school levels.3,5,7,30,31
All Injury Versus Time-Loss–Injury Rates
The reporting of non–time-loss versus time-loss injury rates remains debatable. Presently, rates based on time-loss injuries6,7,9,11 have been advocated because injuries that cause time loss may be more accurately recalled.30,32 However, a time-loss injury definition that requires a coach, parent, athletic trainer, or physician report may underestimate the true injury burden.3,30,32 Even though many injuries are not serious in nature, injuries considered minor in nature and that do not cause immediate impairment may still have long-term consequences.30 Additionally, reporting non–time-loss injuries may provide a better perspective of the daily workload of the athletic trainer. In reporting both non–time-loss and time-loss injuries, we noted that the rates for non–time-loss injuries were higher than for time-loss injuries. These findings support those of other youth3,30 and collegiate32 studies in which rates have been reported using both injury definitions. Our results suggest that non–time-loss injury rates should be used to reflect the true extent of the problem, but the difficulty of collecting accurate data in most settings (eg, lack of enough athletic trainers at the middle school level to identify and record the non–time-loss injuries) may preclude this recommendation. Given that our study may be the first to describe injuries in most middle school girls' and boys' sports, additional research is needed to confirm these findings.
Although middle school sport participation levels increased over the 20-year period, the total number of injuries decreased. However, the number and percentage of day-loss injuries increased over the same time period. The greater participation by girls in athletics, both interscholastic and club sports, may explain the change in the occurrence of injuries. Over the 20-year period, the girl athletes may have become more competitive and less likely to report a minor injury to the athletic trainer or coach in order to continue participation in the sport. The reasons for these changes in severity are not clear. We speculate that the athletes may be reporting only those injuries they consider more problematic, rather than the nuisance injuries that may have little effect on their participation level.
Because data for middle school sport injuries are limited, we used reports from secondary school and some collegiate studies for comparison. Based on our data, middle school girls were more likely to sustain an injury during athletic participation than their male counterparts in the same sport. This finding is consistent with secondary school injury surveillance reports by Comstock et al,11 Rechel et al,33 and Powell and Barber-Foss.7 However, similar to reports at the high school and collegiate levels, injury rates varied by sport.11,14,32,34–36
Sex Comparisons
Overall, we observed a difference between practice and game injury rates for girls but no such difference for boys. This is consistent with findings of secondary school studies.8,15,37 Middle school cross-country girl athletes reported a higher injury rate than their male counterparts, which is also consistent with other studies.7,8,37 Rauh et al8 suggested that girl runners might be more apt to report minor pain complaints than boys. Girls' and boys' soccer players reported higher injury-incidence rates in games than in practices, which is consistent with previous studies.15,38
Practices Versus Games
Our findings indicated that the injury risk was greater during practices than during competition for all sports except football, gymnastics, and male wrestling. This finding is in contrast to previous observations at the secondary school level,7,9,10,16,33,39 where higher rates occurred during competitions than during practices in all sports. Our findings are also noteworthy because practices are conducted daily in the competitive interscholastic middle school setting, compared with community-based programs in which practices may take place only twice per week. Dompier et al30 noted that youth football players sustain more game injuries, which is consistent with our findings. In a study of school children, Backx et al40 reported that basketball and soccer players were at 3 times greater risk of injury during games than during practices. This result is in direct contrast to our finding that middle school boy basketball players were at more risk of injury during practices than during games. Thus, except for a few sports, such as football, gymnastics, and wrestling, in which coverage is known to be needed at competitions, we suggest that middle school administration and athletic departments also ensure that appropriate medical coverage is available at practices for those middle school sports with greater injury risks.41
Team Contact Sports
Basketball
In this study, middle school girl and boy basketball players reported similar injury rates for all injuries and time-loss injuries. Both girl and boy basketball players had higher injury rates during practices than games, but the rates were only different for boys. Our findings are in contrast to those at the high school level demonstrating greater injury rates in boys than girls.5,7,23,33,39 Furthermore, authors7,33,39 of several high school studies have noted that girl basketball players were more likely to sustain an injury in games than in practices.
Football
Similar to all levels of play, middle school football players had the highest injury rate of all sports.3,4,7,11,42–44 Our findings for all injuries, overall (16.03/1000 AEs) and time loss (8.49/1000 AEs), are similar to those reported by Dompier et al30 (17.8/1000 AEs and 10.7/1000 AEs, respectively) among youth football players. Regarding time-loss injuries only, our rate was similar to reports of youth45 (10.4/1000 AEs) and high school7 (8.1/1000 AEs) players but higher than in other youth and high school (3.54/1000 AEs43 and 4.36/1000 AEs,44 respectively) football studies. Our findings that game injury rates were greater than practice injury rates are similar to those of other youth football studies20,30,45 and suggest that the incidence of injury is likely to be higher in games than in practices at this level.
Soccer
Although middle school girl soccer players sustained a 10% higher risk of injury than middle school boy soccer players, comparison with secondary school soccer studies is somewhat difficult due to considerable variations in reported injuries for girls' and boys' secondary school soccer players.7,9,33,34 In our study, girl and boy middle school soccer players were equally likely to sustain a practice injury as a competition injury. This result is in contrast to secondary school studies7,15,33,34 in which competition injury rates have been consistently higher than practice rates for both boys and girls.
Individual Sport: Wrestling
Contemporary published data on middle school–aged boy wrestlers are limited to tournament competition data,46 with no practice injury data available. To our knowledge, injury data for female wrestlers at any level have not been reported. In our study, only 1 match injury was reported, which likely reflects the low number of interscholastic participants and matches. The overall injury rate was nearly identical for boys' and girls' wrestling. Girl wrestlers reported higher practice injury rates than boy wrestlers, and boy wrestlers' injuries were more likely to occur during matches, but the limited participation numbers for girls did not allow for appropriate statistical comparisons. The higher rate during competition for middle school boy wrestlers is consistent with that of high school7,33 and collegiate47 male wrestlers. Knowles et al34 and Rechel et al33 noted that game injuries were more frequent but reported lower injury rates in secondary school wrestlers. Agel et al47 reported a much higher match injury rate for collegiate male wrestlers.
Noncontact Sports: Team
Softball/Baseball
Epidemiologic comparisons of softball and baseball injury rates are a standard practice at all levels. In our study, the middle school baseball players had a higher injury rate than the middle school softball players. Athletes in both sports were more likely to sustain a practice injury than a game injury. This finding is in direct contrast to data presented by Radelet et al,33 who noted a higher game injury rate in a community youth baseball program. Studies of secondary school baseball5,7,10,33 and collegiate baseball25,26,48 have shown similar higher injury rates for games than for practices. Secondary school softball injury data, although less well reported,7 also revealed a greater game injury rate.
Volleyball
Middle school volleyball is one of 3 sex-matched sports in which boys had a higher injury rate than girls. Both sexes were more likely to be injured during practices, with girl and boy volleyball players at nearly 10- and 5-fold greater risk, respectively. In the only age group–related comparison compiled from a national registry, Kujala et al14 reported on volleyball injuries in the under-15-years age group: Girls reported more injuries than boys, but no comparison between practice and games was provided. Authors33 of a secondary school girl's volleyball injury study indicated a higher injury rate during games than during practices, and the only sex-matched secondary school report3 noted a nearly identical injury risk per 100 athletes. At the collegiate level, Lanese et al25 observed a higher injury rate for men than women; however, the rates were based on athletes rather than actual exposure data. Using exposure data, over a 15-year period, female collegiate volleyball players had a higher rate of injury during games than practices.49
Noncontact Sports: Individual
Cross-Country
Middle school girl cross-country runners reported a higher injury rate for all injuries than middle school boy cross-country runners. However, even though girl runners also had a higher injury rate for time-loss injuries than boy runners, the findings were not significant. Comparative middle school cross-country injury data are unavailable, but our findings agree with studies of high school8,31 and collegiate42 cross-country runners in which girl runners had a higher risk of injury than boy runners. Rauh et al8,31 reported that girl runners were at greater risk than boy runners based on time-loss injuries; our results showed a higher but nonsignificant rate. Other studies of high school cross-country runners have shown that boys had a higher6 or similar3 injury risk to girl runners, so additional studies are needed. Boy and girl cross-country runners had higher injury rates during practices than during games, yet the higher risk during practices was only significant for the boys. These results support similar findings reported by Rauh et al8,31 that cross-country runners may be at greater risk of injuries during practices than during games.
Track and Field
For middle school track-and-field athletes, girls were at higher risk for injuries as compared with boys. Although girl and boy track-and-field athletes were more likely to sustain an injury during practice than during meets, the risk was only different for the girls. Event specialist information was lacking for these middle school athletes. Published injury-rate data for secondary school track and field are varied and limited. In 1 secondary school study,6 girls had a higher injury risk than boys, whereas another study3 reported identical injury rates (per 100 athletes). Comparisons with our study are limited because none of the authors provided rates per AEs. Collegiate track and field data are equally sparse but in contrast to our findings. In 2 investigations,25,26 male track runners had a greater injury rate than female track runners. None of the authors reported practice or game injury rates; thus, comparisons cannot be made.
Severity of Injury
The reporting of minor, no–time-loss injuries may provide a more accurate picture of the athletic trainer's workload. Minor injuries accounted for more than half (57%) of all reported middle school injuries for both girl and boy athletes. To date, only 3 published studies3,30,32 have reported no–time-loss injuries, and those percentages are similar to our findings. In the only secondary school study,3 60% of injuries did not involve time loss. Youth football30 (58.6%) and collegiate32 (78%) studies have also reported similar estimates for no–time-loss injuries. Although mild injuries (1–7 days lost) for girls and for the overall sample were more likely to occur during practices, severe injuries (22 or more days lost) were more likely to occur during games, especially for boys.
Injury Location
Lower extremity injuries accounted for 70% of all days-lost injuries for middle school athletes. This finding is comparable with data reported at the high school7,11 and collegiate levels.35 Ankle and knee injuries have been the most commonly reported injuries in published literature,3,5,7,34 and our results indicate that these body parts are also the most likely to be affected at the middle school level. Ankle injuries had the highest injury rate for both sexes in practices and games. Knee injuries were the second highest rate for boys and third highest rate for girls. Shin/calf injuries were the second most frequently reported injury for girls and third most frequently reported for boys. Wrist/hand/finger injuries were more common for boys. In studies assessing multiple high school sports, Beachy et al3 observed that shin injuries were the third most reported injury for secondary school athletes, with girls reporting a higher injury frequency than boys. At the collegiate level, Lanese et al25 noted that 7% to 8% of injuries involved the shin/calf. In summary, the high incidence of shin/calf injuries reflects the need to monitor conditioning and running programs for the middle school–aged athlete.
Specific Injury Types
Small injury numbers may warrant cautious data interpretation, regardless of injury site and sex. This is true for the rotator cuff and ACL injuries reported in this study because the small numbers limit the comparative value for middle school athletes. We will try to retain that objectivity when discussing these injuries.
Concussions
Reports on the incidence and effects of concussion have primarily focused on football players at all competitive levels. We found that 2.2% of middle school football players incurred a concussion, a value consistent with that noted by Dompier et al30 (2.7% of youth football players) but unlike that of Turbeville et al20 (none among middle school–aged football players over 2 years). Our concussion injury rates of 0.067/1000 AEs and 4.0 per 100 football players are lower than those reported at the high school and collegiate levels. Gerberich et al50 reported 19 injuries per 100 secondary school football players (24% of all injuries reported). Guskiewicz et al51,52 stated that 5.6% of secondary school and 6.3% of collegiate football players surveyed sustained at least 1 concussion. Our lower rate may be attributed to the lack of physical maturity and the associated reduced collision intensity, but football continues to have the highest concussion rate at the middle school level.
In this study, concussions accounted for 0.4% of all injuries to girls and 1.0% of all injuries for boys. Overall, boy athletes were 3 times more likely to incur a concussion than girl athletes. In a study of youth soccer players reporting to the emergency room, Adams and Schiff 53 also found that boys were more likely (7.8%) to sustain a concussion injury than girls (0.5%). However, when we excluded concussion injuries that occurred in football players, the risk was similar. At the high school level, the risk of concussion injury by sex appears equivocal, with some studies indicating a greater risk for girls9,39 and others54 showing a greater risk for boys. At the collegiate level, however, the risk of concussion for sex-matched sports appears to be higher for female than male athletes.35
We noted that the incidence of concussion injuries was 3 times higher during games than during practices. This finding is in agreement with studies of middle school,20 high school,7,11,32 and collegiate athletes35,55 and suggests that the intensity of impact and risk taking may be greater in games.
Concussion guidelines changed during the 20-year period of this study. During the 1980s and 1990s, the Colorado Medical Society56 and the American Academy of Neurology guidelines57 allowed return to activity if symptoms resolved within 15 minutes of the injury. The 7 athletes with no–time-loss concussions were in this category.
Anterior Cruciate Ligament Injuries
Injuries to the ACL are concerning due to the severity and the time lost from participation and because females are at greater risk of injury than males in matched sports. Only 8 ACL injuries (0.6% of all injuries) occurred during the 20-year period. The overall injury rate of 0.009/1000 AEs was much lower than the rates reported in high school studies7,9,11 and the 0.15/1000 AEs observed by Hootman et al35 for all collegiate sports. In collegiate football, ACL injuries accounted for 3% of all collegiate sport injuries, with an injury rate of 0.018/1000 AEs.35 We found similar risks of ACL injuries for girl and boy middle school athletes but different risks than those reported at the high school,36 military,58 and collegiate59 levels. It may be that the female middle school athletes had not reached the pubertal or maturational levels that have been suggested to affect their hormonal, structural, and neuromuscular traits and possibly put them at greater risk of injury.36,58
Medial Tibial Stress Syndrome
Our finding that the risk of MTSS was higher for girl athletes than boy athletes is consistent with values reported at the high school level.60,61 For both girl and boy athletes, MTSS was more likely to be reported in practices than in games. We are unaware of any studies of MTSS by participation setting. The higher occurrence of MTSS during practices may be related to training errors, including overly repetitive activities or training regimens with short recovery times.31,60 Further research is needed to help identify these factors.
Limitations
The primary limitation of our study was that all injury and participation data were collected from only 1 private school that has sufficient resources to employ more than 1 full-time athletic trainer. Thus, the extent to which our findings are generalizable is unknown. Therefore, these results await comparison with the results of future investigations among middle school athletes. Because only a few athletic trainers were involved in this study, evaluating and reporting of the data were performed consistently and with little variation. An additional potential limitation of our study was the possibility of nonreporting bias. Again, the injury-reporting system at Punahou School is longstanding, and the procedures for middle school athletes to report any injury, regardless of severity, have been fostered throughout the 20-year period. Some sports had too few injuries or participation numbers by sex for ample statistical comparisons. These sports may be new to the middle school population, resulting in limited participation, or the sport may have a lower injury risk. Some athletes may have had self-treated injuries (eg, tendinitis, minor contusions) that were not reported to the athletic training staff. Finally, most middle schools in the United States do not allow ninth-grade participation in middle school sports.
We hope that our initial findings for these sports will provide the impetus for all middle schools to report their data in these sports for comparative purposes. We used an injury-surveillance design, so detailed data on each injured athlete were not available. Thus, efforts should be focused toward implementing epidemiologic studies designed to identify risk factors in these athletes at the middle school level.
CONCLUSIONS
Middle school athletes who participated in an extensive interscholastic program sustained a wide variety of sport injuries. The frequency and severity of those injuries were less severe than injuries reported for the secondary school and collegiate athlete. Injuries were more likely during practices than during games. In matched middle school sports, girls exhibited a higher injury rate than their male counterparts. Football continues to have the highest injury rate for all sports. Concussions and ACL injuries were less common than at the secondary level.
With injury assessment and the cooperation of coaches, athletic trainers, and parents, modifications to training and conditioning programs can enable the middle school athlete to compete successfully with limited time lost from activity. Additional middle school injury-surveillance data are needed from a variety of settings, both public and private, and for all sports to better understand the injury patterns of the middle school athlete.
ACKNOWLEDGMENTS
For their assistance in injury management and care over the past 20 years, special thanks to Beth Ann Young, ATC; Darryl Funai, ATC; and Matt Martinson, ATC. Thanks also to Cedric Akau, MD; Timothy Olderr, MD; and Ron Hanagami, RPT, for their guidance and input while working with our many athletes.
REFERENCES
- 1.Emery CA. Risk factors for injury in child and adolescent sport: a systematic review of the literature. Clin J Sport Med. 2003;13(4):256–268. doi: 10.1097/00042752-200307000-00011. [DOI] [PubMed] [Google Scholar]
- 2.The National Federation of State High School Associations. 2009 http://www.nfhs.org. Accessed June 15. [Google Scholar]
- 3.Beachy G, Akau CK, Martinson M, Olderr TF. High school sports injuries: a longitudinal study at Punahou School, 1988 to 1996. Am J Sports Med. 1997;25(5):675–681. doi: 10.1177/036354659702500515. [DOI] [PubMed] [Google Scholar]
- 4.Chambers RB. Orthopaedic injuries in athletes (ages 6 to 17): comparison of injuries occurring in six sports. Am J Sports Med. 1979;7(3):195–197. doi: 10.1177/036354657900700312. [DOI] [PubMed] [Google Scholar]
- 5.Garrick JG, Requa RK. Injuries in high school sports. Pediatrics. 1978;61(3):465–469. doi: 10.1542/peds.61.3.465. [DOI] [PubMed] [Google Scholar]
- 6.McLain LG, Reynolds S. Sports injuries in a high school. Pediatrics. 1989;84(3):446–450. [PubMed] [Google Scholar]
- 7.Powell JW, Barber-Foss KD. Injury patterns in selected high school sports: a review of the 1995–1997 seasons. J Athl Train. 1999;34(3):277–284. [PMC free article] [PubMed] [Google Scholar]
- 8.Rauh MJ, Margherita AJ, Rice SG, Koepsell TD, Rivara FP. High school cross country injuries: a longitudinal study. Clin J Sport Med. 2000;10(2):110–116. doi: 10.1097/00042752-200004000-00005. [DOI] [PubMed] [Google Scholar]
- 9.Yard EE, Schroeder MJ, Fields SK, Collins CL, Comstock RD. The epidemiology of United States high school soccer injuries, 2005–2007. Am J Sports Med. 2008;36(10):1930–1937. doi: 10.1177/0363546508318047. [DOI] [PubMed] [Google Scholar]
- 10.Collins CL, Comstock RD. Epidemiological features of high school baseball injuries in the United States, 2005–2007. Pediatrics. 2008;121(6):1181–1187. doi: 10.1542/peds.2007-2572. [DOI] [PubMed] [Google Scholar]
- 11.Comstock RD, Knox C, Yard E, Gilchrist J. Sports-related injuries among high school athletes—United States, 2005–06 school year. MMWR Morb Mortal Wkly Rep. 2006;55(38):1037–1040. [PubMed] [Google Scholar]
- 12.National Center for Sports Safety. 2009 http://www.sportssafety.org/content/Home.aspx. Accessed September 21. [Google Scholar]
- 13.Committee on Sports Medicine and Fitness. Injuries in youth soccer: a subject review. Pediatrics. 2000;105(3):659–661. [PubMed] [Google Scholar]
- 14.Kujala UM, Taimela S, Antti-Poika I, Orava S, Tuominen R, Myllynen P. Acute injuries in soccer, ice hockey, volleyball, basketball, judo, and karate: analysis of national registry data. BMJ. 1995;311(7018):1465–1468. doi: 10.1136/bmj.311.7018.1465. [DOI] [PMC free article] [PubMed] [Google Scholar]
- 15.Le Gall F, Carling C, Reilly T. Injuries in young elite female soccer players: an 8-season prospective study. Am J Sports Med. 2008;36(2):276–284. doi: 10.1177/0363546507307866. [DOI] [PubMed] [Google Scholar]
- 16.Leininger RE, Knox CL, Comstock RD. Epidemiology of 1.6 million pediatric soccer-related injuries presenting to US emergency departments from 1990 to 2003. Am J Sports Med. 2007;35(2):288–293. doi: 10.1177/0363546506294060. [DOI] [PubMed] [Google Scholar]
- 17.Soderman K, Adolphson J, Lorentzon R, Alfredson H. Injuries in adolescent female players in European football: a prospective study over one outdoor soccer season. Scand J Med Sci Sports. 2001;11(5):299–304. doi: 10.1034/j.1600-0838.2001.110508.x. [DOI] [PubMed] [Google Scholar]
- 18.McEwin CK, Swain J. Clearing the Hurdles: Issues and Answers in Middle School Sports. Westerville, OH: National Middle School Association; 2007. pp. 13–32. [Google Scholar]
- 19.Collins HR. Contact sports in junior high school. Texas Med. 1967;63(10):67–69. [PubMed] [Google Scholar]
- 20.Turbeville SD, Cowan LD, Asal NR, Owen WL, Anderson MA. Risk factors for injury in middle school football players. Am J Sports Med. 2003;31(2):276–281. doi: 10.1177/03635465030310022001. [DOI] [PubMed] [Google Scholar]
- 21.McGuine T. Sports injuries in high school athletes: a review of injury-risk and injury-prevention research. Clin J Sport Med. 2006;16(6):488–499. doi: 10.1097/01.jsm.0000248848.62368.43. [DOI] [PubMed] [Google Scholar]
- 22.Pasque CB, Hewett TE. A prospective study of high school wrestling injuries. Am J Sports Med. 2000;28(4):509–515. doi: 10.1177/03635465000280041101. [DOI] [PubMed] [Google Scholar]
- 23.Messina DF, Farney WC, DeLee JC. The incidence of injury in Texas high school basketball: a prospective study among male and female athletes. Am J Sports Med. 1999;27(3):294–299. doi: 10.1177/03635465990270030401. [DOI] [PubMed] [Google Scholar]
- 24.Yang J, Marshall SW, Bowling JM, Runyan CW, Mueller FO, Lewis MA. Use of discretionary protective equipment and rate of lower extremity injury in high school athletes. Am J Epidemiol. 2005;161(6):511–519. doi: 10.1093/aje/kwi077. [DOI] [PubMed] [Google Scholar]
- 25.Lanese RR, Strauss RH, Leizman DJ, Rotondi AM. Injury and disability in matched men's and women's intercollegiate sports. Am J Public Health. 1990;80(12):1459–1462. doi: 10.2105/ajph.80.12.1459. [DOI] [PMC free article] [PubMed] [Google Scholar]
- 26.Sallis RE, Jones K, Sunshine S, Smith G, Simon L. Comparing sports injuries in men and women. Int J Sports Med. 2001;22(6):420–423. doi: 10.1055/s-2001-16246. [DOI] [PubMed] [Google Scholar]
- 27.Aubry M, Cantu R, Dvorak J, et al. Summary and agreement statement of the First International Conference on Concussion in Sport, Vienna 2001: recommendations for the improvement of safety and health of athletes who may suffer concussive injuries. Br J Sports Med. 2002;36(1):6–10. doi: 10.1136/bjsm.36.1.6. [DOI] [PMC free article] [PubMed] [Google Scholar]
- 28.McCrory P, Johnston K, Meeuwisse W, et al. Summary and agreement statement of the 2nd International Conference on Concussion in Sport, Prague 2004. Br J Sports Med. 2005;39(4):196–204. doi: 10.1136/bjsm.2005.018614. [DOI] [PMC free article] [PubMed] [Google Scholar]
- 29.McCrory P, Meeuwisse W, Johnston K, et al. Consensus statement on concussion in sport: the 3rd International Conference on Concussion in Sport, held in Zurich, November 2008. J Clin Neurosci. 2009;16(6):755–763. doi: 10.1016/j.jocn.2009.02.002. [DOI] [PubMed] [Google Scholar]
- 30.Dompier TP, Powell JW, Barron MJ, Moore MT. Time-loss and non–time-loss injuries in youth football players. J Athl Train. 2007;42(3):395–402. [PMC free article] [PubMed] [Google Scholar]
- 31.Rauh MJ, Koepsell TD, Rivara FP, Margherita AJ, Rice SG. Epidemiology of musculoskeletal injuries among high school cross-country runners. Am J Epidemiol. 2006;163(2):151–159. doi: 10.1093/aje/kwj022. [DOI] [PubMed] [Google Scholar]
- 32.Caine D, Caine C, Maffulli N. Incidence and distribution of pediatric sport-related injuries. Clin J Sport Med. 2006;16(6):500–513. doi: 10.1097/01.jsm.0000251181.36582.a0. [DOI] [PubMed] [Google Scholar]
- 33.Radelet MA, Lephart SM, Rubinstein EN, Myers JB. Survey of the injury rate for children in community sports. Pediatrics. 2002 doi: 10.1542/peds.110.3.e28. 110(3):e28. [DOI] [PubMed] [Google Scholar]
- 34.Powell JW, Dompier TP. Analysis of injury rates and treatment patterns for time-loss and non–time-loss injuries among collegiate student-athletes. J Athl Train. 2004;39(1):56–70. [PMC free article] [PubMed] [Google Scholar]
- 35.Rechel JA, Yard EE, Comstock RD. An epidemiologic comparison of high school sports injuries sustained in practice and competition. J Athl Train. 2008;43(2):197–204. doi: 10.4085/1062-6050-43.2.197. [DOI] [PMC free article] [PubMed] [Google Scholar]
- 36.Knowles SB, Marshall SW, Bowling MJ, et al. Risk factors for injury among high school football players. Epidemiology. 2009;20(2):302–310. doi: 10.1097/EDE.0b013e318193107c. [DOI] [PubMed] [Google Scholar]
- 37.Hootman JM, Dick R, Agel J. Epidemiology of collegiate injuries for 15 sports: summary and recommendations for injury prevention initiatives. J Athl Train. 2007;42(2):311–319. [PMC free article] [PubMed] [Google Scholar]
- 38.Ingram JG, Fields SK, Yard EE, Comstock RD. Epidemiology of knee injuries among boys and girls in US high school athletics. Am J Sports Med. 2008;36(6):1116–1122. doi: 10.1177/0363546508314400. [DOI] [PubMed] [Google Scholar]
- 39.Borowski LA, Yard EE, Fields SK, Comstock RD. The epidemiology of US high school basketball injuries, 2005–2007. Am J Sports Med. 2008;36(12):2328–2335. doi: 10.1177/0363546508322893. [DOI] [PubMed] [Google Scholar]
- 40.Backx FJ, Beijer HJ, Bol E, Erich WB. Injuries in high-risk persons and high-risk sports: a longitudinal study of 1818 school children. Am J Sports Med. 1991;19(2):124–130. doi: 10.1177/036354659101900206. [DOI] [PubMed] [Google Scholar]
- 41.Committee on Sports Medicine and Fitness. Medical conditions affecting sports participation. Pediatrics. 2001;107(5):1205–1209. doi: 10.1542/peds.107.5.1205. [DOI] [PubMed] [Google Scholar]
- 42.Buckley WE, Powell J. NAIRS: an epidemiological overview of the severity of injury in college football 1975–80 seasons. J Athl Train. 1982;17(4):279–282. [Google Scholar]
- 43.Knowles SB, Marshall SW, Bowling JM, et al. A prospective study of injury incidence among North Carolina high school athletes. Am J Epidemiol. 2006;164(12):1209–1221. doi: 10.1093/aje/kwj337. [DOI] [PubMed] [Google Scholar]
- 44.Shankar PR, Fields SK, Collins CL, Dick RW, Comstock RD. Epidemiology of high school and collegiate football injuries in the United States, 2005–2006. Am J Sports Med. 2007;35(8):1295–1303. doi: 10.1177/0363546507299745. [DOI] [PubMed] [Google Scholar]
- 45.Malina RM, Morano PJ, Barron M, Miller SJ, Cumming SP, Kontos AP. Incidence and player risk factors for injury in youth football. Clin J Sport Med. 2006;16(3):214–222. doi: 10.1097/00042752-200605000-00005. [DOI] [PubMed] [Google Scholar]
- 46.Lorish TR, Rizzo TD, Jr, Ilstrup DM, Scott SG. Injuries in adolescent and preadolescent boys at two large wrestling tournaments. Am J Sports Med. 1992;20(2):199–202. doi: 10.1177/036354659202000218. [DOI] [PubMed] [Google Scholar]
- 47.Agel J, Ransone J, Dick R, Oppliger R, Marshall SW. Descriptive epidemiology of collegiate men's wrestling injuries: National Collegiate Athletic Association Injury Surveillance System, 1988–1989 through 2003–2004. J Athl Train. 2007;42(2):303–310. [PMC free article] [PubMed] [Google Scholar]
- 48.Dick R, Sauers EL, Agel J, et al. Descriptive epidemiology of collegiate men's baseball injuries: National Collegiate Athletic Association Injury Surveillance System, 1988–1989 through 2003–2004. J Athl Train. 2007;42(2):183–193. [PMC free article] [PubMed] [Google Scholar]
- 49.Agel J, Palmieri-Smith RM, Dick R, Wojtys EM, Marshall SW. Descriptive epidemiology of collegiate women's volleyball injuries: National Collegiate Athletic Association Injury Surveillance System, 1988–1989 through 2003–2004. J Athl Train. 2007;42(2):295–302. [PMC free article] [PubMed] [Google Scholar]
- 50.Gerberich SG, Priest JD, Boen JR, Straub CP, Maxwell RE. Concussion incidences and severity in secondary school varsity football players. Am J Public Health. 1983;73(12):1370–1375. doi: 10.2105/ajph.73.12.1370. [DOI] [PMC free article] [PubMed] [Google Scholar]
- 51.Guskiewicz KM, Weaver NL, Padua DA, Garrett WE., Jr Epidemiology of concussion in collegiate and high school football players. Am J Sports Med. 2000;28(5):643–650. doi: 10.1177/03635465000280050401. [DOI] [PubMed] [Google Scholar]
- 52.Guskiewicz KM, McCrea M, Marshall SW, et al. Cumulative effects associated with recurrent concussion in collegiate football players: the NCAA Concussion Study. JAMA. 2003;290(19):2549–2555. doi: 10.1001/jama.290.19.2549. [DOI] [PubMed] [Google Scholar]
- 53.Adams AL, Schiff MA. Childhood soccer injuries treated in U.S. emergency departments. Acad Emerg Med. 2006;13(5):571–574. doi: 10.1197/j.aem.2005.12.015. [DOI] [PubMed] [Google Scholar]
- 54.Schulz MR, Marshall SW, Mueller FO, et al. Incidence and risk factors for concussion in high school athletes, North Carolina, 1996–1999. Am J Epidemiol. 2004;160(10):937–944. doi: 10.1093/aje/kwh304. [DOI] [PubMed] [Google Scholar]
- 55.Dick RW. Is there a gender difference in concussion incidence and outcomes? Br J Sports Med. 2009;43((suppl 1)):i46–i50. doi: 10.1136/bjsm.2009.058172. [DOI] [PubMed] [Google Scholar]
- 56.Colorado Medical Society Sports Medicine Committee. Guidelines for the management of concussion in sports. Proceedings of the Mild Brain Injury in Sports Summit. Dallas, TX: National Athletic Trainers' Association; 1994. pp. 106–109. [Google Scholar]
- 57.Kelly JP, Rosenberg JH. The development of guidelines for the management of concussion in sports. J Head Trauma Rehabil. 1998;13(2):53–65. doi: 10.1097/00001199-199804000-00008. [DOI] [PubMed] [Google Scholar]
- 58.Mountcastle SB, Posner M, Kragh JF, Jr, Taylor DC. Gender differences in anterior cruciate ligament injury vary with activity: epidemiology of anterior cruciate ligament injuries in a young, athletic population. Am J Sports Med. 2007;35(10):1635–1642. doi: 10.1177/0363546507302917. [DOI] [PubMed] [Google Scholar]
- 59.Agel J, Arendt EA, Bershadsky B. Anterior cruciate ligament injury in national collegiate athletic association basketball and soccer: a 13-year review. Am J Sports Med. 2005;33(4):524–530. doi: 10.1177/0363546504269937. [DOI] [PubMed] [Google Scholar]
- 60.Plisky MS, Rauh MJ, Tank RT, Heiderscheit BC, Underwood FB. Medial tibial stress syndrome among high school cross country runners: incidence and risk factors. J Orthop Sports Phys Ther. 2007;37(2):40–47. doi: 10.2519/jospt.2007.2343. [DOI] [PubMed] [Google Scholar]
- 61.Bennett JE, Reinking MF, Pluemer B, Pentel A, Seaton M, Killan C. Factors contributing to the development of medial tibial stress syndrome in high school runners. J Orthop Sports Phys Ther. 2001;31(9):504–510. doi: 10.2519/jospt.2001.31.9.504. [DOI] [PubMed] [Google Scholar]