

Abstract
Objectives. We assessed cancer care disparities within the Veterans Affairs (VA) health care system and whether between-hospital differences explained disparities.
Methods. We linked VA cancer registry data with VA and Medicare administrative data and examined 20 cancer-related quality measures among Black and White veterans diagnosed with colorectal (n = 12 897), lung (n = 25 608), or prostate (n = 38 202) cancer from 2001 to 2004. We used logistic regression to assess racial disparities for each measure and hospital fixed-effects models to determine whether disparities were attributable to between- or within-hospital differences.
Results. Compared with Whites, Blacks had lower rates of early-stage colon cancer diagnosis (adjusted odds ratio [AOR] = 0.80; 95% confidence interval [CI] = 0.72, 0.90), curative surgery for stage I, II, or III rectal cancer (AOR = 0.57; 95% CI = 0.41, 0.78), 3-year survival for colon cancer (AOR = 0.75; 95% CI = 0.62, 0.89) and rectal cancer (AOR = 0.61; 95% CI = 0.42, 0.87), curative surgery for early-stage lung cancer (AOR = 0.50; 95% CI = 0.41, 0.60), 3-dimensional conformal or intensity-modulated radiation (3-D CRT/IMRT; AOR = 0.53; 95% CI = 0.47, 0.59), and potent antiemetics for highly emetogenic chemotherapy (AOR = 0.87; 95% CI = 0.78, 0.98). Adjustment for hospital fixed-effects minimally influenced racial gaps except for 3-D CRT/IMRT (AOR = 0.75; 95% CI = 0.65, 0.87) and potent antiemetics (AOR = 0.95; 95% CI = 0.82, 1.10).
Conclusions. Disparities in VA cancer care were observed for 7 of 20 measures and were primarily attributable to within-hospital differences.
Compared with all other racial/ethnic groups, Blacks in the United States experience the greatest burden of death from all of the most common cancer types.1 Past research indicates that racial/ethnic disparities in care and outcomes exist for many conditions, but that these disparities are attenuated in the Veterans Affairs (VA) health care system, where financial barriers to care are substantially reduced for eligible veterans.2–4 Recent work suggests that cancer care in the VA is comparable with or of better quality than care provided to insured individuals in the private sector5–7; however, less is known about the extent of cancer-related disparities in the VA.
Much of the research examining racial/ethnic disparities in the VA has focused on cardiovascular disease, mental health, or preventive and ambulatory care.8 The few studies that have assessed cancer disparities have generated mixed findings, with some studies observing disparities in cancer care and others reporting equitable care for Black and White veterans.2,3,9–12 However, these studies have typically focused on a few cancer types or quality measures, or have examined care in a limited number of VA hospitals. Moreover, these studies offer little insight into the factors that might account for any observed cancer care disparities within the entire VA.
A variety of factors contribute to lower care quality and excess burden of death among Blacks in the United States, including differential access to health care, socioeconomic status, and racial differences in receipt of recommended care.13–16 Differences in where Black and White cancer patients receive care may also contribute to disparities. US hospital care is highly concentrated for Black Americans, with facilities caring for a larger share of Black patients (minority-serving institutions) often providing lower quality care than hospitals that serve nonminorities.17,18 In addition, racial differences in hospital site of care have been linked to disparities in receipt of recommended care and outcomes.17,19,20
In this study, we assessed the extent of race-based cancer care disparities in the VA across a range of cancer types and measures. In addition, we examined whether racial differences in where cancer patients were treated explained any observed disparities in cancer care and outcomes, assessing whether racial disparities were mainly attributable to between- or within-hospital differences in the VA.
METHODS
We obtained data via the VA Central Cancer Registry on patients who were diagnosed with cancer or received their first course of cancer therapy in the VA from 2001 to 2004. The registry maintains information on patient demographic characteristics, tumor characteristics, and primary treatment of each incident cancer. Registry data were linked with additional data from 2000 to 2005, including VA administrative data (inpatient, outpatient, pharmacy, and laboratory data), Medicare administrative data (for Medicare-eligible veterans), and pain score data from office visits. These data were also linked to the 2000 Census data to obtain zip code–level measures of socioeconomic status and the National Death Index to determine patient vital status through 2005.
We studied veterans with lung, colorectal, or prostate cancer, which are the most prevalent cancers among veterans. As described previously,6 we excluded small numbers of patients (n = 1083 colorectal; n = 1089 lung; n = 500 prostate) whose cancers were reported based on autopsy or death certificate, for whom no reporting source was available, patients for whom data were incomplete (e.g., missing month of diagnosis, patients with no administrative data between 45 days before diagnosis through 195 days after diagnosis), or patients with histologic features suggesting a primary cancer other than the cancer of interest. We also restricted our cohorts to non-Hispanic Black and White veterans because we were primarily interested in Black and White differences in care; the number of patients in other racial/ethnic subgroups was small. The final cohorts included 12 897 colorectal cancer patients (n = 10 027 colon; n = 2870 rectal), 25 608 lung cancer patients, and 38 202 prostate cancer patients spanning 118 VA medical centers.
Cancer Care Performance Measures
We consulted with oncology specialists to identify measures of quality along the continuum of cancer care. In total, we assessed 20 cancer-related process and outcome measures (e.g., early diagnosis, curative surgery, primary and adjuvant chemotherapy, radiation, and survival)6,7,21 that reflected evidence-based nationally recommended guidelines for colorectal cancer, lung cancer, prostate cancer, and palliative or supportive cancer care from 2001 to 2005.22–34 In our broader study,6,7 we also identified quality measures for hematological cancers, but we did not include these measures in this analysis because the number of Black hematological cancer patients was too small to ensure adequate statistical power. However, 1061 hematological cancer patients were included in at least 1 of the palliative or supportive care measure cohorts.
Additional details about each measure and cohort eligibility are included in Table 1.
TABLE 1—
Measures of Recommended Processes of Cancer Care and Outcomes: Racial Disparities in Cancer Care in the Veterans Affairs Health Care System, United States, 2001–2004
| Quality Measure | Definition | Cohort |
| Colorectal cancer | ||
| Early stage (stage I/II vs III/IV) at presentation, colon cancer | Patients diagnosed with stage I and II vs stage III and IV colon cancer. | All patients with stage I–IV colon cancer. |
| Early stage (stage I/II vs III/IV) at presentation, rectal cancer | Patients diagnosed with stage I and II vs stage III and IV rectal cancer. | All patients with stage I–IV rectal cancer. |
| Curative surgery for stage I, II, or III colon cancer22 | Proportion of patients with stage I, II, or III colon cancer who underwent curative resection within 180 d of diagnosis; polypectomy/local excision of the tumor for stage 1 T1 tumors that have well- or moderately differentiated tumor grades were also included. | All stage I/II/III colon cancer patients. Patients had to be alive and not enrolled in a Medicare HMO through 180 d from surgery. |
| Curative surgery for stage I, II, or III rectal cancer23 | Proportion of patients with stage I, II, or III colon cancer who underwent curative resection within 180 d of diagnosis; polypectomy/local excision of the tumor for stage 1 T1 tumors that have well- or moderately differentiated tumor grades were also included. | All stage I/II/III rectal cancer patients. Patients had to be alive and not enrolled in a Medicare HMO through 180 d from surgery. |
| Adjuvant chemotherapy for stage III colon cancer22 | Receipt of adjuvant 5 fluorouracil or capecitabine within 90 d following curative-intent resection of stage III colon cancer. | All stage III colon cancer patients who underwent curative-intent resection. Patients had to be alive and not enrolled in a Medicare HMO through 90 d from surgery. |
| Adjuvant chemotherapy and radiation therapy for stage II or III rectal cancer23 | Receipt of both adjuvant chemotherapy with 5-fluorouracil or capecitabine and radiation therapy before or within 140 d following curative intent resection for stage II or III rectal cancer. | All stage II/III rectal cancer patients who underwent curative-intent resection. Patients had to be alive and not enrolled in a Medicare HMO through 180 d from surgery. |
| 3-year all cause survival for colon cancer | Proportion of patients alive 3 y after the date of diagnosis. | All patients diagnosed with colon cancer during 2001 and 2002. |
| 3-year all cause survival for rectal cancer | Proportion of patients alive 3 y after the date of diagnosis. | All patients diagnosed with rectal cancer during 2001 and 2002. |
| Lung cancer | ||
| Curative surgery for stage I or II non-small cell lung cancer24 | Pneumonectomy, lobectomy, or wedge or segmental resection within 180 d of diagnosis. | All stage I/II non-small cell lung cancer patients. Patients had to be alive and not enrolled in a Medicare HMO through 180 d from diagnosis. Patients were also included if they died within 180 d but underwent surgery. |
| Mediastinal evaluation for stage I or II non-small cell lung cancer24 | Mediastinal evaluation from 45 d before diagnosis through the date of surgery. | All stage I/II non-small cell lung cancer patients who underwent lobectomy or pneumonectomy. Patients had to be alive and not enrolled in a Medicare HMO through 180 d from surgery. |
| Chemotherapy or radiation for resected stage IIIA non-small cell lung cancer24 | Chemotherapy or radiation therapy from 30 d before diagnosis through 90 d after date of surgery. | All stage IIIA non-small cell lung cancer patients who underwent lobectomy or pneumonectomy or wedge resection. Patients had to be alive and not enrolled in a Medicare HMO through 90 d from surgery. |
| Chemotherapy and radiation for limited-stage small cell lung cancer25 | Cisplatin or carboplatin and etoposide with concurrent radiation therapy within 180 d of diagnosis; chemotherapy must start between the start and end dates of radiation therapy. | All limited-stage small cell lung cancer patients. Patients had to be alive through 45 d from diagnosis and not enrolled in a Medicare HMO through 180 d from diagnosis. |
| 1-year all cause survival for non-small cell lung cancer | Proportion of patients alive 1 y after the date of diagnosis. | All patients with non-small cell lung cancer. |
| 1-year all cause survival for small cell lung cancer | Proportion of patients alive 1 y after the date of diagnosis. | All patients with small cell lung cancer. |
| Prostate cancer | ||
| Androgen ablation within 120 d for men with stage IV prostate cancer27,28,30,31 | Androgen deprivation therapy with a GnRH agonist or bilateral orchiectomy within 120 d of diagnosis. | All prostate cancer patients with stage IV cancer at diagnosis. Patients had to be alive and not enrolled in a Medicare HMO through 120 d from diagnosis. |
| Oral anti-androgen before initiating GnRH agonist therapy for metastatic prostate cancer26 | Proportion of men with metastatic cancer who are started on GnRH agonist who also fill a prescription for an oral antiandrogen for at least 2 wk, beginning at least 1 wk before first dose of GnRH agonist. | All prostate cancer patients with stage IV cancer at diagnosis who started a GnRH agonist. |
| Adjuvant androgen deprivation therapy for high-risk prostate cancers treated with radiation therapy26 | Proportion of patients with high-risk prostate cancer (Gleason 8–10 or PSA > 20 or stage T3 or greater) treated with radiation who also receive hormonal therapy (adjuvant or neoadjuvant). | All prostate cancer patients with high risk, nonmetastatic tumors treated with radiation therapy within 180 d of diagnosis. Patients were required to be alive and not enrolled in a Medicare HMO through 180 d from diagnosis. We only included cases in 2001–2002 because Gleason 7 tumors could not be distinguished from Gleason 8 tumors in 2003–2004. |
| 3-D CRT or IMRT for prostate cancer patients treated with EBRT26,29,32 | Receipt of 3-D CRT or IMRT among men with local or regional prostate cancer who received external beam radiation therapy within 180 d of diagnosis. | All prostate cancer patients with local or regional prostate cancer at diagnosis who also had evidence of EBRT in administrative data. Patients had to be alive and not enrolled in a Medicare HMO through 180 d from diagnosis. |
| Palliative/supportive care | ||
| Use of potent antiemetics for highly emetogenic chemotherapy33 | Receipt of 5-HT blockade (administered intravenously or orally) among patients treated with highly emetogenic chemotherapy. 5-HT blockade assessed from 30 d before date of first dose of a highly emetogenic chemotherapy through 30 d following last dose of the same chemotherapy. | All patients with colorectal cancer, lung cancer, prostate cancer, non-Hodgkin lymphoma, or multiple myeloma who are treated with 1 of the highly emetogenic chemotherapy drugs, including adriamycin, cisplatin, carbo-platin, cyclophosphamide, ifosphamide, idarubicin, epirubicin, daunorubicin. Patients could not be in a Medicare HMO during the time window of interest. |
| Prescription of narcotic pain medication for advanced cancer patients in pain34 | Opioid prescription filled in stage IV patients with 2 consecutive pain scores ≥ 5; script must be filled during the period between the 2 pain scores. | All patients with colorectal cancer, lung cancer, prostate cancer, non-Hodgkin lymphoma, or multiple myeloma diagnosed at Stage IV who have 2 consecutive pain scores of ≥ 5 from 3 to 30 d apart with no lower pain score between and no hospitalization. Patients could not be in a Medicare HMO during the time window of interest. |
Note. 3-D CRT = 3-dimensional conformal radiotherapy; 5-HT = 5-hydroxytryptamine; EBRT = electron beam radiation therapy; GnRH = gonadotropin-releasing hormone; HMO = health maintenance organization; IMRT = intensity-modulated radiation therapy; PSA = prostate-specific antigen.
Covariates
The independent variable of primary interest was patient race/ethnicity (non-Hispanic White and non-Hispanic Black). Race/ethnicity was reported by the registry based on self-identified information collected at VA enrollment. In infrequent cases where data were missing, registrars used medical record data. Patient-level sociodemographic characteristics included age, gender, marital status, and area-level socioeconomic status (reliable patient-level socioeconomic status data were unavailable) based on the zip code of the patient’s residence (median household income, percentage of college graduates, and percentage of persons living below the poverty level).
Patient-level clinical characteristics included presence of comorbidities (measured using the Klabunde modification of the Charlson comorbidity score35,36 separating chronic obstructive pulmonary disease from the Charlson comorbidity score for lung cancer analyses), history of any cancer, year of diagnosis, American Joint Committee on Cancer stage37 at diagnosis (historic stage for prostate cancer), tumor size, and tumor grade.
Analyses
We first conducted descriptive analyses to assess racial differences in each process and outcome measure and sociodemographic and clinical characteristics. We then categorized hospitals into deciles of hospital racial concentration (i.e., the proportion of patients with cancer who were Black). For measures that exhibited racial differences (i.e., disparity measures), we plotted rates of the measures for patients cared for at hospitals with increasing proportions of Black patients. Next, we estimated bivariate regression models that predicted hospital-level rates of each disparity measure as a function of hospital racial concentration.
Modeling approach.
We estimated a series of logistic regression models (1 for each measure) to assess the effect of patient race on the odds of receiving recommended care and survival (model 1). The covariates we examined varied slightly across models. All models were adjusted for age, gender (except prostate cancer models), marital status, history of cancer, Charlson comorbidity score, and diagnosis year. Lung cancer models included chronic obstructive pulmonary disease as a covariate. In treatment and survival models, we also adjusted for tumor grade and stage, and survival models also adjusted for tumor size. We also adjusted for cancer type in the palliative or supportive care models.
Racial disparities in care could be attributed to several factors, including racial differences in where care was received (between-hospital differences) and differences in the care provided to individual patients at a given hospital (within-hospital differences). A between-hospital explanation of racial disparities in care might highlight the disproportionate share of minority patients receiving care at lower quality hospitals, whereas a within-hospital explanation might suggest inequitable treatment patterns across patients of different racial backgrounds within the same facility. Each race effect from model 1 reflected a total effect of race (within-hospital + between-hospital differences) on the receipt of care (or survival) after adjusting for patient-level characteristics. To determine the extent of between- versus within-hospital effects on disparities in cancer care, we also adjusted for hospital-level fixed effects in a second set of models using conditional logistic regression (model 2). Hospital-level fixed effects models controlled for any hospital factors (between-hospital differences) that might be associated with cancer care (e.g., access to cancer specialists and medical technologies).38,39 Thus, the race parameter estimates from the hospital-level fixed effects model (model 2) reflected the within-hospital component of the disparity and could be compared with the race parameter estimates obtained from model 1 to make determinations regarding the extent of between- versus within-hospital disparities in cancer care.
Accounting for socioeconomic status.
The Institute of Medicine’s (IOM’s) definition of health care disparities accounts for all racial/ethnic differences in care that are mediated through factors other than patient preferences and health status.14 This definition acknowledges that minorities typically have lower socioeconomic profiles than Whites, that such differences can influence health care quality and use, and as a result, includes such racial differences in socioeconomic status (e.g., income, education) in the accounting of total disparities. This definition of racial/ethnic disparities in care suggests that adjusting for socioeconomic status may reduce or eliminate the estimated independent effect of race on care.40 In accordance with the IOM’s definition of health care disparities, we did not adjust for socioeconomic status in our main models. Thus, our disparity estimates reflect the “independent effect” of race and not a “residual direct effect” of race on care. However, because understanding where disparities in care might arise is important to addressing health inequities, we conducted additional analyses to assess whether differences in socioeconomic status accounted for any observed disparities in cancer care and survival.
Adjustment for multiple comparisons.
Lastly, we adjusted our results for multiple comparisons using the Benjamini–Hochberg (B–H) procedure, a sequential approach to controlling the false discovery rate associated with multiple comparisons. The B–H procedure has been shown to yield greater statistical power than the more widely used Bonferroni correction, which controls the family wise error rate.41,42 In the B–H approach, P values obtained from a family of tests (family size = m) are ordered from largest to smallest and sequentially compared with a list of B–H critical values that range from α to α/m. Use of the B–H approach has become widespread in the field of genetics and other life sciences, and for over a decade, the National Center for Education Statistics has employed the B–H approach in reporting results from the National Assessment of Educational Progress41,43–46
All analyses were conducted using SAS version 9.3 (SAS Institute, Cary, NC).
RESULTS
Table 2 shows characteristics of each cancer cohort by race. Across all cancer cohorts, compared with White patients, Black patients were younger, less likely to be married, and more likely to reside in areas with higher poverty, less college education, and lower median income.
TABLE 2—
Characteristics of Cancer Cohorts by Race: Racial Disparities in Cancer Care in the Veterans Affairs Health Care System, United States, 2001–2004
| Colorectal Cancer |
Lung Cancer |
Prostate Cancer |
||||
| Characteristics | White (n = 10 636) | Black (n = 2261) | White (n = 21 077) | Black (n = 4531) | White (n = 27 889) | Black (n = 10 313) |
| Age, y, % | ||||||
| < 60 | 19.7 | 27.9 | 22.2 | 29.7 | 19.3 | 30.1 |
| 60–64 | 13.0 | 10.0 | 15.1 | 11.7 | 16.4 | 15.4 |
| 65–69 | 14.5 | 11.6 | 16.4 | 13.5 | 21.0 | 18.1 |
| ≥ 70 | 52.8 | 50.5 | 46.3 | 45.1 | 43.2 | 36.4 |
| Gender, % | ||||||
| Female | 1.8 | 1.6 | 1.7 | 1.5 | ||
| Male | 98.2 | 98.5 | 98.3 | 98.5 | ||
| Marital status, % | ||||||
| Unmarried | 40.7 | 50.2 | 49.4 | 63.6 | 40.1 | 55.3 |
| Married | 56.2 | 47.5 | 48.0 | 34.7 | 57.4 | 43.0 |
| Unknown | 3.1 | 2.3 | 2.6 | 1.7 | 2.6 | 1.7 |
| History of cancer, % | ||||||
| No | 86.6 | 85.5 | 83.0 | 83.1 | 92.4 | 94.9 |
| Yes | 13.4 | 14.6 | 17.0 | 16.9 | 7.6 | 5.1 |
| Charlson comorbidity score, % | ||||||
| 0 | 52.1 | 54.0 | 61.4 | 62.2 | 62.6 | 61.6 |
| 1 | 28.1 | 26.7 | 22.4 | 21.6 | 25.2 | 24.4 |
| 2 | 11.4 | 11.2 | 9.6 | 9.1 | 8.0 | 8.1 |
| ≥ 3 | 8.3 | 8.2 | 6.6 | 7.2 | 4.2 | 5.8 |
| Year of diagnosis, % | ||||||
| 2001 | 23.0 | 25.3 | 24.2 | 25.2 | 24.6 | 24.7 |
| 2002 | 25.2 | 24.6 | 25.0 | 24.6 | 25.3 | 24.6 |
| 2003 | 25.6 | 25.7 | 25.2 | 25.7 | 24.7 | 24.9 |
| 2004 | 26.2 | 24.4 | 25.6 | 24.5 | 25.4 | 25.8 |
| Population ≥ 65 y living below poverty in zip code of residence,a % | ||||||
| Q1 (0%–7.8%) | 27.1 | 11.0 | 27.0 | 9.8 | 29.2 | 11.2 |
| Q2 (7.9%–12.7%) | 26.6 | 13.6 | 26.2 | 13.4 | 27.4 | 15.4 |
| Q3 (12.8%–19.4%) | 25.0 | 20.2 | 24.7 | 19.9 | 24.5 | 24.0 |
| Q4 (19.5%–76.9%) | 15.5 | 51.0 | 16.9 | 53.7 | 13.2 | 45.0 |
| Missing/unknown | 5.8 | 4.3 | 5.2 | 3.3 | 5.7 | 4.4 |
| Population college graduates in zip code of residence,a % | ||||||
| Q1 (< 15.9%) | 21.9 | 33.3 | 22.1 | 32.1 | 21.4 | 32.3 |
| Q2 (15.9%–21.6%) | 24.0 | 21.9 | 23.8 | 23.8 | 23.4 | 23.2 |
| Q3 (21.7%–30.0%) | 23.8 | 21.1 | 24.4 | 20.9 | 23.8 | 21.6 |
| Q4 (30.1%–100.0%) | 24.4 | 19.7 | 24.5 | 20.0 | 25.7 | 18.5 |
| Missing/unknown | 5.8 | 4.1 | 5.2 | 3.2 | 5.7 | 4.4 |
| Median income in zip code of residence,a $ | 45 919 | 39 347 | 45 722 | 38 456 | 46 055 | 39 859 |
Note. Q = quartile.
Per 2000 US Census data.
Table 3 displays unadjusted rates for each process and outcome measure stratified by race. For 8 of the 20 measures (40%), Black cancer patients had lower rates of recommended care or survival than White patients. Of note, Blacks exhibited higher unadjusted rates of oral antiandrogen before initiating gonadotropin-releasing hormone (GnRH) agonist therapy for metastatic prostate cancer.
TABLE 3—
Unadjusted and Adjusted Associations of Race With Recommended Cancer Care and Survival: Racial Disparities in Cancer Care in the Veterans Affairs Health Care System, United States, 2001–2004
| Eligible Patients |
Performance Rates |
||||||
| Quality Measure | No. White | No. Black | White % | Black % | Unadjusted Differences Black–White % (95% CI) | Model 1a Black vs White, AOR (95% CI) | Model 2b Black vs White, AOR (95% CI) |
| Colorectal cancer | |||||||
| Early stage (stage I/II vs III/IV) at presentation, colon cancer | 7262 | 1694 | 60.0 | 54.0 | −6.0* (–8.6, –3.4) | 0.80*,c (0.72, 0.90) | 0.78*,c (0.70, 0.89) |
| Early stage (stage I/II vs III/IV) at presentation, rectal cancer | 2123 | 336 | 63.2 | 59.2 | −3.9 (–9.5, 1.6) | 0.87 (0.68, 1.11) | 0.87 (0.66, 1.15) |
| Curative surgery for stage I, II, or III colon cancer | 5375 | 1173 | 93.4 | 91.1 | −2.2* (–3.8, –0.6) | 0.76* (0.58, 0.98) | 0.82 (0.61, 1.12) |
| Curative surgery for stage I, II, or III rectal cancer | 1636 | 251 | 79.2 | 67.3 | −11.9* (–17.4, –6.4) | 0.57*,c (0.41, 0.78) | 0.57*,c (0.39, 0.82) |
| Adjuvant chemotherapy for stage III colon cancer | 1381 | 343 | 70.2 | 65.0 | −5.2 (–10.7, 0.2) | 0.75* (0.58, 0.98) | 0.87 (0.64, 1.18) |
| Adjuvant chemotherapy and radiation therapy for stage II or III rectal cancer | 723 | 108 | 74.0 | 79.6 | 5.6 (–3.2, 14.4) | 1.49 (0.87, 2.53) | 1.39 (0.73, 2.64) |
| 3-year all cause survival for colon cancerd | 3745 | 897 | 61.2 | 53.3 | −7.9* (–11.5, –4.3) | 0.75*,c (0.62, 0.89) | 0.78* (0.64, 0.96) |
| 3-year all cause survival for rectal cancerd | 1122 | 179 | 57.8 | 48.0 | −9.7* (–17.5, –1.9) | 0.61*,c (0.42, 0.87) | 0.66 (0.43, 1.00) |
| Lung cancer | |||||||
| Curative surgery for stage I or II non-small cell lung cancer | 3653 | 723 | 60.9 | 48.6 | −12.4* (–16.3, –8.5) | 0.50*,c (0.41, 0.60) | 0.52*,c (0.41, 0.64) |
| Mediastinal evaluation for stage I or II non-small cell lung cancer | 1956 | 298 | 88.2 | 86.2 | −2.0 (–6.0, 2.0) | 0.75 (0.52, 1.09) | 0.92 (0.59, 1.44) |
| Chemotherapy or radiation for resected stage IIIA non-small cell lung cancer | 324 | 65 | 69.8 | 78.5 | 8.7 (–3.4, 20.8) | 1.67 (0.86, 3.24) | 1.35 (0.60, 3.05) |
| Chemotherapy and radiation for limited-stage small cell lung cancer | 981 | 141 | 60.5 | 58.9 | −1.6 (–10.2, 7.1) | 0.96 (0.66, 1.41) | 0.80 (0.51, 1.25) |
| 1-year all cause survival for non-small cell lung cancer | 17 848 | 4059 | 40.6 | 39.5 | −1.1 (–2.8, 0.6) | 1.06 (0.98, 1.15) | 1.05 (0.96, 1.15) |
| 1-year all cause survival for small cell lung cancer | 3203 | 465 | 26.6 | 26.2 | −0.4 (–4.6, 4.0) | 1.04 (0.82, 1.33) | 1.07 (0.82, 1.39) |
| Prostate cancer | |||||||
| Androgen ablation within 120 d for men with stage IV prostate cancer | 1014 | 571 | 73.8 | 74.8 | 1.0 (–3.5, 5.5) | 1.08 (0.84, 1.37) | 0.99 (0.73, 1.33) |
| Oral anti-androgen before initiating GnRH agonist therapy for metastatic prostate cancer | 916 | 535 | 78.4 | 83.2 | 4.8* (5.4, 9.1) | 1.34* (1.01, 1.77) | 0.99 (0.70, 1.41) |
| Adjuvant androgen deprivation therapy for high-risk cancers treated with radiation therapy | 2853 | 970 | 56.5 | 55.5 | −1.0 (–4.6, 2.6) | 1.01 (0.87, 1.18) | 0.86 (0.72, 1.04) |
| 3-D CRT or IMRT for prostate cancer patients treated with EBRT | 5731 | 2056 | 64.3 | 48.0 | −16.3* (–18.8, –3.9) | 0.53*,c (0.47, 0.59) | 0.75*,c (0.65, 0.87) |
| Palliative/supportive care | |||||||
| Use of potent antiemetics for highly emetogenic chemotherapy | 8579 | 1898 | 71.6 | 69.0 | −2.6* (–4.8, –0.3) | 0.87*,c (0.78, 0.98) | 0.95 (0.82, 1.10) |
| Prescription of narcotic pain medication for advanced cancer patients in pain | 2030 | 638 | 68.3 | 67.9 | −0.5 (–4.6, 3.7) | 1.04 (0.85, 1.27) | 1.04 (0.83, 1.31) |
Note. 3-D CRT = 3-dimensional conformal radiation therapy; AOR = adjusted odds ratio; CI = confidence interval; EBRT = external beam radiation therapy; GnRH = gonadotropin releasing hormone; IMRT = intensity modulated radiation therapy. All models were adjusted for age, gender (except prostate cancer models), marital status, cancer history, Charlson comorbidity score, and year of diagnosis. Lung cancer models also included chronic obstructive pulmonary disease as a covariate, and for this group, the Charlson score was calculated without chronic obstructive pulmonary disease. Treatment and survival models were adjusted for tumor grade and stage, and survival models were also adjusted for tumor size. Palliative/supportive care models were adjusted for cancer type.
Model 1 corresponds to adjusted logistic regression models excluding hospital fixed effects.
Model 2 corresponds to adjusted logistic regression models including hospital fixed effects.
Statistically significant after applying Benjamini-Hochberg multiple comparisons adjustment.
Three-year survival for colon and rectal cancers captures patients diagnosed during 2001 and 2002.
*P < .05.
Overall, approximately one quarter of VA hospitals (n = 30 hospitals) cared for nearly 70% of all Black cancer patients in the VA. Among hospitals in the lowest decile of Black racial concentration, 0% to 1% of their cancer patients were Black versus 45% to 72% of cancer patients in hospitals in the highest decile. Hospital Black racial concentration was not associated with receipt of recommended care for 6 of the 8 measures (75%), exhibiting lower unadjusted rates for Blacks relative to Whites, including curative surgery for stage I, II, or III rectal cancer (P = .54; Figure 1). We did observe a statistically significant negative association between the proportion of Black patients at each hospital and receipt of 3-dimensional conformal radiation therapy or intensity-modulated radiation therapy (3-D CRT/IMRT) for prostate cancer patients treated with external-beam radiation therapy (P = .001; Figure 1) and 3-year all-cause survival for colon cancer (P = .02; data not shown). We also observed greater receipt of oral antiandrogen before initiating GnRH agonist therapy for metastatic prostate cancer at hospitals with more Black patients (P = .04; data not shown).
FIGURE 1—
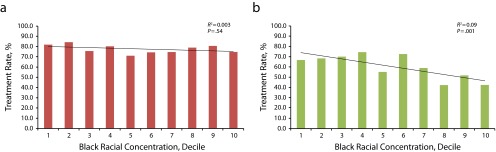
Hospital-level rates of recommended treatment plotted against deciles of Black racial concentration across VA hospitals for (a) curative surgery for stage I, II, and III rectal cancer, and (b) 3-dimensional conformal radiation therapy or intensity-modulated radiation therapy for prostate cancer: Racial Disparities in Cancer Care in the Veterans Affairs Health Care System, United States, 2001–2004.
Note. Test statistics are from bivariate regression analyses predicting hospital-level rates of each measure as a function of hospital racial concentration reported in each part.
Main Adjusted Models
In covariate-adjusted logistic regression analyses, 9 of the 20 measures initially exhibited statistically significant lower rates of treatment of Black versus White patients; however, after adjustment for multiple comparisons, only 7 of these associations remained statistically significant. Compared with White patients, Black patients had less early-stage diagnosis of colon cancer (adjusted odds ratio [AOR] = 0.80; 95% confidence interval [CI] = 0.72, 0.90), less curative surgery for stage I, II, or III rectal cancer (AOR = 0.57; 95% CI = 0.41, 0.78), lower 3-year all-cause survival for colon cancer (AOR = 75; 95% CI = 0.62, 0.89) and rectal cancer (AOR = 0.61; 95% CI = 0.42, 0.87), less curative surgery for early stage non-small cell lung cancer (AOR = 0.50; 95% CI = 0.41, 0.60), less 3-D CRT/IMRT (AOR = 0.53; 95% CI = 0.47, 0.59), and were less likely to receive potent antiemetics for highly emetogenic chemotherapy (AOR = 0.87; 95% CI = 0.78, 0.98; Table 3; model 1; see data available as a supplement to the online version of this article at http://www.ajph.org for detailed results from B–H multiple comparisons adjustment).
For 5 of these 7 quality measures with lower quality for Black versus White patients, additional adjustment for VA hospital fixed effects explained only a very small portion (0%–13%) of the observed racial gaps in performance (Table 3; model 2). In the case of potent antiemetics for patients who received highly emetogenic chemotherapy, the race-associated OR changed from a statistically significant 0.87 (95% CI = 0.78, 0.98) to a nonstatistically significant 0.95 (95% CI = 0.82, 1.10) after adjustment for hospital fixed effects. Inclusion of hospital fixed effects had a substantial effect on 1 measure, receipt of 3-D CRT/IMRT, where the race-associated OR changed from 0.53 (95% CI = 0.47, 0.59) to 0.75 (95% CI = 0.65, 0.87) after adjusting for site of care.
We observed 1 measure where Black patients had higher rates in adjusted analyses: receipt of oral antiandrogens before initiating GnRH agonist therapy for metastatic prostate cancer (AOR = 1.34; 95% CI = 1.01, 1.77). This higher rate was completely explained by site of care (AOR = 0.99; 95% CI = 0.70, 1.41). However, the association in the first model was not statistically significant after multiple comparisons adjustment.
Models Adjusted for Socioeconomic Status
Additional adjustment for area-level socioeconomic status (median household income, percentage of college graduates, and percentage of persons living below the poverty level) in separate analyses accounted for a relatively small portion (2%–23%) of the observed racial gaps in performance and yielded estimates that were generally consistent with our overall results (data available as a supplement to this article at http://www.ajph.org).
DISCUSSION
We assessed racial disparities in the quality of cancer care and outcomes within the VA health care system and the extent to which site of care accounted for any observed disparities in care and outcomes. For 13 of the 20 quality measures (65%) examined, Black and White patients received similar care. These findings were consistent with previous research that suggested that disparities in care were mitigated in the VA.2,3 However, we did observe racial disparities in several cancer care measures. We also observed low treatment rates (< 80%) among both racial groups across several measures, highlighting the inherent challenge of improving cancer care and outcomes. Adjustment for socioeconomic status had relatively little impact on racial disparities in care and survival. This finding might reflect the “equal access” nature of the VA, which reduces financial barriers to care for veterans and ultimately helps to lessen potential socioeconomic disparities in care.
Previous studies indicate that in the private sector, racial disparities in care are often driven by differences in where Black and White patients receive care.20,38,47 For example, a national study of racial disparities in acute myocardial infarction treatment and outcomes among Medicare beneficiaries found that racial disparities in nonsurgical medical treatments and outcomes substantially narrowed after adjusting for site of care.38 This site of care explanation for health care disparities is plausible because of the high degree of racial concentration in US hospital care and other evidence demonstrating lower quality care among hospitals treating a higher proportion of Black patients.17,19,20 Few studies have examined the association between health care disparities and site of care in the VA setting; those that have are consistent with our study, suggesting that health care disparities are explained more by within-hospital differences than between-hospital differences in the VA. One study that examined disparities in 30-day mortality rates across 6 conditions (acute myocardial infarction, hip fracture, stroke, congestive heart failure, gastrointestinal hemorrhage, and pneumonia) found that for most conditions, mortality rates were similar among hospitals that served minorities and nonminorities in the VA, and there was very little variation in the magnitude of disparities across hospitals.18 A more recent study that assessed the quality of VA ambulatory or preventive care for diabetes, cardiovascular disease, hypertension, and cancer screening found that racial disparities were mainly driven by within-hospital differences.48 There were high levels of racial concentration within relatively few VA hospitals. However, we found little evidence to suggest that differences in where Black and White patients received care contributed to disparities in cancer care. This lack of between-hospital disparities could be a result of ongoing system-wide quality initiatives undertaken by the VA.
It was unclear from this study which within-hospital factors might account for observed disparities; however, previous work suggests that longstanding disparities in curative surgery11,13,20 might be linked to racial differences in treatment preferences, clinician uncertainty, or bias in treatment offerings.14,49,50 Disparities in colorectal cancer patient survival might be partly attributed to disparities in colorectal cancer early-stage diagnosis, which might reflect racial differences in screening,48,51–53 and curative surgery. Because of the persistence of within-hospital disparities in the VA, identifying and addressing the within-hospital drivers of these cancer-related disparities should be a research and policy priority.
Nevertheless, we observed some evidence of between-hospital differences in care for 2 measures. In the case of 3-D CRT/IMRT, we observed a substantial between-hospital effect that accounted for nearly half of a relatively large adjusted racial gap in care. This finding was likely attributable to differences in the timing of adoption of these advanced radiation therapy techniques across VA hospitals. Adoption of 3-D CRT/IMRT involves large investments in expensive medical equipment and the hiring of specialized staff,54 which might be delayed in a system such as the VA, which has a fixed budget and does not have the financial incentives to adopt new technologies compared with the private sector. The National Comprehensive Cancer Network guidelines began recommending use of 3-D CRT in 2001, and nearly all VA hospitals adopted 3-D CRT/IMRT by 2006. Our findings suggested that the hospitals where more Black prostate cancer patients received care might have lagged behind other hospitals in the adoption of 3-D CRT/IMRT. We also observed some evidence that smaller racial differences in receipt of potent antiemetics for highly emetogenic chemotherapy might be partly explained by site of care; it will be important for the VA to be certain that there are no differences in the availability of these medications that could explain these results.
Strengths and Limitations
Our study’s strengths included the comprehensive measurement of cancer care quality, using both process and outcome measures, across the entire VA. As suggested by the IOM, we primarily assessed total racial disparities in cancer care, but we also examined residual disparities in care after socioeconomic status adjustment. Future disparities studies should incorporate modeling approaches that reflect the IOM definition of racial disparities in health care. Furthermore, to our knowledge, no study explored site of care explanations for VA cancer care disparities.
Our study’s limitations included the focus on Black and White veterans diagnosed with cancer in the first half of the last decade; the findings may not necessarily generalize to other racial/ethnic groups or more recently diagnosed patients. Although more recent data would be ideal, other evidence suggests that disparities in cancer care and outcomes have persisted over time in the VA and the private sector.11,55–57 A few recent studies found that disparities in cancer screening and some forms of nonsurgical treatment were less pronounced in the VA than the private sector, or were nonexistent.12,58,59 However, other work suggested that racial disparities in surgical treatment and survival among cancer patients have remained a challenge for the VA.8,11,60 Our study, which distinguished between the within-hospital and between-hospital sources of these health care inequities, therefore, remains relevant and important to understanding cancer-related disparities in the VA.
Second, we studied quality for 3 common cancers. It was unclear whether these findings generalize to other types of cancer, particularly less common forms of cancer. Third, we assessed socioeconomic status using area-level measures because reliable patient-level socioeconomic status data were unavailable. Although area-level measures are often used when individual-level socioeconomic status measures are unavailable, past research indicates that area-level measures provide complementary contextual information on socioeconomic status and might not fully capture socioeconomic effects at the individual level.61 In addition, we were unable to account for additional patient-level factors that could affect the treatment decision-making process, including racial differences in preferences for treatment and performance status.
Also, we used Medicare claims data to capture out of VA care among Medicare-eligible veterans; however, we might have missed care outside of the VA among veterans with private insurance who were not Medicare eligible. Still, other evidence suggests that older veterans with cancers diagnosed or treated in the VA received very little cancer surgery outside of the VA.62 In exploratory analyses, we also observed that few older VA patients received chemotherapy or radiation therapy outside of the VA. Finally, low statistical power might have obscured true racial differences in care for some measures with smaller cohorts like chemotherapy or radiation for resected stage IIIA non-small cell lung cancer. However, post hoc power analyses revealed that most of our measure cohorts included a sufficiently large number of patients to detect at least a 10% point absolute difference in care by race.
Conclusions
Racial disparities in cancer care and outcomes in the VA were present for approximately a third of the measures we assessed, and when present, were primarily driven by racial differences in care for Black and White patients within the same hospital, rather than racial differences in where care was received. Future efforts should focus on understanding the sources of these within-hospital disparities. However, differential patterns in the adoption of new technologies and use of medications across VA hospitals are potential sources of cancer disparities that deserve further exploration.
Acknowledgments
This work was funded by the Department of Veterans Affairs through the Office of Policy and Planning, a Ruth L. Kirschstein National Research Service Award, and the Harvard University Graduate Prize Fellowship. Data assembly and analyses and article writing were conducted by researchers at Harvard Medical School and Abt Associates. One coauthor is an employee of the Department of Veterans Affairs.
We would like to thank Jeffrey Souza for expert programming assistance, and Garrett Kirk for research assistance. We are grateful for helpful feedback from the VA Oncology Program Evaluation Team, especially members with extensive clinical oncology experience within the VA system, including, Albert Muhleman, MD (Cincinnati VAMC); Nirmala Bhoopalam, MD (Hines, IL VAMC); Paulette Mehta, MD (VHA); Dawn Provenzale, MD, MS (VA HSR&D Researcher in Durham, NC); Michael Kelley, MD (Chief of Oncology, VHA); Robert Kerns, PhD (National Program Director for Pain Management, VHA); and the chief VACCR registrar, Raye Anne Dorn (VHA–DC VAMC). We also thank Marshall Amesquita and Barbara Stephens, COTR, and the rest of our VA Oncology Program Evaluation Team: Stanlie Daniels (VHA), Heidi Martin (VHA), Diana Ordin (VHA), Karen Pane (VA), Archna Sharma, MD (VHA), Anecia Thibodeau (VHA), and Patricia Vandenberg (VHA OP&P). A team of persons from the Veterans Affairs Office of Policy and Planning and clinicians from the Veterans Health Administration reviewed the measures and the research findings, provided feedback to the investigative team, and approved the final article.
This article was presented on June 22, 2013, at the National Research Service Award Research Trainees Conference and on June 23, 2013, at the Annual Research Meeting of Academy Health in Baltimore, MD.
Note. The views in this article reflect those of the authors and not necessarily the Department of Veterans Affairs.
Human Participant Protection
The study was approved by the Harvard Medical School Human Subjects Committee.
References
- 1.Howlader N, Noone A, Krapcho M SEER Cancer Statistics Review, 1975–2009 (Vintage 2009 Populations). National Cancer Institute. 2012. Available at: http://seer.cancer.gov/csr/1975_2009_pops09. Accessed April 22, 2013.
- 2.Freeman VL, Durazo-Arvizu R, Arozullah AM, Keys LC. Determinants of mortality following a diagnosis of prostate cancer in Veterans Affairs and private sector health care systems. Am J Public Health. 2003;93(10):1706–1712. doi: 10.2105/ajph.93.10.1706. [DOI] [PMC free article] [PubMed] [Google Scholar]
- 3.Optenberg SA, Thompson IM, Friedrichs P, Wojcik B, Stein CR, Kramer B. Race, treatment, and long-term survival from prostate cancer in an equal-access medical care delivery system. JAMA. 1995;274(20):1599–1605. [PubMed] [Google Scholar]
- 4.Trivedi AN, Grebla RC. Quality and equity of care in the Veterans Affairs health-care system and in Medicare advantage health plans. Med Care. 2011;49(6):560–568. doi: 10.1097/MLR.0b013e31820fb0f6. [DOI] [PubMed] [Google Scholar]
- 5.Keating NL, Landurm M, Lamont E, Earle C, Bozeman S, McNeil B. End-of-life care for older cancer patients in the Veterans Health Administration versus the private sector. Cancer. 2010;116(15):3732–3739. doi: 10.1002/cncr.25077. [DOI] [PubMed] [Google Scholar]
- 6.Keating NL, Landrum MB, Lamont EB et al. Quality of care for older patients with cancer in the Veterans Health Administration versus the private sector: a cohort study. Ann Intern Med. 2011;154(11):727–736. doi: 10.7326/0003-4819-154-11-201106070-00004. [DOI] [PubMed] [Google Scholar]
- 7.Landrum MB, Keating NL, Lamont EB et al. Survival of older patients with cancer in the Veterans Health Administration versus fee-for-service Medicare. J Clin Oncol. 2012;30(10):1072–1079. doi: 10.1200/JCO.2011.35.6758. [DOI] [PMC free article] [PubMed] [Google Scholar]
- 8.Saha S, Freeman M, Toure J, Tippens KM, Weeks C, Ibrahim S. Racial and ethnic disparities in the VA health care system: a systematic review. J Gen Intern Med. 2008;23(5):654–671. doi: 10.1007/s11606-008-0521-4. [DOI] [PMC free article] [PubMed] [Google Scholar]
- 9.Dominitz JA, Samsa GP, Landsman P, Provenzale D. Race, treatment, and survival among colorectal carcinoma patients in an equal-access medical system. Cancer. 1998;82(12):2312–2320. doi: 10.1002/(sici)1097-0142(19980615)82:12<2312::aid-cncr3>3.0.co;2-u. [DOI] [PubMed] [Google Scholar]
- 10.Powell IJ, Schwartz K, Hussain M. Removal of the financial barrier to health care: does it impact on prostate cancer at presentation and survival? A comparative study between black and white men in a Veterans Affairs system. Urology. 1995;46(6):825–830. doi: 10.1016/S0090-4295(99)80352-5. [DOI] [PubMed] [Google Scholar]
- 11.Williams CD, Stechuchak KM, Zullig LL, Provenzale D, Kelley MJ. Influence of comorbidity on racial differences in receipt of surgery among US veterans with early-stage non-small-cell lung cancer. J Clin Oncol. 2013;31(4):475–481. doi: 10.1200/JCO.2012.44.1170. [DOI] [PMC free article] [PubMed] [Google Scholar]
- 12.Zullig LL, Carpenter WR, Provenzale D, Weinberger M, Reeve BB, Jackson GL. Examining potential colorectal cancer care disparities in the Veterans Affairs health care system. J Clin Oncol. 2013;31(28):3579–3584. doi: 10.1200/JCO.2013.50.4753. [DOI] [PMC free article] [PubMed] [Google Scholar]
- 13.Bach PB, Cramer LD, Warren JL, Begg CB. Racial differences in the treatment of early-stage lung cancer. N Engl J Med. 1999;341(16):1198–1205. doi: 10.1056/NEJM199910143411606. [DOI] [PubMed] [Google Scholar]
- 14.Institute of Medicine. Unequal Treatment: Confronting Racial and Ethnic Disparities in Health Care. Washington, DC: National Academy Press; 2003. [PubMed] [Google Scholar]
- 15.National Cancer Institute. Cancer Health Disparities Factsheet. 2008. Available at: http://www.cancer.gov/cancertopics/factsheet/disparities/cancer-health-disparities. Accessed February 26, 2012.
- 16.Wang M, Burau KD, Fang S, Wang H, Du XL. Ethnic variations in diagnosis, treatment, socioeconomic status, and survival in a large population-based cohort of elderly patients with non-Hodgkin lymphoma. Cancer. 2008;113(11):3231–3241. doi: 10.1002/cncr.23914. [DOI] [PMC free article] [PubMed] [Google Scholar]
- 17.Jha AK, Orav EJ, Li Z, Epstein AM. Concentration and quality of hospitals that care for elderly black patients. Arch Intern Med. 2007;167(11):1177–1182. doi: 10.1001/archinte.167.11.1177. [DOI] [PubMed] [Google Scholar]
- 18.Jha AK, Stone R, Lave J, Chen H, Klusaritz H, Volpp K. The concentration of hospital care for black veterans in Veterans Affairs hospitals: implications for clinical outcomes. J Healthc Qual. 2010;32(6):52–61. doi: 10.1111/j.1945-1474.2010.00085.x. [DOI] [PubMed] [Google Scholar]
- 19.Keating NL, Kouri E, He Y, Weeks JC, Winer EP. Racial differences in definitive breast cancer therapy in older women: are they explained by the hospitals where patients undergo surgery? Med Care. 2009;47(7):765–773. doi: 10.1097/MLR.0b013e31819e1fe7. [DOI] [PubMed] [Google Scholar]
- 20.Lathan CS, Neville BA, Earle CC. Racial composition of hospitals: effects on surgery for early-stage non-small-cell lung cancer. J Clin Oncol. 2008;26(26):4347–4352. doi: 10.1200/JCO.2007.15.5291. [DOI] [PMC free article] [PubMed] [Google Scholar]
- 21.Keating NL, Landrum MB, Lamont EB, Bozeman SR, Shulman LN, McNeil BJ. Tumor boards and the quality of cancer care. J Natl Cancer Inst. 2013;105(2):113–121. doi: 10.1093/jnci/djs502. [DOI] [PMC free article] [PubMed] [Google Scholar]
- 22.National Comprehensive Cancer Network (NCCN) Fort Washington, PA: NCCN; 2001. Clinical Practice Guidelines in Oncology. Colon Cancer. Version 1.2001. [Google Scholar]
- 23.NCCN. Fort Washington, PA: NCCN; 2001. Clinical Practice Guidelines in Oncology. Rectal Cancer. Version 1.2001. [Google Scholar]
- 24.NCCN. Fort Washington, PA: NCCN; 2001. Clinical Practice Guidelines in Oncology. Lung Cancer. Version 1.2001. [Google Scholar]
- 25.Laurie SA, Logan D, Markman BR, Mackay JA, Evans WK. Practice guideline for the role of combination chemotherapy in the initial management of limited-stage small-cell lung cancer. Lung Cancer. 2004;43(2):223–240. doi: 10.1016/j.lungcan.2003.09.002. [DOI] [PubMed] [Google Scholar]
- 26.NCCN. Fort Washington, PA: NCCN; 2001. Clinical Practice Guidelines in Oncology. Prostate Cancer. Version 1.2001. [Google Scholar]
- 27.The Medical Research Council Prostate Cancer Working Party Investigators Group. Immediate versus deferred treatment for advanced prostatic cancer: initial results of the Medical Research Council Trial. Br J Urol. 1997;79(2):235–246. doi: 10.1046/j.1464-410x.1997.d01-6840.x. [DOI] [PubMed] [Google Scholar]
- 28.Bahnson RR, Hanks GE, Huben RP et al. NCCN practice guidelines for prostate cancer. Oncology (Williston Park) 2000;14(11A):111–119. [PubMed] [Google Scholar]
- 29.Dearnaley DP, Khoo VS, Norman AR et al. Comparison of radiation side-effects of conformal and conventional radiotherapy in prostate cancer: a randomised trial. Lancet. 1999;353(9149):267–272. doi: 10.1016/S0140-6736(98)05180-0. [DOI] [PubMed] [Google Scholar]
- 30.Huggins C, Stevens RE, Hodges CV. Studies on prostate cancer. II. The effects of castration on advanced carcinoma of the prostate gland. Arch Surg. 1941;43(2):209–233. [Google Scholar]
- 31.Huggins C, Hodges CV. Studies on prostate cancer. I. The effects of castration, of estrogen, and of androgen injection on serum phosphatases in metastatic carcinoma of the prostate. Cancer Res. 1941;1(4):293–297. doi: 10.3322/canjclin.22.4.232. [DOI] [PubMed] [Google Scholar]
- 32.Pisansky TM. External-beam radiotherapy for localized prostate cancer. N Engl J Med. 2006;355(15):1583–1591. doi: 10.1056/NEJMct055263. [DOI] [PubMed] [Google Scholar]
- 33.NCCN. Fort Washington, PA: NCCN; 2001. Clinical Practice Guidelines in Oncology. Antiemesis. Version 1.2001. [Google Scholar]
- 34.NCCN. Fort Washington, PA: NCCN; 2001. Clinical Practice Guidelines in Oncology. Cancer Pain. Version 1.2001. [Google Scholar]
- 35.Charlson ME, Pompei P, Ales KL, MacKenzie CR. A new method of classifying prognostic comorbidity in longitudinal studies: development and validation. J Chronic Dis. 1987;40(5):373–383. doi: 10.1016/0021-9681(87)90171-8. [DOI] [PubMed] [Google Scholar]
- 36.Klabunde CN, Potosky AL, Legler JM, Warren JL. Development of a comorbidity index using physician claims data. J Clin Epidemiol. 2000;53(12):1258–1267. doi: 10.1016/s0895-4356(00)00256-0. [DOI] [PubMed] [Google Scholar]
- 37.American Joint Committee on Cancer. AJCC Cancer Staging Manual. 6th ed. New York, NY: Springer Science; 2002. [Google Scholar]
- 38.Barnato AE, Lucas FL, Staiger D, Wennberg DE, Chandra A. Hospital-level racial disparities in acute myocardial infarction treatment and outcomes. Med Care. 2005;43(4):308–319. doi: 10.1097/01.mlr.0000156848.62086.06. [DOI] [PMC free article] [PubMed] [Google Scholar]
- 39.Localio AR, Berlin JA, Ten Have TR, Kimmel SE. Adjustments for center in multicenter studies: an overview. Ann Intern Med. 2001;135(2):112–123. doi: 10.7326/0003-4819-135-2-200107170-00012. [DOI] [PubMed] [Google Scholar]
- 40.McGuire TG, Alegria M, Cook BL, Wells KB, Zaslavsky AM. Implementing the Institute of Medicine definition of disparities: an application to mental health care. Health Serv Res. 2006;41(5):1979–2005. doi: 10.1111/j.1475-6773.2006.00583.x. [DOI] [PMC free article] [PubMed] [Google Scholar]
- 41.Thissen D, Steinberg L, Kuang D. Quick and easy implementation of the Benjamini-Hochberg procedure for controlling the false positive rate in multiple comparisons. J Educ Behav Stat. 2002;27(1):77–83. [Google Scholar]
- 42.Williams VSL, Jones LV, Tukey JW. Controlling error in multiple comparisons, with examples from state-to-state differences in educational achievement. J Educ Behav Stat. 1999;24:42–69. [Google Scholar]
- 43.Nyholt DR. A simple correction for multiple testing for single-nucleotide polymorphisms in linkage disequilibrium with each other. Am J Hum Genet. 2004;74(4):765–769. doi: 10.1086/383251. [DOI] [PMC free article] [PubMed] [Google Scholar]
- 44.Patti ME, Butte AJ, Crunkhorn S et al. Coordinated reduction of genes of oxidative metabolism in humans with insulin resistance and diabetes: potential role of PGC1 and NRF1. Proc Natl Acad Sci U S A. 2003;100(14):8466–8471. doi: 10.1073/pnas.1032913100. [DOI] [PMC free article] [PubMed] [Google Scholar]
- 45.Yu YP, Landsittel D, Jing L et al. Gene expression alterations in prostate cancer predicting tumor aggression and preceding development of malignancy. J Clin Oncol. 2004;22(14):2790–2799. doi: 10.1200/JCO.2004.05.158. [DOI] [PubMed] [Google Scholar]
- 46.National Center for Education Statistics. Comparison of Multiple Groups: The Benjamini-Hochberg False Discovery Rate (FDR) Procedure. 2009. Available at: http://nces.ed.gov/nationsreportcard/tdw/analysis/2000_2001/infer_multiplecompare_fdr.asp. Accessed March 21, 2013.
- 47.Smith DB, Feng Z, Fennell ML, Zinn JS, Mor V. Separate and unequal: racial segregation and disparities in quality across US nursing homes. Health Aff (Millwood) 2007;26(5):1448–1458. doi: 10.1377/hlthaff.26.5.1448. [DOI] [PubMed] [Google Scholar]
- 48.Trivedi AN, Grebla RC, Wright SM, Washington DL. Despite improved quality of care in the Veterans Affairs health system, racial disparity persists for important clinical outcomes. Health Aff (Millwood) 2011;30(4):707–715. doi: 10.1377/hlthaff.2011.0074. [DOI] [PubMed] [Google Scholar]
- 49.George M, Margolis ML. Race and lung cancer surgery–a qualitative analysis of relevant beliefs and management preferences. Oncol Nurs Forum. 2010;37(6):740–748. doi: 10.1188/10.ONF.740-748. [DOI] [PubMed] [Google Scholar]
- 50.Lathan CS, Neville BA, Earle CC. The effect of race on invasive staging and surgery in non-small-cell lung cancer. J Clin Oncol. 2006;24(3):413–418. doi: 10.1200/JCO.2005.02.1758. [DOI] [PubMed] [Google Scholar]
- 51.White A, Vernon SW, Franzini L, Du XL. Racial and ethnic disparities in colorectal cancer screening persisted despite expansion of Medicare’s screening reimbursement. Cancer Epidemiol Biomarkers Prev. 2011;20(5):811–817. doi: 10.1158/1055-9965.EPI-09-0963. [DOI] [PMC free article] [PubMed] [Google Scholar]
- 52.Ananthakrishnan AN, Schellhase KG, Sparapani RA, Laud PW, Neuner JM. Disparities in colon cancer screening in the Medicare population. Arch Intern Med. 2007;167(3):258–264. doi: 10.1001/archinte.167.3.258. [DOI] [PubMed] [Google Scholar]
- 53.James TM, Greiner KA, Ellerbeck EF, Feng C, Ahluwalia JS. Disparities in colorectal cancer screening: a guideline-based analysis of adherence. Ethn Dis. 2006;16(1):228–233. [PubMed] [Google Scholar]
- 54.International Atomic Energy Agency. Transition from 2-D Radiotherapy to 3-D Conformal and Intensity Modulated Radiotherapy. 2008. Available at: http://www-pub.iaea.org/MTCD/publications/PDF/TE_1588_web.pdf. Accessed February 1, 2013.
- 55.Freedman RA, He Y, Winer EP, Keating NL. Trends in racial and age disparities in definitive local therapy of early-stage breast cancer. J Clin Oncol. 2009;27(5):713–719. doi: 10.1200/JCO.2008.17.9234. [DOI] [PubMed] [Google Scholar]
- 56.American Cancer Society. Cancer Disparities: A Chartbook. 2009. Available at: http://action.acscan.org/site/DocServer/cancer-disparities-chartbook.pdf. Accessed May 21, 2013.
- 57.American Cancer Society. Cancer Facts and Figures for African Americans 2013-2014. 2013. Available at: http://www.cancer.org/acs/groups/content/@epidemiologysurveilance/documents/document/acspc-036921.pdf. Accessed May 21, 2013.
- 58.Burgess DJ, van Ryn M, Grill J et al. Presence and correlates of racial disparities in adherence to colorectal cancer screening guidelines. J Gen Intern Med. 2011;26(3):251–258. doi: 10.1007/s11606-010-1575-7. [DOI] [PMC free article] [PubMed] [Google Scholar]
- 59.Hudson MA, Luo S, Chrusciel T et al. Do racial disparities exist in the use of prostate cancer screening and detection tools in veterans? Urol Oncol. 2014;32(1):34. doi: 10.1016/j.urolonc.2013.01.003. e9–34.e18. [DOI] [PMC free article] [PubMed] [Google Scholar]
- 60.Crockett D, Gonsalves W, Tashi T et al. Racial disparities in stage II prostate cancer outcomes in the Veterans Affairs hospital system. J Clin Oncol., 2010 ASCO Annual Meeting Proc. (meeting abstracts). May 2010;28:6119. [Google Scholar]
- 61.Diez-Roux AV, Kiefe CI, Jacobs DR, Jr et al. Area characteristics and individual-level socioeconomic position indicators in three population-based epidemiologic studies. Ann Epidemiol. 2001;11(6):395–405. doi: 10.1016/s1047-2797(01)00221-6. [DOI] [PubMed] [Google Scholar]
- 62.Kouri EM, Landrum MB, Lamont EB, Bozeman S, McNeil BJ, Keating NL. Location of cancer surgery for older veterans with cancer. Health Serv Res. 2012;47(2):783–793. doi: 10.1111/j.1475-6773.2011.01327.x. [DOI] [PMC free article] [PubMed] [Google Scholar]