

Abstract
Histomorphology remains a powerful routine evaluating intestinal inflammation in animal models. Emphasizing the focus of a given animal study, histopathology can overstate differences between established models. We aimed to systematize histopathological evaluation of intestinal inflammation in mouse models facilitating inter-study comparisons. Samples of all parts of the intestinal tract from well-established mouse models of intestinal inflammation were evaluated from hematoxylin/eosin-stained sections and specific observations confirmed by subsequent immunohistochemistry. Three main categories sufficiently reflected the severity of histopathology independent of the localization and the overall extent of an inflammation: (i) quality and dimension of inflammatory cell infiltrates, (ii) epithelial changes and (iii) overall mucosal architecture. Scoring schemata were defined along specified criteria for each of the three categories. The direction of the initial hit proved crucial for the comparability of histological changes. Chemical noxes, infection with intestinal parasites or other models where the barrier was disturbed from outside, the luminal side, showed high levels of similarity and distinct differences to changes in the intestinal balance resulting from inside events like altered cytokine responses or disruption of the immune cell homeostasis. With a high degree of generalisation and maximum scores from 4-8 suitable scoring schemata accounted specific histopathological hallmarks. Truly integrating demands and experiences of gastroenterologists, mouse researchers, microbiologists and pathologists we provide an easy-to-use guideline evaluating histomorphology in mouse models of intestinal inflammation. Standard criteria and definitions facilitate classification and rating of new relevant models, allow comparison in animal studies and transfer of functional findings to comparable histopathologies in human disease.
Keywords: Histopathology, mouse models, inflammation, inflammatory bowel disease, scoring
Introduction
During the past five decades animal models of intestinal inflammation substantially contributed to our understanding of the pathogenesis of human chronic intestinal inflammatory disorders. Even if none of the individual models represents all aspects and stages i.e. of ulcerative colitis mostly restricted to the colon mucosa or of Crohn’s disease affecting the whole gastrointestinal tract with transmural inflammation [1], they became indispensable to rationalise and evaluate therapeutic strategies for inflammatory bowel diseases (IBD) [2,3]. As for systematic attempts structuring the diversity, animal models are grouped by the mode of induction of the intestinal inflammation like administration of exogenous agents, genetic models and immunological strategies [4], by the mode of generating intestinal inflammation and components contributing to an IBD-like course [5,6], or by immunological mechanisms driving the inflammatory processes [3,7].
Histomorphology of the gastrointestinal tract reliably assesses the tissue architecture and the cellular composition even from small samples significantly supporting clinical diagnosis in human disease [8]. Experimental disease courses and therapeutic effects in animal models are also typically monitored by a multitude of methods at cell or molecular levels complemented by histopathology [3,7]. Acknowledging the compartmentalisation of immune responses underlines the importance of local events in the context of systemic diseases.
Despite a consent about major aspects to be evaluated that derive from experiences in human pathology, histomorphological scoring schemata used to assess the degrees of intestinal inflammation in established IBD models are as numerous as these models and as numerous as the research groups employing them. As for example of maximum scores, colitis induced by transfer of naϊve CD4+ T cells from wild-type mice into a syngeneic immunodeficient recipient rates 5 according to the group of Fiona Powrie [9] but 17 according to the group of Matthew B. Grisham [10]. These differences in numbers certainly do not reflect the level of sophistication of the analysis but rather the degree of comprehensible sub-categorization within the individual approaches. In a blinded fashion, we evaluated IBD models for many research groups dealing with T cell-mediated immune reactions in the gastrointestinal tract or with cellular approaches to suppress unwanted immune reactions and systematically adapted scoring systems. To this end, we defined categories and standard criteria to evaluate any established and new IBD model. Exemplified by standardized scoring schemata for colonic inflammation induced by erosive chemicals, by luminal antigens, by T-cell transfer or in mice with defined cytokine defects as well as for inflammation of the small intestine in genetic IBD models, upon infections with helminths or parasitic protozoans as widely used IBD models, we here provide an approved guideline facilitating decisions in the histomorphological evaluation of relevant mouse models of intestinal inflammation.
Materials and methods
Animals
C57BL/6 wild-type mice were obtained from the Bundesinstitut für Risikobewertung (Berlin, Germany). B6.129S7-Rag1tm1Mom/J (Rag1-ko) mice were obtained from The Jackson Laboratory (Maine, USA). Mice deficient for interleukin-10 on the 129/SvJ background (IL-10ko) were generously provided by R. Balfour Sartor (University of North Carolina, Chapel Hill, USA). Mice deficient for IL-2 on the B6.129P2 background (IL-2ko) were generously provided by Ivan Horak (Leibniz Institute for Molecular Pharmacology, Berlin, Germany). C57BL/6 mice with a heterozygous mutation in the adenosine-uracil-rich element of the tumor necrosis factor gene (TNFΔARE/+) were generously provided by George Kollias (Biomedical Sciences Research Center Alexander Fleming, Vari, Greece) and conventionally raised at the animal facility of the Technical University of Munich-Weihenstephan. All other mice were bred, housed and treated under specific pathogenic free conditions at the Forschungseinrichtungen für Experimentelle Medizin of the Charité-Universitätsmedizin Berlin. Protocols for animal experiments were approved by the regional animal study committee of Berlin and Munich.
Colitis models
All colitis models were performed as previously described. For acute DSS-induced colitis, wild-type mice received 3% DSS (36,000-50,000 Da; ICN, Berlin, Germany) via the drinking water ad libitum [11,12]. In order to induce 2,4,6-trinitrobenzene sulfonic acid (TNBS) colitis, wild-type mice were sensitized with 2.5% TNBS (Sigma-Aldrich, Munich, Germany) applied to the shaved abdomen and one week later, mice received 2% TNBS intrarectally [13]. As for 4-ethoxymethylene-2-phenyl-2-oxazolin-5-one (oxazolone; Sigma-Aldrich) colitis, again wild-type mice were sensitized with 3% oxazolone and intrarectally challenged with 1% oxazolone after 5 days [14]. Intraperitoneal transfer of 4×10⁵ CD4+CD45RBhigh T cells into syngeneic Rag1-ko mice induced intestinal inflammation within 4-8 weeks [15]. Colitis in IL-10ko was assessed starting at 4 months of age [16], in IL-2ko mice starting at 4 weeks of age [17] and in TNFΔARE/+ mice starting at 1-2 weeks of age [18,19]. Formalin-fixed colon tissue from a model of ovalbumin (OVA)-induced colitis 6 weeks after application of 40 mg OVA and simultaneous intravenous transfer of 6×10⁶ naïve OT-I T cells into wild-type mice were generously provided by Eckart Schott (Charité-Universitätsmedizin Berlin, Germany) [20].
Models of small intestinal inflammation
Wild-type mice were orally infected with 100 cysts of Toxoplasma gondii (T. gondii) strain ME49 as previously described [21] and ileum samples were obtained after 7 days. Wild-type mice were orally infected with Heligmosomoides polygyrus (H. polygyrus) and Nippostrongylus brasiliensis (N. brasiliensis), respectively. Formalin-fixed samples of the duodenum and jejunum were obtained 6 and 7 days after infection and generously provided by Susanne Hartmann (Freie Universität Berlin, Germany) [22].
(Immuno)Histochemistry
Intestines were thoroughly rinsed before representative samples were fixed in 10% neutral-buffered formalin (Sigma-Aldrich) for 12-24 hours and embedded in paraffin. Paraffin sections (1-2 μm) were cut and de-waxed prior to (immuno)histochemical staining. For scoring, sections were stained with hematoxylin/eosin (H&E; Merck, Darmstadt, Germany). For immunohistochemistry, sections were subjected to a heat-induced epitope retrieval step prior to incubation with polyclonal rabbit anti-mouse inducible nitric oxide synthase (iNOS) antibody (Abcam, Cambridge, UK) followed by detection employing the EnVision™ Detection System Peroxidase/DAB Rabbit (Dako, Glostrup, Denmark). For detection of endothelial cells, sections were incubated with rat anti-mouse CD31 primary antibody (clone SZ31; Dianova, Hamburg, Germany) followed by biotinylated rabbit anti-rat secondary antibody (Dianova) prior to detection using the LSAB Dako REALTM Detection System (Dako). Primary antibodies were omitted for negative controls and nuclei were counterstained with hematoxylin.
Histopathological evaluation
Tissue sections were evaluated and images taken by standard light microscopy using an AxioImager Z1 microscope (Carl Zeiss MicroImaging, Jena, Germany). Tissue samples were well-oriented with longitudinally cut crypts to precisely assess alterations in the overall intestinal tissue architecture. As for samples from the small intestine, at least 4-5 consecutive villi well-distended from base to tip were rated. If not stated otherwise, representative images within the figures show longitudinal sections.
Results
Categories and general criteria evaluating histopathology in animal models of intestinal inflammation
Based on established scoring systems for chemically induced [12,23] and transfer colitis [9,10], inflammatory cell infiltrates, epithelial changes and mucosal architecture were defined as the three main categories with respective subordinate specific criteria (Table 1).
Table 1.
Definition of categories and general criteria in histomorphological scores for intestinal inflammation in mouse models
| Category | Criterion | Definition | Score Value1 |
|---|---|---|---|
| I, Inflammatory cell infiltrate | Severity | Leukocyte density of lamina propria area infiltrated in evaluated hpf: | |
| Minimal: <10% | 1 | ||
| Mild: 10-25%; scattered neutrophils | 2 | ||
| Moderate: 26-50% | 3 | ||
| Marked: >51%; dense infiltrate | 4 | ||
| Extent | Expansion of leukocyte infiltration: | ||
| Mucosal | 1 | ||
| Mucosal and submucosal | 2 | ||
| Mucosal, submucosal and transmural | 3 | ||
| II, Epithelial changes2 | Hyperplasia | Increase in epithelial cell numbers in longitudinal crypts relative to baseline epithelial cell numbers per crypt; visible as crypt elongation: | |
| Minimal: <25% | 1 | ||
| Mild: 25-35% | 2 or 3 | ||
| Moderate: 36-50%; mitoses in middle/upper third of crypt epithelium, distant from crypt base | 3 or 4 | ||
| Marked: >51%; mitoses in upper third of crypt epithelium, distant from crypt base | 4 or 5 | ||
| Goblet cell loss | Reduction of goblet cell numbers relative to baseline goblet cell numbers per crypt: | ||
| Minimal: <20% | 1 or 2 | ||
| Mild: 21-35% | 2 or 3 | ||
| Moderate: 36-50% | 3 or 4 | ||
| Marked: >50% | 4 | ||
| Cryptitis | Neutrophils between crypt epithelial cells | 2 or 3 | |
| Crypt abscesses | Neutrophils in crypt lumen | 3 to 5 | |
| Erosion | Loss of surface epithelium | 1 to 4 | |
| III, Mucosal architecture2 | Ulceration | Epithelial defect reaching beyond muscularis mucosae | 3 to 5 |
| Granulation tissue | Connective tissue repair with new capillaries, surrounded by spindle-shaped fibroblasts, myofibroblasts, macrophages, neutrophils and mononuclear cells as well as cell debris; pseudopolyps: villiformous, hypertrophied areas projecting into the lumen | 4 or 5 | |
| Irregular crypts | Non-parallel crypts, variable crypt diameters, bifurcation and branched crypts | 4 or 5 | |
| Crypt loss | Mucosa devoid of crypts | 4 or 5 | |
| Villous blunting | Mild: villous-to-crypt-length ratio of 2:1 to 3:1 | 1 to 3 | |
| Moderate: villous-to-crypt-length ratio of 1:1 to 2:1 | 2 to 4 | ||
| Villous atrophy | 3 to 5 |
Values given for single criteria are not additive but represent the final score value that include all relevant criteria;
From well-oriented samples/biopsies with longitudinally cut crypts only, at least 5 comparable crypts.
Leukocytes infiltrating the lamina propria sometimes extending to subjacent layers were the common feature in all models and in all parts of the inflamed intestine. Although infiltrates comprised neutrophils, eosinophils, monocytes, plasma cells and lymphocytes at differing ratios, evaluating the relative cellularity of mixed leukocytes within tissues per high-power field (hpf; 0.237 mm2), here summarized as inflammatory cells, sufficiently reflected inflammation-related alterations (Table 1, Figure 1A). Distinguishing from the healthy lamina propria containing only few immune cells, four grades estimated percentages of leucocytes per representative hpf. Scattered neutrophils were a typical feature in mild infiltrates (Figure 1B). Besides numbering inflammatory cells, the extent of the infiltrate completed this category. Starting from mainly focal mucosal localization of inflammatory cells (Figure 1C), increased severity first included the submucosa (Figure 1D), subsequently extended to the muscularis propria and eventually led to transmural infiltrates (Figure 1E). Major changes that originally apply to epithelial cell layers included crypt epithelial cell hyperplasia, the loss of goblet cells, cryptitis and crypt abscesses and erosions (Table 1). Proliferation of epithelial cells as a sign of increased regeneration was a general feature of intestinal inflammation in the small intestine as well as in the colon. Four stages of increase in crypt length in relation to normal intestinal tissue appearance adequately graded the severity of intestinal inflammation (Figure 2). Minimal and mild hyperplasia essentially presented itself as increased cell numbers in the epithelial lining. Moderate and marked hyperplasia also revealed mitoses in regions distant from the crypt base that were easily acknowledged as mitotic nuclei from H&E staining. Goblet cell loss from the epithelial cell layers of the small and large intestine clearly marked the severity of intestinal inflammation and was rated in relation to baseline goblet cell numbers in the given region of the intestine (Figure 2).
Figure 1.
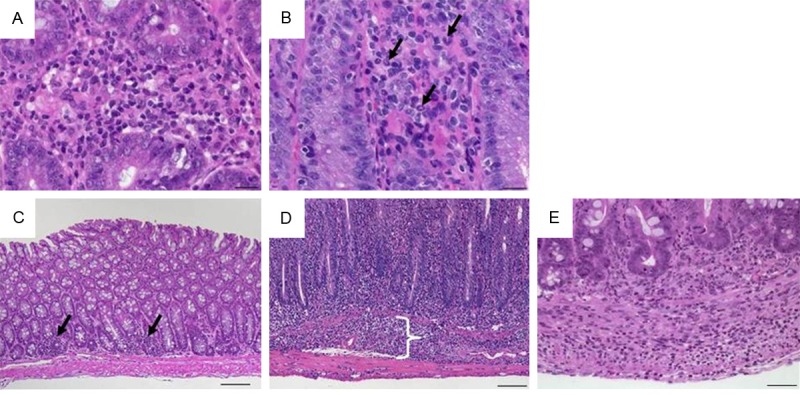
Representative images of H&E-stained colon sections illustrate specifics of inflammatory cell infiltrates. (A) Infiltrating mixed leukocytes in a cross section (×400, scale bar 20 μm). (B) Scattered neutrophils (arrows; ×400, scale bar 20 μm). (C) Multifocal mucosal infiltration of mixed inflammatory cells (arrows; ×100, scale bar 100 μm). (D) Mucosal and submucosal (bracket) infiltrate of inflammatory cells (×100, scale bar 100 μm) and (E) transmural inflammatory cells (×200; scale bar 50 μm).
Figure 2.
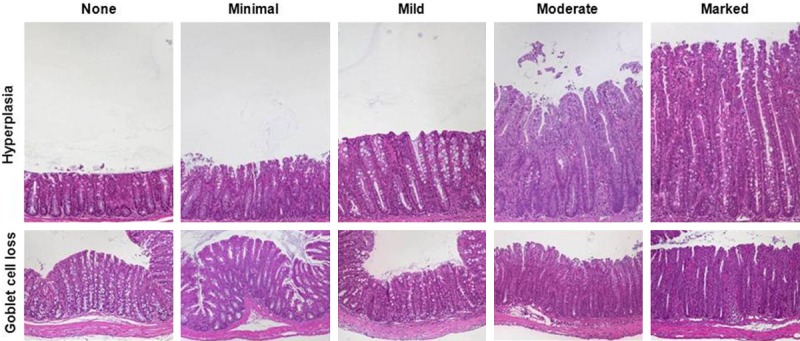
Representative images of H&E-stained colon sections illustrate the grades of epithelial hyperplasia and of goblet cell loss. Hyperplasia appears as elongated crypts due to increase in epithelial cells (upper row; ×100) and loss of goblet cells that display clear mucus droplets (lower row; ×100).
Neutrophils interspersing in the epithelial cell layer of the crypt in terms of a cryptitis (Figure 3A) intensified to crypt abscesses where neutrophils accumulate in the crypt lumen eventually disrupting the crypt epithelium (Figure 3B). Erosions, i.e. the loss of surface epithelium with underlying inflammation where the epithelial defect reached the basement membrane presented itself mostly focal (Figure 3C). Scoring this feature especially depended upon the model used as indicated by the wide range of final score values (Table 1). With a “first hit” from the outside erosion was even abundant at a value of 1 (Table 2); erosion resulting from severe mucosal inflammation due to an inside event accompanied values of 4 (Table 4).
Figure 3.
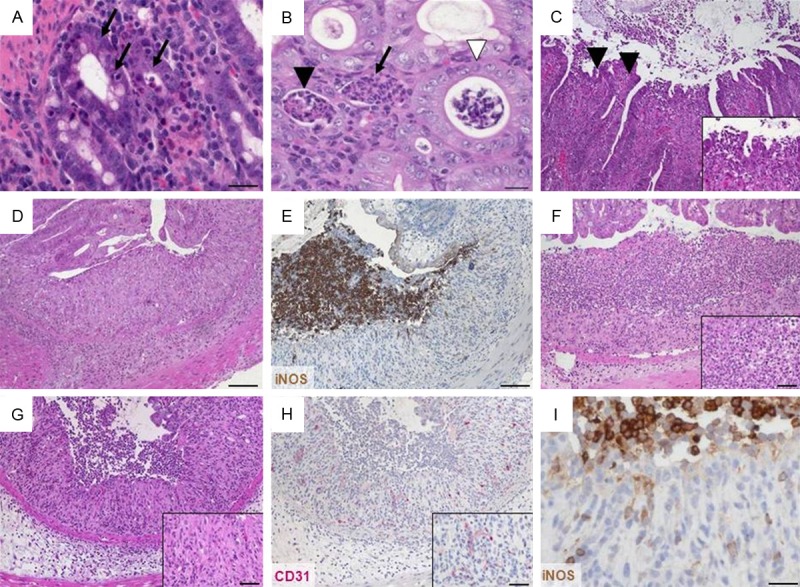
Representative H&E- and immunohistochemically stained colon sections illustrate epithelial changes and altered mucosa architecture. (A) Cryptitis appears as neutrophils (arrows) between crypt epithelial cells in a cross section (×400, scale bar 20 μm). (B) Crypt abscesses with neutrophils in the lumen and nearly intact epithelium (white arrowhead) or damaged epithelium (black arrowhead) and complete crypt loss (arrow) in cross section (×400, scale bar 20 μm). (C) Loss of surface epithelium marking erosion (arrowheads; ×100, insert ×400). (D) Ulceration (×100, scale bar 100 μm). (E) Ulceration covered by an exudate rich in iNOS+ neutrophils (brown; ×100, scale bar 100 μm) and (F) granulocyte-fibrin eschar (×100, insert ×400, scale bar 20 μm). Consecutive sections of (G) granulation tissue (×100, insert ×400, scale bar 20 μm) comprising (H) CD31+ endothelial cells (red; ×100, insert ×400, scale bar 20 μm) and (I) apical iNOS+ cells (brown; ×400, scale bar 20 μm).
Table 2.
Classification of IBD mouse models evaluated within this study
| Organ | “First hit” | Induction | Example | Sampling1 | Scheme |
|---|---|---|---|---|---|
| Colon | Outside | Induced by erosive chemicals | Oral DSS; single cycle | Distal colon, day 2-42 | 1 (Table 3, Figure 6) |
| Oral DSS; repeated cycles | Distal colon, day 142 | ||||
| Rectal TNBS; single dose | Distal colon, day 2-4 | ||||
| Rectal oxazolone; single dose | Distal colon, day 2-4 | ||||
| Mediated by luminal antigen | Rectal ovalbumin, transfer of OVA-specific CD8+ T cells | Colon3, week 6-8 | 2 (Table 4, Figure 7) | ||
| Inside | Mediated by disturbed immune cell homeostasis | Transfer of naïve CD4+ T cells into syngeneic immunodeficient mice | Colon3, week 4-8 | 3 (Table 5, Figure 8) | |
| Mediated by genetically altered cytokine balance | Homozygous IL-10ko | Ascending and transverse colon, week 34 | 4 (Table 6, Figure 9) | ||
| Homozygous IL-2ko | Colon3, week 6-15 | ||||
| Small intestine | Inside | Mediated by genetically altered cytokine balance | TNFΔARE/+ | Terminal ileum, week 4-8 | 5 (Table 7, Figure 10) |
| Outside | Mediated by luminal antigen | Oral infection with H. polygyrus | Duodenum, day 6 | 6 (Table 8, Figure 11) | |
| Oral infection with N. brasiliensis | Jejunum, day 7 | ||||
| Oral infection with T. gondii | Ileum, day 7-8 | (Table 9, Figure 12) |
Most affected organ and time point of most severe inflammation; can vary according to the experimental setup;
After DSS removal;
Severity increases from proximal to distal colon;
Development of chronic colitis and adenocarcinoma ≥3 months of age.
Table 4.
Scoring scheme 2 for colonic inflammation mediated by luminal antigens
| Inflammatory cell infiltrate | Epithelial changes | Mucosal architecture | Score | |
|---|---|---|---|---|
|
| ||||
| Severity | Extent | |||
| Minimal | Mucosa | Minimal hyperplasia | 1 | |
| Mild | Mucosa and submucosa | Mild hyperplasia, minimal goblet cell loss | 2 | |
| Moderate | Mucosa and submucosa, sometimes transmural | Moderate hyperplasia, mild goblet cell loss | 3 | |
| Marked | Mucosa and submucosa, often transmural | Marked hyperplasia with moderate to marked goblet cell loss | Ulcerations, crypt loss | 4 |
All changes reaching deeper than the surface epithelial cell layer were considered alterations in the overall mucosal architecture and graded from the presence of ulcerations, granulation tissue, irregular crypts or of crypt loss. Specifics like the ratio of villous length to crypt depth accounted for general anatomical differences along the whole small intestine (Table 1). Ulcerations i.e. erosions exceeding to the submucosa (Figure 3D) were occasionally covered by an exudate rich in iNOS+ neutrophils (Figure 3E) or by granulocyte-fibrin eschar (Figure 3F). Connective tissue repair was the hallmark of granulation tissue underlying ulcerations (Figure 3G). It comprised new capillaries lined by CD31+ endothelial cells (Figure 3H), myofibroblasts, iNOS+ macrophages and neutrophils (Figure 3I) as well as lymphocytes and cell debris. Generally, crypt appearance throughout the intestine and the villous morphology within the small intestine defined a major level of mucosal architecture. Irregular crypts with variable diameters along the depth of single crypts or dilated crypts (Figure 4A), crypts that did not run parallel (Figure 4B), bifurcation at the base of the crypt (Figure 4C, 4D) that might extend to branched crypts (Figure 4E), to a mucosa completely devoid of crypts (Figure 4F, 4G) or crypts herniated to the submucosa (Figure 4H) marked mucosal histopathology. In the duodenum and jejunum, the villi are long with a villous-to-crypt length ratio on the order of 3:1 to 5:1, while in the ileum the villi are typically shorter (Figure 5). Thus, progressive broadening and blunting of the villi up to complete loss of villous structures clearly indicated pathological changes. We found two degrees of villous blunting (Figure 5) and villous atrophy sufficient to grade the severity.
Figure 4.
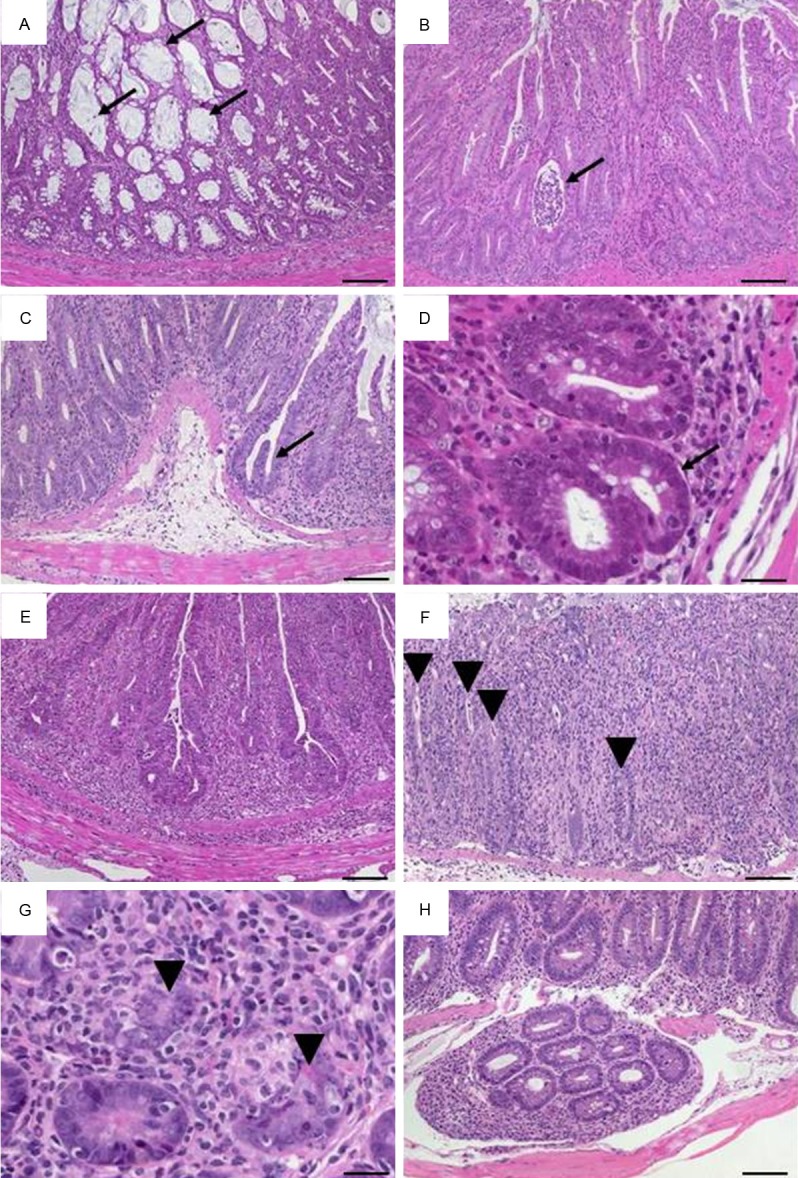
Representative H&E-stained colon sections illustrate altered crypts. (A) Variable diameters in adjacent crypts in a cross section with dilated crypts containing mucus (arrows; ×100, scale bar 100 μm). (B) Slight crypt distortion with crypt abscess (arrow; ×100, scale bar 100 μm). Bifurcated crypts (arrow) in (C) longitudinal section (×100, scale bar 100 μm) and (D) cross section (×400, scale bar 20 μm). (E) Branched crypts (×100, scale bar 100 μm). Mucosa containing only remains of crypts (arrowheads) in (F) longitudinal section (×100, scale bar 100 μm) and (G) cross section (×400, scale bar 20 μm). (H) Herniated crypts (×100, scale bar 100 μm).
Figure 5.
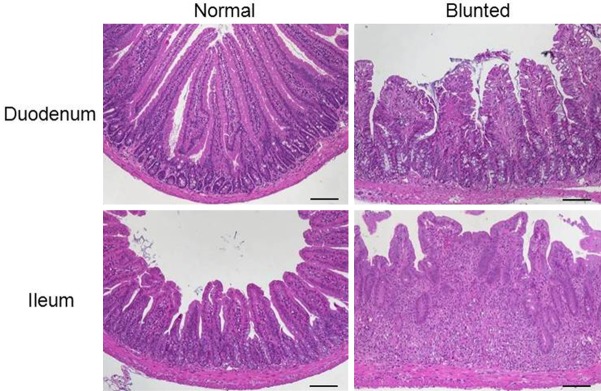
Representative H&E-stained sections of the small intestine illustrate villous blunting with normal and altered villi from the duodenum and ileum (×100, scale bar 100 μm).
As for epithelial changes and the mucosal architecture, each model system had different key aspects regarding degree, quality, extent and depth that made overall generalization in terms of a single generalized scoring system using all criteria for each model not feasible. Our schemata propose maximum severity rated 4-5 from combined changes in all three categories. Characteristic discontinuities in inflammatory cell infiltrates and intestinal architecture were best reflected by additive scores with a maximum of 6 or 8, relating to the well-established evaluation of DSS-induced colitis [11].
We methodically inspected widely used relevant murine IBD models according to the defined categories and criteria and suggested scoring schemata. Evaluating histomorphology from H&E stained sections grouped our models according to the initial step weakening the barrier rather than the exact nature of immune interactions in the whole processes of acute or chronic intestinal inflammation. “First hits” from the outside, the luminal side, induced histopathological specifics that were comparable among each other but distinguishable from those models resulting from inside events, i.e. from imbalanced immune dispositions (Table 2, Supplementary Figure 1).
Additionally, in line with representative tissue samples excised from the most affected organ, the most affected section should be scored. This goes especially for discontinuous inflammations. If the extent of the inflammation shall be taken into account, a score index can be calculated as the product of the score and the relative tissue area affected.
Scheme 1: chemically induced colonic inflammation
All models of chemically induced colonic inflammation start from a disrupted epithelial barrier enabling an immunoreactive agent to interact with immune cells within the lamina propria [24]. Acute colitis was induced by rectal application of TNBS or oxazolone to sensitized mice and oral administration of DSS, respectively. Repeated cycles of low-dose DSS gave rise to chronic intestinal inflammation. The main finding in all models was the discontinuity of mucosal changes as extensive infiltrates were observed without epithelial defects and vice versa that was reflected in an additive score separately evaluating inflammatory cell infiltrates and intestinal architecture with maximum values of 3 each (Table 3). Severe colitis presented barely preserved mucosal architecture showing extended ulcerations, marked, often transmural inflammatory cell infiltrates and destroyed crypts. Colon sections of DSS-induced colitis illustrate this scoring system in Figure 6.
Table 3.
Scoring scheme 1 for chemically-induced colonic inflammation
| Inflammatory cell infiltrate: | Score 1 | Intestinal architecture: | Score 2 | ||
|---|---|---|---|---|---|
|
|
|
||||
| Severity | Extent | Epithelial changes | Mucosal architecture | ||
| Mild | Mucosa | 1 | Focal erosions | 1 | |
| Moderate | Mucosa and submucosa | 2 | Erosions | ± Focal ulcerations | 2 |
| Marked | Transmural | 3 | Extended ulcerations ± granulation tissue ± pseudopolyps | 3 | |
| Sum of scores 1 and 2: | 0-6 | ||||
Figure 6.
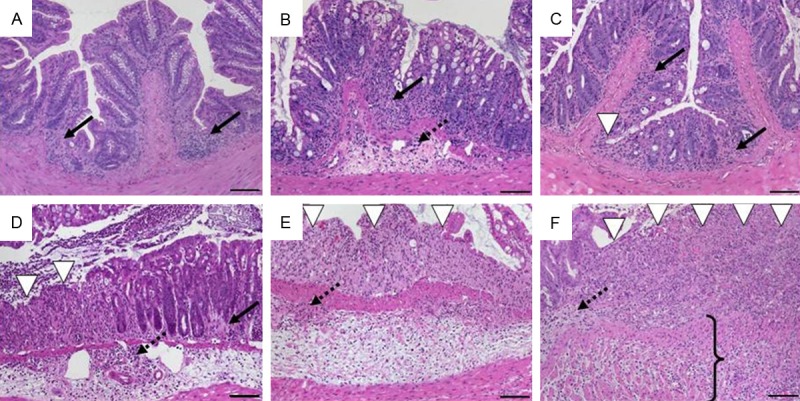
Histomorphology of colon tissue in DSS-induced colitis in C57BL/6 wild-type mice at day 2 after DSS removal representing scores according to scheme 1 referring to Table 3. A. Sum score 1: mild mucosal inflammatory cell infiltrates (score 1: 1) with intact epithelium (score 2: 0); B. Sum score 2: inflammatory cell infiltrates into mucosa and submucosa (score 1: 2) with undamaged epithelium (score 2: 0); C. Sum score 3: mucosal infiltrates (score 1: 1) with focal ulceration (score 2: 2); D. Sum score 4: inflammatory cell infiltrates in mucosa and submucosa (score 1: 2) and focal ulceration (score 2: 2); E. Sum score 5: moderate inflammatory cell infiltration into mucosa and submucosa (score 1: 2) with extensive ulcerations (score 2: 3); F. Sum score 6: transmural inflammation (score 1: 3) and extensive ulceration (score 2: 3). Original magnification ×100; scale bars 100 μm; arrows-inflammatory cell infiltrates within mucosa (solid) and submucosa (dotted); white arrowhead-ulceration; bracket–transmural inflammation.
Scheme 2: colonic inflammation mediated by luminal antigens
Luminal antigens include antigens from food components or from the intestinal microbiota. The scheme for antigen-specific models acknowledged the severity of intestinal inflammation with a maximum rated 4 (Table 4). While early stages were mainly characterised by gradually increasing inflammatory cell infiltrates, late stages typically showed ulcerations. This group is exemplified by a model where rectally applied OVA induced colitis in fully immune-competent wild-type mice that simultaneously received OVA-specific CD8+ T cells for readout issues (Figure 7).
Figure 7.
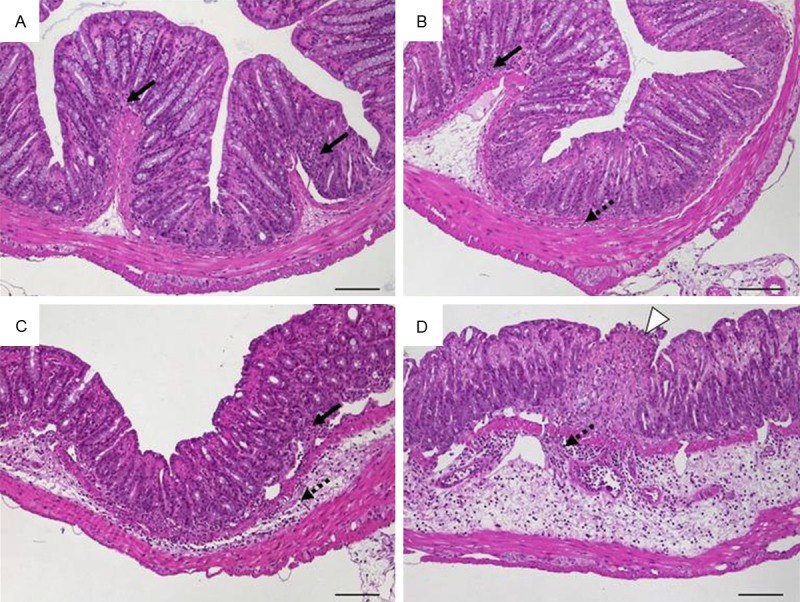
Histomorphology of colon tissue 6 weeks after intrarectal application of ovalbumin and simultaneous intravenous transfer of ovalbumin-specific T cells into wild-type mice representing scores according to scheme 2 referring to Table 4. A. Score 1: intact epithelium with minimal focal inflammatory cell infiltrates in the mucosa; B. Score 2: scattered inflammatory cell infiltrates in mucosa and submucosa; C. Score 3: diffuse mucosal and submucosal inflammatory cell infiltrates; D. Score 4: moderate inflammatory cell infiltrates in the submucosa which is edematous, focal ulceration. Original magnification ×100; scale bars 100 μm; arrows-inflammatory cell infiltrates within mucosa (solid) and submucosa (dotted); white arrowhead-ulceration.
Scheme 3: colonic inflammation mediated by a disturbed immune cell homeostasis
Adoptive transfer of naïve CD4+ T cells into syngeneic immunodeficient recipients results in continuous inflammation of the colon and the small intestine as well as in associated hepatitis [25] and pancreatitis (data not shown). It did not matter whether transferred T-cell populations were defined as CD4+CD45RBhi, CD4+CD62L+ or CD4+CD25- T cells, given that increasing severity of colonic inflammation was found as concurrent increase in inflammatory cell infiltrates and epithelial changes with striking hyperplasia (see also Figure 2). In late stages, these were accompanied by ulcerations that were not as severe as in the model of antigen-mediated colitis above and by altered or lost crypts. A non-additive scoring system with a maximum of 5 reproducibly reflected all models of transfer colitis (Table 5) and is exemplified by transfer of CD4+CD45RBhi T cells into Rag1-ko mice (Figure 8). For the evaluation of the accompanying small bowel inflammation in the transfer colitis model, we used the scheme 6 (Table 8).
Table 5.
Scoring scheme 3 for colonic inflammation mediated by disturbed immune cell homeostasis
| Inflammatory cell infiltrate | Epithelial changes | Mucosal architecture | Score | |
|---|---|---|---|---|
|
| ||||
| Severity | Extent | |||
| Minimal | Mucosa | Minimal hyperplasia | 1 | |
| Mild | Mucosa, sometimes extending into submucosa | Mild hyperplasia, minimal goblet cell loss ± erosions | 2 | |
| Moderate | Mucosa and submucosa | Moderate hyperplasia ± few crypt abscesses, moderate goblet cell loss ± erosions | 3 | |
| Marked | Mucosa and submucosa | Marked hyperplasia ± several crypt abscesses and/or erosions | ± Irregular crypts or crypt loss ± ulcerations | 4 |
| Marked | Transmural | Marked hyperplasia ± multiple crypt abscesses | ± Irregular crypts or crypt loss ± ulcerations | 5 |
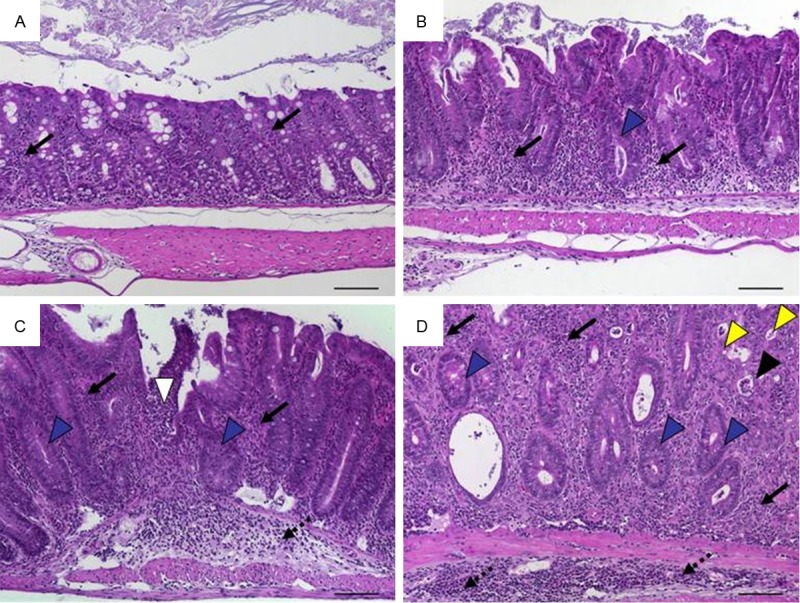
Figure 8.
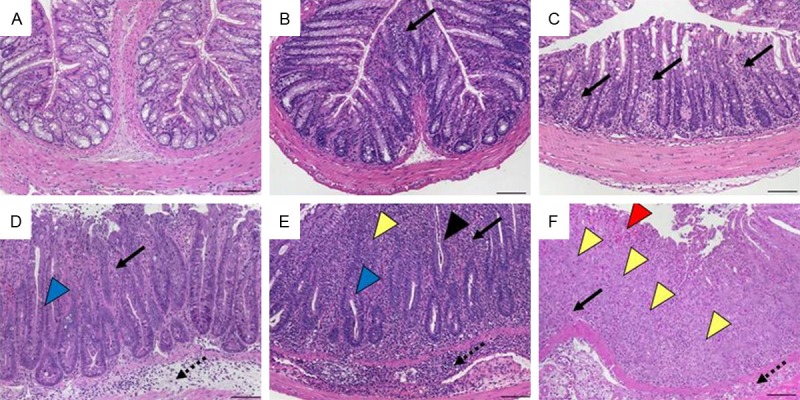
Histomorphology of colon tissue after transfer of CD4+CD45RBhi T cells into Rag1-ko mice representing scores according to scheme 3 referring to Table 5. A. Score 0: normal colon mucosa with intact epithelium; B. Score 1: scattered inflammatory cell infiltrates in the mucosa; C. Score 2: diffuse mucosal infiltrates without submucosal spreading and intact epithelial layer; D. Score 3: moderate infiltration of inflammatory cells into mucosa and submucosa with epithelial hyperplasia and goblet cell loss; E. Score 4: marked inflammatory cell infiltrates in mucosa and submucosa accompanied by crypt abscesses and loss of goblet cells and crypts; F. Score 5: marked inflammatory cell infiltrates within the mucosa spreading to the submucosa going along with crypt loss and hemorrhage. Original magnification ×100; scale bars 100 μm; arrows-inflammatory cell infiltrates within mucosa (solid) and submucosa (dotted); black arrowhead-crypt abscess, blue arrowhead-goblet cell loss; yellow arrowhead-crypt loss; red arrowhead-hemorrhage.
Table 8.
Scoring scheme 6 for inflammation of the small intestine mediated by luminal antigens
| Inflammatory cell infiltrate: | Score 1 | Intestinal architecture: | Score 2 | ||
|---|---|---|---|---|---|
|
|
|
||||
| Severity | Extent | Epithelial changes | Mucosal architecture | ||
| Mild | Mucosa and sometimes submucosal | 1 | Mild villous blunting | 1 | |
| Moderate | Mucosa and sometimes submucosal | 2 | Mild hyperplasia | Moderate villous blunting | 2 |
| Marked | Mucosa and submucosa, sometimes transmural | 3 | Moderate hyperplasia and goblet cell loss | Moderate villous blunting and broadening, sometimes villous atrophy | 3 |
| Marked | Transmural | 4 | Marked hyperplasia and goblet cell loss | Villous atrophy, ulcerations | 4 |
| Sum of scores 1 and 2: | 0-8 | ||||
Scheme 4: colonic inflammation in genetically altered mice with defined cytokine defects
Models with recombinant transgenic expression or the deficiency to produce a defined cytokine are often referred to as genetic IBD models [1,6,7]. Due to the systemic cause, intestinal inflammation often affects the colon as well as the small intestine [3]. Colonic inflammation was very similar to transfer colitis. Hallmarks were massive leukocyte infiltration of the lamina propria, hyperplasia of the crypt epithelium and crypt abscesses. These findings were integrated to a non-additive scoring scheme that due to the overall lower severity compared to the transfer colitis rated a maximum of 4 (Table 6). It is illustrated by IL-10ko mice that developed a chronic enterocolitis at the age of 3 weeks (Figure 9) and was also applicable for the colitis within homozygous IL 2ko mice (not shown).
Table 6.
Scoring scheme 4 for colonic inflammation in consequence of cytokine imbalance
| Inflammatory cell infiltrate | Epithelial changes | Mucosal architecture | Score | |
|---|---|---|---|---|
|
| ||||
| Severity | Extent | |||
| Minimal | Mucosa | Minimal hyperplasia | 1 | |
| Mild | Mucosa, sometimes submucosa | Mild hyperplasia, mild goblet cell loss ± cryptitis ± erosions | 2 | |
| Moderate | Mucosa and submucosa | Moderate hyperplasia, moderate goblet cell loss, cryptitis ± crypt abscesses | Ulcerations | 3 |
| Marked | Mucosa and submucosa, often transmural | Marked hyperplasia, marked goblet cell loss, multiple crypt abscesses | Extended ulcerations ± pseudopolyps | 4 |
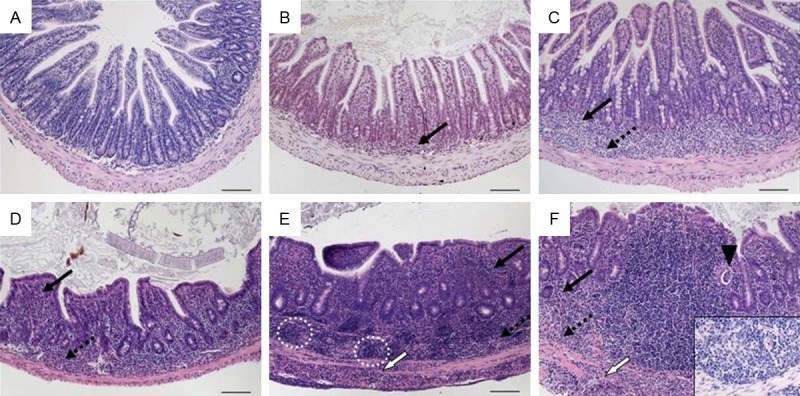
Figure 9.
Histomorphology of colon tissue in IL-10 ko mice at 4 months of age representing scores according to scheme 4 referring to Table 6. A. Score 1: minimal inflammatory cell infiltrates in the mucosa with intact epithelium; B. Score 2: mild inflammatory cell infiltrates in the mucosa with mild hyperplasia and mild goblet cell loss; C. Score 3: moderate inflammatory cell infiltrates in mucosa and submucosa with moderate goblet cell loss; D. Score 4: marked inflammatory cell infiltration into mucosa and submucosa with marked hyperplasia and marked goblet cell loss, multiple crypt abscesses and crypt loss. Original magnification ×100; scale bars 100 μm; arrows-inflammatory cell infiltrates within mucosa (solid) and submucosa (dotted); black arrowhead-crypt abscess; yellow arrowhead-crypt loss; blue arrowhead-goblet cell loss.
Scheme 5: inflammation of the small intestine in genetically altered mice with defined cytokine defects
IBD models with involvement of the small bowel are rare and characteristics of small intestinal inflammation did not differ significantly from inflammation of the colon. Our scoring system considered specifics in architecture and also graded the alterations of the villous structure caused by (sub)mucosal inflammatory cell infiltrates and epithelial hyperplasia (Table 7). Despite the different locus and main features, the late inflammation was as severe as seen in transfer colitis and we also rated the maximum as 5. Tissues from the terminal ileum of TNFΔARE/+ mice displayed typical features of small intestinal inflammation (Figure 10).
Table 7.
Scoring scheme 5 for small intestinal inflammation in consequence of cytokine imbalance
| Inflammatory cell infiltrate | Epithelial changes | Mucosal architecture | Score | |
|---|---|---|---|---|
|
| ||||
| Severity | Extent | |||
| MiId | Mucosa | 1 | ||
| Mild | Mucosa and submucosa | 2 | ||
| Moderate | Mucosa and submucosa | Mild hyperplasia | Mild villous blunting | 3 |
| Marked with submucosal lymphoid aggregates and granuloma | Mucosa and submucosa, sometimes transmural | Moderate hyperplasia | Moderate villous blunting | 4 |
| Marked with submucosal granuloma | Mucosa, submucosa and transmural | Marked hyperplasia | Villous atrophy, branched crypts | 5 |
Figure 10.
Histomorphology of tissue from the terminal ileum in TNFΔARE mice starting at 2 weeks of age representing scores according to scheme 5 referring to Table 7. A. Score 0: normal ileum with intact epithelium and short, finger-like villi; B. Score 1: mild mucosal inflammatory cell infiltrate; C. Score 2: mild diffuse inflammatory cell infiltrate in mucosa and submucosa; D. Score 3: moderate inflammatory cell infiltrates in mucosa and submucosa with villous blunting; E. Score 4: marked mucosal, submucosal and transmural inflammatory cell infiltration with lymphoid aggregates predominantely in the submucosa accompanied by villous broadening; F. Score 5: marked transmural inflammatory cell infiltration and villous atrophy (insert: submucosal granuloma; ×400). Original magnification ×100; scale bars 100 μm; arrows-inflammatory cell infiltrates within mucosa (solid), submucosa (dotted), and transmural (white); black arrowhead-crypt abscess; circle-lymphoid aggregates.
Scheme 6: inflammation of the small intestine induced by luminal antigens
Luminal endoparasites like helminths directly trigger a host immune response by attachment, migration and feeding activities or indirectly from opportunistic infections [26]. The complex sequence of events finally encompassed a weakened intestinal epithelial barrier. Like for chemically-induced colitis, we found an additive scoring system suitable that independently described the level of leukocyte infiltration and the intestinal architecture and acknowledged the severity with maximum combined rates of 8 (Table 8). The use of this scheme is exemplified by duodenal tissue from the model of oral infection with Heligmosomoides polygyrus (Figure 11) but it also worked for the jejunum upon infection with Nippostrongylus brasiliensis (not shown). The obligate intracellular parasite Toxoplasma gondii causes an acute small bowel inflammation due to T helper (Th)-1 cell-mediated mechanisms [21]. Rapid development of an intestinal pathology with very early severe mucosal necroses and tissue destruction necessitated a separate scoring system that we adapted to our general outline with a maximum of 4 (Table 9, Figure 12).
Figure 11.
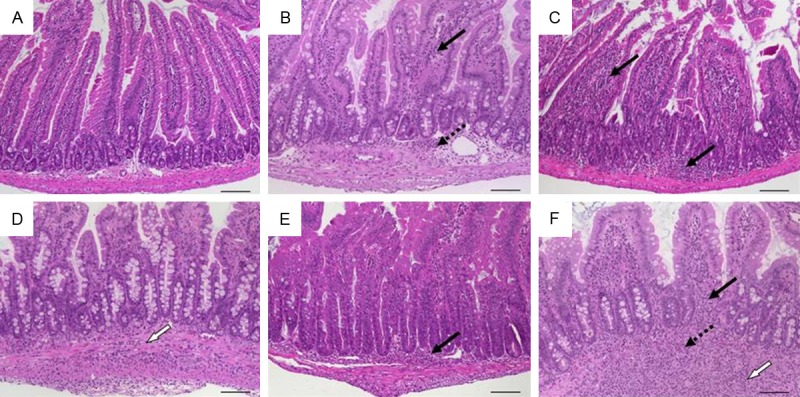
Histomorphology of duodenal tissue in mice infected with Heligmosomoides polygyrus representing scores according to scheme 6 referring to Table 8. A. Sum score 0: normal duodenum; B. Sum score 2: mild mucosal and submucosal inflammation (score 1: 1) with normal crypts and villi (score 2: 0); C. Sum score 4: moderate infiltration of mucosa (score 1: 2) with mild villous blunting and mild hyperplasia (score 2: 2); D. Sum score 5: transmural inflammation (score 1: 3) with moderate villous blunting and mild hyperplasia (score 2: 2); E. Sum score 6: mucosal inflammatory cell infiltration (score 1: 2) with moderate villous blunting and marked hyperplasia (score 2: 4); F. Sum score 7: marked transmural inflammation (score 1: 4) with moderate blunting and moderate hyperplasia (score 1: 3). Original magnification ×100; scale bars 100 μm; arrows-inflammatory cell infiltrates within mucosa (solid), submucosa (dotted), and transmural (white).
Table 9.
Score for small intestinal inflammation upon infection with Toxoplasma gondii
| Inflammatory cell infiltrate | Epithelial changes | Mucosal architecture | Score | |
|---|---|---|---|---|
|
| ||||
| Severity | Extent | |||
| Minimal, focal | Mucosa | Intact epithelium | 1 | |
| Mild, focal to diffuse | Mucosa and submucosa | Sometimes associated with erosions | 2 | |
| Moderate, diffuse | Mucosa and submucosa | Erosions and/or ulcerations; cryptitis and/or crypt abscesses | Distortion of villous structure | 3 |
| Severe, diffuse | Mucosa and submucosa, sometimes transmural | Ulcerations associated with necroses and fibroses | Distortion of villous structure | 4 |
Figure 12.
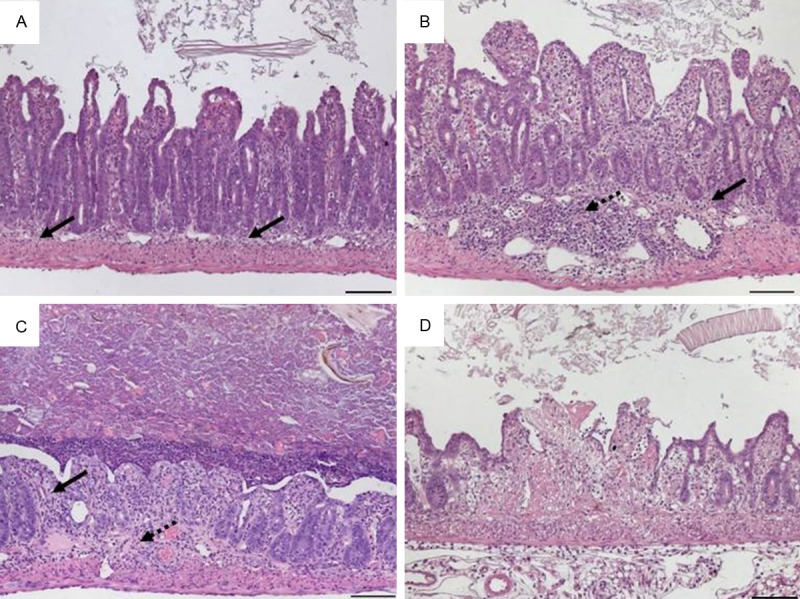
Histomorphology of ileal tissue in mice infected with Toxoplasma gondii at day 7 representing scores referring to Table 9. A. Score 1: minimal and focal inflammatory cell infiltrates in the mucosa with an intact epithelial layer; B. Score 2: mild, diffuse inflammatory cell infiltrates in mucosa and submucosa with flattened epithelium and villous blunting; C. Score 3: moderate, diffuse inflammatory cell infiltrates in mucosa and submucosa with erosions and distorted villlous structure; D. Score 4: necrotic and fibrotic mucosa with distorted villi. Original magnification x100; scale bars 100 μm; arrows-inflammatory cell infiltrates within mucosa (solid) and submucosa (dotted).
Discussion
Comparing intestinal histomorphology as assessed from H&E stained tissue sections from different mouse models or from the same model in the hands of different researchers requires consistent criteria. Evaluating inflammatory cell infiltrates, epithelial changes and the mucosal architecture as main categories along our definitions grouped the animal models according to the initial step weakening the epithelial barrier (‘first hit’). “First hits” from the outside, the luminal side, induced histopathological specifics that were comparable among each other but distinguishable from those models resulting from imbalanced immune dispositions (inside events).
Infiltrating leukocytes i.e. granulocytes, monocytes and lymphocytes were common in all models and parts of the inflamed intestine. So all models fitted the definitions evaluating inflammatory cell infiltrates in category I.
Epithelial cell proliferation was also a general feature of intestinal inflammation in all models and is a criterion in category II comprising epithelial changes. Except for the crypt base dominated by intestinal stem cells and in the small intestine by Paneth cells, crypts are lined by a single layer of epithelial cells with interspersed goblet cells and occasional enteroendocrine cells [27]. Overall increase of epithelial cell numbers visible as crypt elongation in longitudinal crypts is also referred to as crypt hyperplasia [28], mucosal hyperplasia [29], thickening of colon wall [30], crypt elongation [31,32], or epithelial hyperplasia [9,33]. Epithelial hyperplasia is typical for transfer colitis, the best characterized model of colitis induced by disruption of the T-cell homeostasis [34]. A scoring system was initially developed for Rag2-ko mice or C.B-17 SCID mice that were injected intraperitoneally with CD4+CD45RBhigh T cells from syngeneic wild-type mice [9]. In the meantime the definition for naϊve CD4+ T cells to be transferred and the recipient host were broadened [35]. Transfer colitis in SCID mice is usually more severe than in Rag1-ko mice and the presence of B cells normally attenuates the disease [10,36]. Four stages of epithelial hyperplasia adequately graded the severity of intestinal inflammation. Additionally, detection of proliferating Ki67+ epithelial cells by immunohistochemistry may be used for confirmation of hyperproliferation giving rise to crypt hyperplasia [37]. Hyperplasia should be assessed by quantifying the epithelial cells lining the crypts. A minimum of 10 crypts should be evaluated. Technically challenging, the crypt length could be given in micrometers from exactly oriented longitudinal sections as well as the percentage of Ki67+ proliferating epithelial cells could be determined. Another criterion in category II is the loss of goblet cells. Especially in UC, goblet cells are reduced in number and size and it is still unknown whether the alterations in mucin production contribute to the initiation or result from the inflammation [38]. Referring to the product secreted by the goblet cells this is also described as mucin depletion [22] or mucin depletion from goblet cells [9]. Normally, the proportion of goblet cells among epithelial cells increases along the parts of the intestine from 4% within the duodenum to 16% within the distal colon [39]. Histochemical staining of proteoglycans with Alcian blue and/or periodic acid-Schiff stain underlines the presence mucins [40]. Here again, goblet cell loss should be assessed by counting of goblet cells per crypt or per villus. Here again, a minimum of 10 crypts and villi, respectively, should be analysed. Further criteria for epithelial changes are neutrophils interspersing among epithelial cells (cryptitis) aggravating to crypt abscesses [41] and erosions. We define erosions as the loss of surface epithelium with underlying inflammation where the epithelial defect crossed the basement membrane and presented itself mostly focal [42].
Although the maximum contributions of changes in the epithelium and the mucosal architecture for the intestinal inflammation were included in our definitions, each model had slightly different key aspects with respect to these categories. All changes reaching deeper than the epithelial cell layer were considered alterations in the overall mucosal architecture and summarized in category III. Ulcerations are erosions exceeding to the submucosa with underlying regenerating tissue [41]. Extended inflammatory processes, especially in acute models comprised large areas of so-called granulation tissue. The hallmark was connective tissue repair comprising new capillaries surrounded by (myo) fibroblasts, macrophages, neutrophils, lymphocytes and cell debris [43,44]. Hypertrophic granulation tissue resulted in pseudopolyps in the colon i.e. villiform structures projecting into the lumen [45] and are reported among others in DSS-induced colitis [46]. Generally, crypt appearance throughout the intestine and villous morphology within the small intestine defined the main level of mucosal architecture. In severe or long-standing inflammation, crypt architecture becomes distorted with irregularly shaped crypts and even crypt loss. In the small intestine, the mucosal architecture is also defined by the appearance of the villi. Hence, the villous architecture was taken into account in the category III. Although the villous structure changes along the small intestine, two degrees of villous blunting and villous atrophy sufficiently graded the severity of histomorphological changes. Widely used mouse models for intestinal helminth infection are Heligmosomoides polygyrus and Nippostrongylus brasiliensis [47,48]. Despite strong Th-2 cell responses in various tissues, the pathology is most prominent in the small intestine [49]. Other IBD models involving the small intestine are rare like SAMP/Yit, TNFΔARE/+ and Roquinko mice [19,50,51]. Histopathology of small intestinal inflammation as described by the categories I and II appeared similar to colonic inflammation within the respective models. While changes in the mucosal architecture occurred in moderate to marked inflammation of the colon, villous architecture already changed in mild inflammation. One exception in our schemes is the acute small bowel inflammation after infection with Toxoplasma gondii. The rapid development of pathology with very early severe mucosal necroses and tissue destruction required a specific score that is not applicable to other models of small intestinal inflammation.
Integrating the special experiences of surgical pathologists, mouse researchers, microbiologists and gastroenterologists, we here provide a guideline for scoring of histomorphological changes in mouse models of intestinal inflammation. Our schemata are easy and fast to apply as we focussed on main categories. If need be, the scores can be broadened by determining additional parameters employing (immuno)histochemistry e.g. composition of the infiltrate, degree of vascularisation, apoptosis rate. Employing the three categories according to the “first hit” might help all researchers working with mouse models of intestinal inflammation to classify their model into our schemata and finally compare their experimental findings unbiased.
Acknowledgements
This work was supported by the Deutsche Forschungsgemeinschaft/Collaborative Research Centre SFB633 granted to CL, MMH, MZ, BS, and AAK.
Disclosure of conflict of interest
None.
Supporting Information
References
- 1.Blumberg RS, Saubermann LJ, Strober W. Animal models of mucosal inflammation and their relation to human inflammatory bowel disease. Curr Opin Immunol. 1999;11:648–656. doi: 10.1016/s0952-7915(99)00032-1. [DOI] [PubMed] [Google Scholar]
- 2.DeVoss J, Diehl L. Murine models of inflammatory bowel disease (IBD): challenges of modeling human disease. Toxicol Pathol. 2014;42:99–110. doi: 10.1177/0192623313509729. [DOI] [PubMed] [Google Scholar]
- 3.Mizoguchi A. Animal models of inflammatory bowel disease. Prog Mol Biol Transl Sci. 2012;105:263–320. doi: 10.1016/B978-0-12-394596-9.00009-3. [DOI] [PubMed] [Google Scholar]
- 4.Reimann J, Rudolphi A, Claesson MH. Novel experimental approaches in the study of the immunopathology in inflammatory bowel disease. J Mol Med (Berl) 1995;73:133–140. doi: 10.1007/BF00198241. [DOI] [PubMed] [Google Scholar]
- 5.Elson CO, Sartor RB, Tennyson GS, Riddell RH. Experimental models of inflammatory bowel disease. Gastroenterology. 1995;109:1344–1367. doi: 10.1016/0016-5085(95)90599-5. [DOI] [PubMed] [Google Scholar]
- 6.Hoffmann JC, Pawlowski NN, Kuhl AA, Höhne W, Zeitz M. Animal models of inflammatory bowel disease: an overview. Pathobiology. 2002;70:121–130. doi: 10.1159/000068143. [DOI] [PubMed] [Google Scholar]
- 7.Strober W, Fuss IJ, Blumberg RS. The immunology of mucosal models of inflammation. Annu Rev Immunol. 2002;20:495–549. doi: 10.1146/annurev.immunol.20.100301.064816. [DOI] [PubMed] [Google Scholar]
- 8.Bernstein CN, Fried M, Krabshuis JH, Cohen H, Eliakim R, Fedail S, Gearry R, Goh KL, Hamid S, Khan AG, LeMair AW, Malfertheiner , Ouyang Q, Rey JF, Sood A, Steinwurz F, Thomsen OO, Thomson A, Watermeyer G. World Gastroenterology Organization Practice Guidelines for the diagnosis and management of IBD in 2010. Inflamm Bowel Dis. 2010;16:112–124. doi: 10.1002/ibd.21048. [DOI] [PubMed] [Google Scholar]
- 9.Asseman C, Mauze S, Leach MW, Coffman RL, Powrie F. An essential role for interleukin 10 in the function of regulatory T cells that inhibit intestinal inflammation. J Exp Med. 1999;190:995–1004. doi: 10.1084/jem.190.7.995. [DOI] [PMC free article] [PubMed] [Google Scholar]
- 10.Ostanin DV, Bao J, Koboziev I, Gray L, Robinson-Jackson SA, Kosloski-Davidson M, Price VH, Grisham MB. T cell transfer model of chronic colitis: concepts, considerations, and tricks of the trade. Am J Physiol Gastrointest Liver Physiol. 2009;296:G135–146. doi: 10.1152/ajpgi.90462.2008. [DOI] [PMC free article] [PubMed] [Google Scholar]
- 11.Kuhl AA, Pawlowski NN, Grollich K, Loddenkemper C, Zeitz M, Hoffmann JC. Aggravation of intestinal inflammation by depletion/deficiency of gammadelta T cells in different types of IBD animal models. J Leukoc Biol. 2007;81:168–175. doi: 10.1189/jlb.1105696. [DOI] [PubMed] [Google Scholar]
- 12.Okayasu I, Hatakeyama S, Yamada M, Ohkusa T, Inagaki Y, Nakaya R. A novel method in the induction of reliable experimental acute and chronic ulcerative colitis in mice. Gastroenterology. 1990;98:694–702. doi: 10.1016/0016-5085(90)90290-h. [DOI] [PubMed] [Google Scholar]
- 13.Hoffmann JC, Pawlowski NN, Grollich K, Loddenkemper C, Zeitz M, Kühl AA. Gammadelta T lymphocytes: a new type of regulatory T cells suppressing murine 2,4,6-trinitrobenzene sulphonic acid (TNBS)-induced colitis. Int J Colorectal Dis. 2008;23:909–920. doi: 10.1007/s00384-008-0535-8. [DOI] [PubMed] [Google Scholar]
- 14.Heller F, Fuss IJ, Nieuwenhuis EE, Blumberg RS, Strober W. Oxazolone colitis, a Th2 colitis model resembling ulcerative colitis, is mediated by IL-13-producing NK-T cells. Immunity. 2002;17:629–638. doi: 10.1016/s1074-7613(02)00453-3. [DOI] [PubMed] [Google Scholar]
- 15.Mottet C, Uhlig HH, Powrie F. Cutting edge: cure of colitis by CD4+CD25+ regulatory T cells. J Immunol. 2003;170:3939–3943. doi: 10.4049/jimmunol.170.8.3939. [DOI] [PubMed] [Google Scholar]
- 16.Berg DJ, Davidson N, Kuhn R, Müller W, Menon S, Holland G, Thompson-Snipes L, Leach MW, Rennick D. Enterocolitis and colon cancer in interleukin-10-deficient mice are associated with aberrant cytokine production and CD4(+) TH1-like responses. J Clin Invest. 1996;98:1010–1020. doi: 10.1172/JCI118861. [DOI] [PMC free article] [PubMed] [Google Scholar]
- 17.Sadlack B, Merz H, Schorle H, Schimpl A, Feller AC, Horak I. Ulcerative colitis-like disease in mice with a disrupted interleukin-2 gene. Cell. 1993;75:253–261. doi: 10.1016/0092-8674(93)80067-o. [DOI] [PubMed] [Google Scholar]
- 18.Baur P, Martin FP, Gruber L, Bosco N, Brahmbhatt V, Collino S, Guy P, Montoliu I, Rozman J, Klingenspor M, Tavazzi I, Thorimbert A, Rezzi S, Kochhar S, Benyacoub J, Kollias G, Haller D. Metabolic phenotyping of the Crohn's disease-like IBD etiopathology in the TNF(DeltaARE/WT) mouse model. J Proteome Res. 2011;10:5523–5535. doi: 10.1021/pr2007973. [DOI] [PubMed] [Google Scholar]
- 19.Kontoyiannis D, Pasparakis M, Pizarro TT, Cominelli F, Kollias G. Impaired on/off regulation of TNF biosynthesis in mice lacking TNF AU-rich elements: implications for joint and gut-associated immunopathologies. Immunity. 1999;10:387–398. doi: 10.1016/s1074-7613(00)80038-2. [DOI] [PubMed] [Google Scholar]
- 20.Seidel D, Eickmeier I, Kuhl AA, Hamann A, Loddenkemper C, Schott E. CD8 T cells primed in the gut-associated lymphoid tissue induce immune-mediated cholangitis in mice. Hepatology. 2014;59:601–11. doi: 10.1002/hep.26702. [DOI] [PubMed] [Google Scholar]
- 21.Heimesaat MM, Bereswill S, Fischer A, Fuchs D, Struck D, Niebergall J, Jahn HK, Dunay IR, Moter A, Gescher DM, Schumann RR, Göbel UB, Liesenfeld O. Gram-negative bacteria aggravate murine small intestinal Th1-type immunopathology following oral infection with Toxoplasma gondii. J Immunol. 2006;177:8785–8795. doi: 10.4049/jimmunol.177.12.8785. [DOI] [PubMed] [Google Scholar]
- 22.Rausch S, Huehn J, Loddenkemper C, Hepworth MR, Klotz C, Sparwasser T, Hamann A, Lucius R, Hartmann S. Establishment of nematode infection despite increased Th2 responses and immunopathology after selective depletion of Foxp3+ cells. Eur J Immunol. 2009;39:3066–3077. doi: 10.1002/eji.200939644. [DOI] [PubMed] [Google Scholar]
- 23.Dieleman LA, Palmen MJ, Akol H, Bloemena E, Peña AS, Meuwissen SG, Van Rees EP. Chronic experimental colitis induced by dextran sulphate sodium (DSS) is characterized by Th1 and Th2 cytokines. Clin Exp Immunol. 1998;114:385–391. doi: 10.1046/j.1365-2249.1998.00728.x. [DOI] [PMC free article] [PubMed] [Google Scholar]
- 24.Kitajima S, Takuma S, Morimoto M. Tissue distribution of dextran sulfate sodium (DSS) in the acute phase of murine DSS-induced colitis. J Vet Med Sci. 1999;61:67–70. doi: 10.1292/jvms.61.67. [DOI] [PubMed] [Google Scholar]
- 25.Ostanin DV, Pavlick KP, Bharwani S, D'Souza D, Furr KL, Brown CM, Grisham MB. T cell-induced inflammation of the small and large intestine in immunodeficient mice. Am J Physiol Gastrointest Liver Physiol. 2006;290:G109–119. doi: 10.1152/ajpgi.00214.2005. [DOI] [PubMed] [Google Scholar]
- 26.McSorley HJ, Hewitson JP, Maizels RM. Immunomodulation by helminth parasites: defining mechanisms and mediators. Int J Parasitol. 2013;43:301–310. doi: 10.1016/j.ijpara.2012.11.011. [DOI] [PubMed] [Google Scholar]
- 27.Deheragoda MG, Baithun S. Omental deposits of fetal parts as a sequal to salpingectomy for ruptured ectopic pregnancy. Histopathology. 2006;49:426. doi: 10.1111/j.1365-2559.2006.02371.x. [DOI] [PubMed] [Google Scholar]
- 28.Stange J, Hepworth MR, Rausch S, Zajic L, Kühl AA, Uyttenhove C, Renauld JC, Hartmann S, Lucius R. IL-22 mediates host defense against an intestinal intracellular parasite in the absence of IFN-gamma at the cost of Th17-driven immunopathology. J Immunol. 2012;188:2410–2418. doi: 10.4049/jimmunol.1102062. [DOI] [PubMed] [Google Scholar]
- 29.Schultz M, Tonkonogy SL, Sellon RK, Veltkamp C, Godfrey VL, Kwon J, Grenther WB, Balish E, Horak I, Sartor RB. IL-2-deficient mice raised under germfree conditions develop delayed mild focal intestinal inflammation. Am J Physiol. 1999;276:G1461–1472. doi: 10.1152/ajpgi.1999.276.6.G1461. [DOI] [PubMed] [Google Scholar]
- 30.Wirtz S, Finotto S, Kanzler S, Lohse AW, Blessing M, Lehr HA, Galle PR, Neurath MF. Cutting edge: chronic intestinal inflammation in STAT-4 transgenic mice: characterization of disease and adoptive transfer by TNF- plus IFN-gamma-producing CD4+ T cells that respond to bacterial antigens. J Immunol. 1999;162:1884–1888. [PubMed] [Google Scholar]
- 31.Fuss IJ, Boirivant M, Lacy B, Strober W. The interrelated roles of TGF-beta and IL-10 in the regulation of experimental colitis. J Immunol. 2002;168:900–908. doi: 10.4049/jimmunol.168.2.900. [DOI] [PubMed] [Google Scholar]
- 32.van Driel B, Liao G, Romero X, O'Keeffe MS, Wang G, Faubion WA, Berger SB, Magelky EM, Manocha M, Azcutia V, Grisham M, Luscinskas FW, Mizoguchi E, de Waal Malefyt R, Reinecker HC, Bhan AK, Wang N, Terhorst C. Signaling lymphocyte activation molecule regulates development of colitis in mice. Gastroenterology. 2012;143:1544–1554. e1547. doi: 10.1053/j.gastro.2012.08.042. [DOI] [PMC free article] [PubMed] [Google Scholar]
- 33.Shalapour S, Deiser K, Kuhl AA, Glauben R, Krug SM, Fischer A, Sercan O, Chappaz S, Bereswill S, Heimesaat MM, Loddenkemper C, Fromm M, Finke D, Hämmerling GJ, Arnold B, Siegmund B, Schüler T. Interleukin-7 links T lymphocyte and intestinal epithelial cell homeostasis. PLoS One. 2012;7:e31939. doi: 10.1371/journal.pone.0031939. [DOI] [PMC free article] [PubMed] [Google Scholar]
- 34.Powrie F, Leach MW, Mauze S, Caddle LB, Coffman RL. Phenotypically distinct subsets of CD4+ T cells induce or protect from chronic intestinal inflammation in C. B-17 scid mice. Int Immunol. 1993;5:1461–1471. doi: 10.1093/intimm/5.11.1461. [DOI] [PubMed] [Google Scholar]
- 35.Leithauser F, Krajina T, Trobonjaca Z, Reimann J. Early events in the pathogenesis of a murine transfer colitis. Pathobiology. 2002;70:156–163. doi: 10.1159/000068148. [DOI] [PubMed] [Google Scholar]
- 36.Wei B, Velazquez P, Turovskaya O, Spricher K, Aranda R, Kronenberg M, Birnbaumer L, Braun J. Mesenteric B cells centrally inhibit CD4+ T cell colitis through interaction with regulatory T cell subsets. Proc Natl Acad Sci U S A. 2005;102:2010–2015. doi: 10.1073/pnas.0409449102. [DOI] [PMC free article] [PubMed] [Google Scholar]
- 37.Gerdes J, Schwab U, Lemke H, Stein H. Production of a mouse monoclonal antibody reactive with a human nuclear antigen associated with cell proliferation. Int J Cancer. 1983;31:13–20. doi: 10.1002/ijc.2910310104. [DOI] [PubMed] [Google Scholar]
- 38.Kim YS, Ho SB. Intestinal goblet cells and mucins in health and disease: recent insights and progress. Curr Gastroenterol Rep. 2010;12:319–330. doi: 10.1007/s11894-010-0131-2. [DOI] [PMC free article] [PubMed] [Google Scholar]
- 39.Karam SM. Lineage commitment and maturation of epithelial cells in the gut. Front Biosci. 1999;4:D286–298. doi: 10.2741/karam. [DOI] [PubMed] [Google Scholar]
- 40.Mcmanus JF. Histological demonstration of mucin after periodic acid. Nature. 1946;158:202. doi: 10.1038/158202a0. [DOI] [PubMed] [Google Scholar]
- 41.Jenkins D, Balsitis M, Gallivan S, Dixon MF, Gilmour HM, Shepherd NA, Theodossi A, Williams GT. Guidelines for the initial biopsy diagnosis of suspected chronic idiopathic inflammatory bowel disease. The British Society of Gastroenterology Initiative. J Clin Pathol. 1997;50:93–105. doi: 10.1136/jcp.50.2.93. [DOI] [PMC free article] [PubMed] [Google Scholar]
- 42.Jenkins D, Goodall A, Scott BB. Simple objective criteria for diagnosis of causes of acute diarrhoea on rectal biopsy. J Clin Pathol. 1997;50:580–585. doi: 10.1136/jcp.50.7.580. [DOI] [PMC free article] [PubMed] [Google Scholar]
- 43.Ryan GB, Cliff WJ, Gabbiani G, Irlé C, Montandon D, Statkov PR, Majno G. Myofibroblasts in human granulation tissue. Hum Pathol. 1974;5:55–67. doi: 10.1016/s0046-8177(74)80100-0. [DOI] [PubMed] [Google Scholar]
- 44.Schlingemann RO, Rietveld FJ, Kwaspen F, van de Kerkhof PC, de Waal RM, Ruiter DJ. Differential expression of markers for endothelial cells, pericytes, and basal lamina in the microvasculature of tumors and granulation tissue. Am J Pathol. 1991;138:1335–1347. [PMC free article] [PubMed] [Google Scholar]
- 45.Goldgraber MB. Pseudopolyps in ulcerative colitis. Dis Colon Rectum. 1965;8:355–363. doi: 10.1007/BF02627260. [DOI] [PubMed] [Google Scholar]
- 46.Mahler M, Bristol IJ, Leiter EH, Workman AE, Birkenmeier EH, Elson CO, Sundberg JP. Differential susceptibility of inbred mouse strains to dextran sulfate sodium-induced colitis. Am J Physiol. 1998;274:G544–551. doi: 10.1152/ajpgi.1998.274.3.G544. [DOI] [PubMed] [Google Scholar]
- 47.Bansemir AD, Sukhdeo MV. The food resource of adult Heligmosomoides polygyrus in the small intestine. J Parasitol. 1994;80:24–28. [PubMed] [Google Scholar]
- 48.Urban JF Jr, Madden KB, Svetic A, Cheever A, Trotta PP, Gause WC, Katona IM, Finkelman FD. The importance of Th2 cytokines in protective immunity to nematodes. Immunol Rev. 1992;127:205–220. doi: 10.1111/j.1600-065x.1992.tb01415.x. [DOI] [PubMed] [Google Scholar]
- 49.Gause WC, Urban JF Jr, Stadecker MJ. The immune response to parasitic helminths: insights from murine models. Trends Immunol. 2003;24:269–277. doi: 10.1016/s1471-4906(03)00101-7. [DOI] [PubMed] [Google Scholar]
- 50.Matsumoto S, Okabe Y, Setoyama H, Takayama K, Ohtsuka J, Funahashi H, Imaoka A, Okada Y, Umesaki Y. Inflammatory bowel disease-like enteritis and caecitis in a senescence accelerated mouse P1/Yit strain. Gut. 1998;43:71–78. doi: 10.1136/gut.43.1.71. [DOI] [PMC free article] [PubMed] [Google Scholar]
- 51.Schaefer JS, Montufar-Solis D, Nakra N, Vigneswaran N, Klein JR. Small intestine inflammation in Roquin-mutant and Roquin-deficient mice. PLoS One. 2013;8:e56436. doi: 10.1371/journal.pone.0056436. [DOI] [PMC free article] [PubMed] [Google Scholar]
Associated Data
This section collects any data citations, data availability statements, or supplementary materials included in this article.